Skip to content
Azavea
  • What We Do
  • Research
  • About
  • Blog
  • Careers
  • Contact Us

Featured Posts

Software Engineering

Cloud Detection in Satellite Imagery

By James McClain on February 8th, 2021

Company

This Month We Learned — February 2021

By Casey Cesari and James Santucci on March 25th, 2021

  • All Categories
  • Company
  • Spatial Analysis
  • Events
  • Software Engineering
  • Design
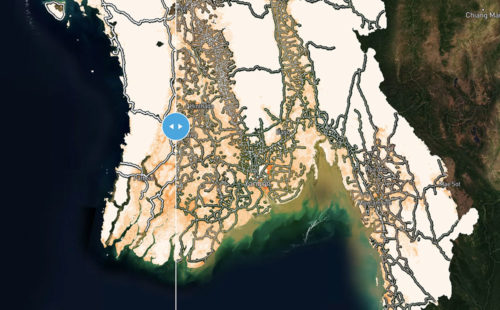
Screenshot of Rural Access Index data available for the south coast of Myanmar.

Spatial Analysis

Calculating Rural Road Access Globally Using Open Datasets

By Ross Bernet on December 20th, 2019

We used three open datasets to calculate the number of people in the world who do not have sufficient access to a road in an effort to move forward the conversation on the Rural Access Indicator (RAI).
Spatial Analysis

Housing & Landlords: Using Open Data to Find Substandard Conditions

By Fay Walker on September 26th, 2019

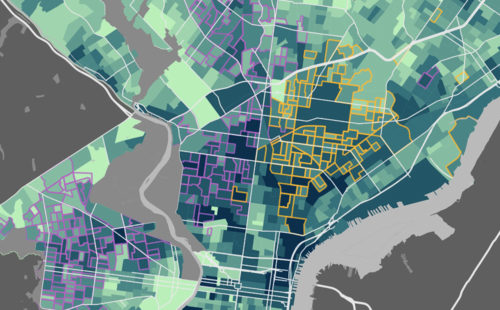
Using R and QGIS to analyze substandard housing in Philadelphia with open data. We used open data to identify violations, evictions, and illegal rentals.
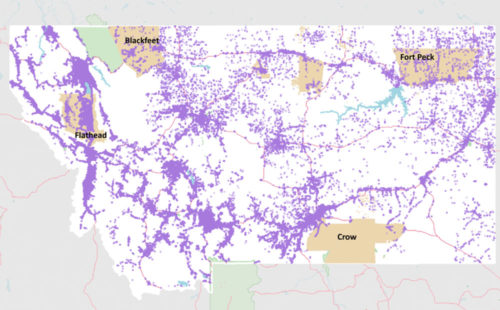
Map highlight Native American areas that have been geocoded.

Spatial Analysis

Putting Native American Voters on the Map: Using Cadastral Data to Geocode Non-Traditional Addresses

By Fay Walker on September 12th, 2019

We used cadastral land survey data to geocode previously unmappable Native American voters in Montana.
Picture of countryside road side-by-side a torn aerial cityview.

Spatial Analysis

Exploring the Urban-Rural Divide through Politicians’ Social Media

By Luke McKinstry on July 23rd, 2019

In this blog we look at how urban-rural differences play out in the way elected officials adopt social media and hope to shed light on this supposed wedge in a divided country.
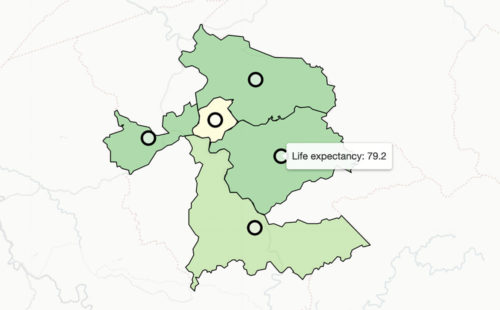
Crop of an interactive map showing census blocks in West Virginia with the life expectancy of one highlighted.

Spatial Analysis

Analyzing Spatial Patterns in Life Expectancy with Python

By Simon Kassel on May 2nd, 2019

All around the country boundaries separate neighborhoods with high and low life expectancy. We used python to find the most extreme examples.
Districts of Philadelphia overlaid on top of a photo of a child swinging with the sky and playground in the background.

Spatial Analysis

Scoring Philadelphia’s City Council Districts for Children’s Health and Well-being

By Daniel McGlone on April 16th, 2019

Scoring Philadelphia City Council districts on assets and risks using a weighted spatial analysis model in R and Python.
  • Previous
  • 1
  • 2
  • 3
  • 4
  • 5
  • …
  • 37
  • Next
azavea-logo-white
990 Spring Garden,
5th Floor
Philadelphia, PA 19123
(215) 925-2600
Contact Us

Company

  • About
  • What We Do
  • Research
  • Careers
  • Blog
  • Press

Services

  • Software Engineering
  • Data Analytics
  • User Experience Design
  • Big Data Processing
  • Machine Learning
  • R&D

Newsletter

Stay in touch, spam-free. Sign up
Terms of Use • Privacy Policy • Directions
© 2023 Azavea