
Two current major forces in politics are the so called urban-rural divide and the emergence of social media platforms as a consequential forum for public discourse. In this blog, we look at how urban-rural differences play out in the way elected officials adopt social media and hope to shed light on this supposed wedge in a divided country. For a great analysis of the definition and history of the urban-rural divide concept, we recommend this story from The Upshot at The New York Times.
Cicero is a comprehensive database of elected officials, contact information, social media identifiers, and legislative districts. By tracking and continually updating social media information for national, state, and local officials (i.e. Mayors and City Council for a growing list of localities in the United States and Canada) in our platform – we get a good picture of how politicians are choosing to communicate. In the past, we have written blogs to provide insight on advocacy campaign strategy such as where to use email versus webforms, and the relative benefits of phone, paper mail, and electronic communication. Today, we focus on how we see elected officials using social media – with the help of US Census data to illuminate how differences fall along the urban-rural political fault line.
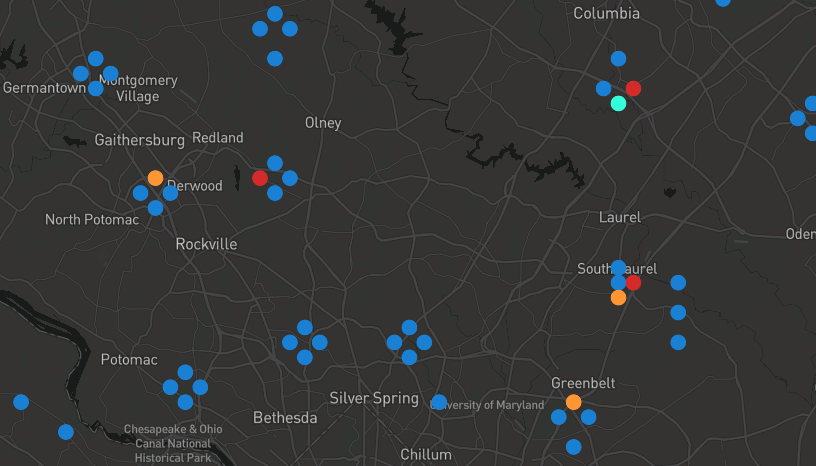
Elected Officials Social Media Utilization. Explore the Full Map Here.
Do patterns in this map indicate urban-rural patterns in how elected officials use social media? The answer seems to be YES. In the United States while national officials mostly use both Facebook and Twitter, at the state and local levels urban officials frequently use Twitter, and rural officials favor using only Facebook or abstaining from social media altogether.
We merged the social media data used to make the map with US demographic statistics and found politicians using only Facebook represent districts that consist of 41% urban areas, while officials who use Twitter represent districts that are 59% urban. Moreover, social media use by politicians correlates to higher population density, household income, and access to the internet and lower median age. Continue reading for a detailed look at how we collected and analyzed this data and visualized our findings.
Jittering to Avoid Centroid Overlap
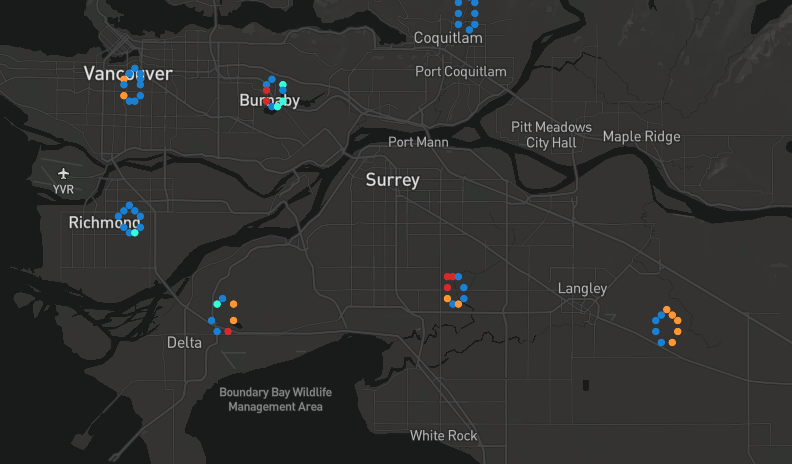
Each map point represents an elected official and is located at the center of their representative district, but you may notice clusters or circles of dots in some locations. These cases, such as British Columbia local officials or Maryland state officials shown below, occur where multiple officials represent a geographic area. To avoid plotting overlapping points, we wrote a small jitter function to create an evenly spaced circle around the centroid (see the code here).

State officials in Maryland, where each district is represented by 3 Delegates and 1 Senator. 
Local officials in British Columbia, where officials in most localities serve at-large
Demographic and Social Media Differences in Urban and Rural districts
Beyond the map, to look for demographic patterns in the way elected officials use social media, we created a data pipeline to gather statistics from the US Census for each district. Here is a summary of the variables that we collected segmented by officials who use the social media platforms Facebook and Twitter.
Breakdown by Social Media Platform
| On Twitter | Not on Twitter | On Facebook | Not on Facebook | |
| State and Local Officials | 5,835 | 4,225 | 8,802 | 1,258 |
| Population Density (pop./km2) | 149 | 85 | 124 | 102 |
| Median Household Income ($) | 62,793 | 58,513 | 61,454 | 57,783 |
| Internet Access (%) | 0.78 | 0.76 | 0.78 | 0.75 |
| Median Age | 38.3 | 38.7 | 38.4 | 38.9 |
| Urban (%) | 0.59 | 0.41 | 0.56 | 0.44 |
Collecting Census Data for Political Districts
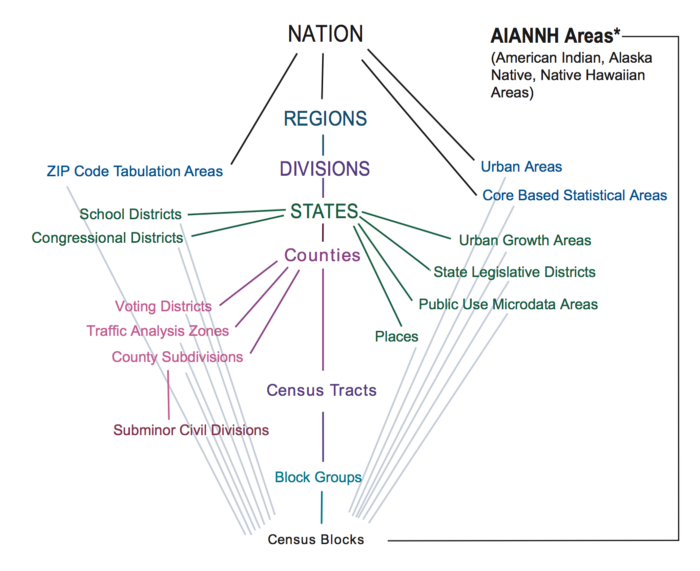
Before detailing and visualizing the findings in the next section, first, we will summarize how we gathered the data. We used the 2017 American Community Survey (ACS) – a data set that is released annually and contains detailed information on the demographic and socioeconomic landscape of the United States. We collected information available at the Census Tract level, which is near the bottom of the US Census hierarchy.
For each census tract, we used the Census API to collect the following information:
- Population
- Median Household Income
- Median Age
- Percent with Internet Access
For a guide to variables available in the ACS, click here. For sample Census API calls visit here.
We then aggregated this information to the district boundaries for all state legislative officials and local officials. District boundaries for state legislatures are available here from the US Census for upper chambers (SLDU) and lower chambers (SLDL). For example, you can download the 2017 file for the Pennsylvania (GEOID: 42) General Assembly (SLDL) with curl https://www2.census.gov/geo/tiger/GENZ2017/shp/cb_2017_42_sldl_500k.zip. Boundaries from local chambers are harder to come by but can often be found on open data portals. In total, we collected roughly 7,000 state districts and 3,000 local districts.
Political districts at the state and local level do not align perfectly to Census Tracts, so we used an area weighted join to aggregate the data.
Designating Urban and Rural Areas
It is key to this analysis to understand which officials represent urban and rural areas. Population density is an imperfect classifier. Instead, we used the US Census Urban Rural Criteria – which can be roughly summarized as areas either 1) meeting a high population density threshold or 2) meeting a lower population density threshold and having proximity to a place above the higher threshold. 2010 Census Urban Areas are shown below.

2010 Census United States Urban Areas


Source: QGIS Documentation

For each of the 10,000 districts where we collected boundaries and demographic statistics, we needed to determine what percentage of the district was within an urban area. To accomplish this, we collected the national shapefile of US urban areas. Next, we used an intersection to calculate the percentage of each political district within an urban area.
Joining Cicero Data to Census Data with OpenCivicData Identifiers

Cicero is a comprehensive database of elected officials and legislative districts. Cicero enables you to match constituents with their representatives based on address-level data, leading to endless possibilities.
To understand the social media accounts of the officials representing each of the 10,000 districts we previously collected, we gathered their records from Cicero. Merging the elected official records to the district boundary and demographics data set is a 1:1 join operation (or many:1 when multiple officials represent a district). OpenCivicData Identifiers (OCD-IDs) are an open standard for defining civic data – and make it possible to match political district records from different data sources.
Cicero makes OCD-IDs available in a standard API response. Census state legislative boundaries (the sldl and sldu files from the previous section) use a different identifier for districts, so there is a key file from the OpenCivicData Foundation that makes it possible to match a census district ID to the OCD-ID identifier. After executing this join, we are left with a dataset consisting of the following:
- Political district boundary (from the sldl and sldu files for state officials, and Cicero for local officials)
- Demographic data from the 2017 ACS for the district (collected from the Census API)
- Elected official biographical and social media information form Cicero.
Viewing the Dataset
State and Local Districts with Highest Median Household Income
| Official | District | Population | Median Age | Median Household Income ($) | Internet Access (%) | Urban (%) |
| Bob Lion | Stamford Board of Representatives (19) CT | 6,483 | 48.0 | 220,633 | 0.96 | 0.55 |
| Raven Matherne | Stamford Board of Representatives (19) CT | 6,483 | 48.0 | 220,633 | 0.96 | 0.55 |
| Tom O’Dea | Connecticut House of Representatives (125) CT | 25,063 | 42.7 | 200,870 | 0.95 | 0.91 |
| Kathleen Murphy | Virginia House of Delegates (34) VA | 86,223 | 43.4 | 187,073 | 0.95 | 0.83 |
| Terrie Wood | Connecticut House of Representatives (141) CT | 26,064 | 40.7 | 185,978 | 0.93 | 0.89 |
| Betsy Nash | Menlo Park City Council (4) CA | 6,854 | 41.6 | 185,004 | 0.92 | 1.00 |
| Livvy Floren | Connecticut House of Representatives (149) CT | 25,128 | 46.2 | 183,709 | 0.94 | 0.35 |
| Alice Peisch | Massachusetts House of Representatives (170) MA | 44,144 | 38.2 | 183,652 | 0.91 | 1.00 |
| Dennis Mahoney | Stamford Board of Representatives (20) CT | 6,598 | 46.7 | 183,253 | 0.93 | 1.00 |
| Susan Nabel | Stamford Board of Representatives (20) CT | 6,598 | 46.7 | 183,253 | 0.93 | 1.00 |
State and Local Districts with Lowest Median Household Income
| Official | District | Population | Median Age | Median Household Income ($) | Internet Access (%) | Urban (%) |
| Phyllis Cleveland | Cleveland City Council (5) OH | 21,130 | 30.3 | 14,774 | 0.45 | 1.00 |
| Avra Reddy | Madison Common Council (8) WI | 10,210 | 20.3 | 16,816 | 0.68 | 1.00 |
| Marty Small | Atlantic City Council (2) NJ | 5,591 | 30.5 | 17,970 | 0.51 | 0.94 |
| Adam Gomez | Springfield City Council (1) MA | 18,541 | 31.8 | 18,210 | 0.53 | 1.00 |
| Basheer Jones | Cleveland City Council (7) OH | 19,507 | 38.8 | 19,160 | 0.48 | 1.00 |
| Danilo Burgos | Pennsylvania House of Representatives (197) PA | 61,281 | 32.3 | 19,276 | 0.46 | 1.00 |
| Evelyn Woodson | Columbus City Council (7) GA | 20,450 | 32.5 | 20,532 | 0.52 | 0.95 |
| Margo Sommerville | Akron City Council (3) OH | 19,431 | 32.3 | 20,683 | 0.57 | 1.00 |
| Yvonne Harper | Toledo City Council (4) OH | 35,401 | 34.0 | 21,435 | 0.59 | 1.00 |
| Denise Moore | Peoria City Council (1) IL | 19,072 | 30.4 | 21,498 | 0.47 | 1.00 |
State and Local Districts with Highest Percent Households with Internet Access
| Official | District | Population | Median Age | Median Household Income ($) | Internet Access (%) | Urban (%) |
| Chris Croft | Kansas House of Representatives (8) KS | 27,210 | 38.4 | 139,128 | 0.98 | 0.98 |
| Patty Smith | Aurora City Council (8) IL | 18,137 | 36.6 | 119,382 | 0.97 | 1.00 |
| Marlo Alston | Centennial City Council (4) CO | 25,055 | 40.0 | 115,560 | 0.97 | 1.00 |
| Ron Weidmann | Centennial City Council (4) CO | 25,055 | 40.0 | 115,560 | 0.97 | 1.00 |
| Bridget Binsbacher | Peoria City Council (Mesquite) AZ | 25,464 | 39.5 | 113,780 | 0.97 | 0.10 |
| Patrick Duffy | Surprise City Council (3) AZ | 24,908 | 32.4 | 78,410 | 0.97 | 0.66 |
| Bob Lion | Stamford Board of Representatives (19) CT | 6,483 | 48.0 | 220,633 | 0.96 | 0.55 |
| Raven Matherne | Stamford Board of Representatives (19) CT | 6,483 | 48.0 | 220,633 | 0.96 | 0.55 |
State and Local Districts with Lowest Percent Households with Internet Access
| Official | District | Population | Median Age | Median Household Income ($) | Internet Access (%) | Urban (%) |
| Joe Shirley | Apache County Board of Supervisors (1) AZ | 21,893 | 29.1 | 24,723 | 0.23 | 0.00 |
| Alton Shepherd | Apache County Board of Supervisors (2) AZ | 24,461 | 33.8 | 25,564 | 0.24 | 0.00 |
| Doreen Johnson | New Mexico House of Representatives (5) NM | 28,454 | 31.7 | 31,149 | 0.33 | 0.00 |
| Solomon Osborne | Mississippi House of Representatives (32) MS | 18,257 | 33.4 | 24,714 | 0.35 | 0.10 |
| Roberto Balli | Laredo City Council (8) TX | 29,232 | 29.8 | 23,425 | 0.35 | 0.98 |
| Lee Jack | Navajo County Board of Supervisors (1) AZ | 24,246 | 33.1 | 29,513 | 0.37 | 0.00 |
| John Collins-Muhammad | St. Louis Board of Aldermen (21) MO | 6,403 | 40.6 | 25,329 | 0.37 | 1.00 |
| Ricardo Longoria | Brownsville City Commission (1) TX | 41,212 | 30.6 | 25,014 | 0.37 | 0.84 |
| Jesse Thompson | Navajo County Board of Supervisors (2) AZ | 18,714 | 32.6 | 30,942 | 0.38 | 0.00 |
| George Munoz | New Mexico State Senate (4) NM | 49,724 | 34.6 | 33,521 | 0.39 | 0.00 |
Analysis and Key Takeaways
To view distributions and relationships between variables, we use a facetgrid from Seaborn, a Python data visualization library based on Matplotlib.
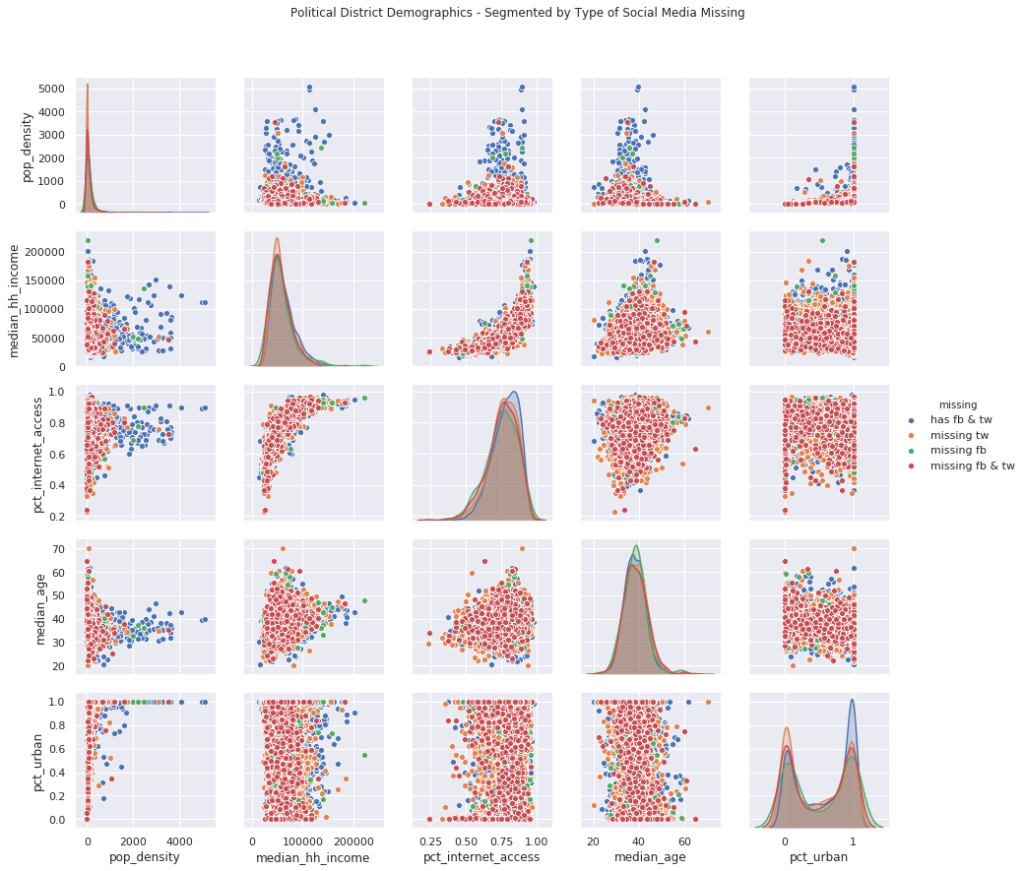
Three Initial takeaways:
- There is a linear relationship between Median Household Income and Percent Internet Access. This plot will be useful to show demographics and characteristics of districts.
- For Internet Access, there are distinct distributions for districts where the official uses both Facebook and Twitter versus districts where officials are not using one or both services.
- Percent Urban is a bimodal distribution. Most officials represent either an entirely urban or entirely rural district. In other words, few officials represent districts with a mix of urban and rural constituents. This certainly supports the urban-rural divide idea. (Perhaps larger US congressional districts have a greater mix of urban and rural areas )
Key Insight: In the Percent Urban distribution plot, we see clearly distinct distributions for districts where the official uses both Facebook and Twitter, uses just one of Facebook or Twitter, or uses neither.
It turns out, this is entirely due to differences between urban and rural state legislative officials. In the next plot, we remove local officials, who mostly serve entirely urban districts. (This is by design since Cicero primarily carries local data for cities with a population over 100,000, which easily meets the US Census criteria for Urban).
Major Divergence in State Legislatures
We found substantial differences in how officials in state legislatures use social media corresponding to whether they represent urban or rural areas. So, looking at Percent Urban distributions segmented by official social media usage is the most informative.
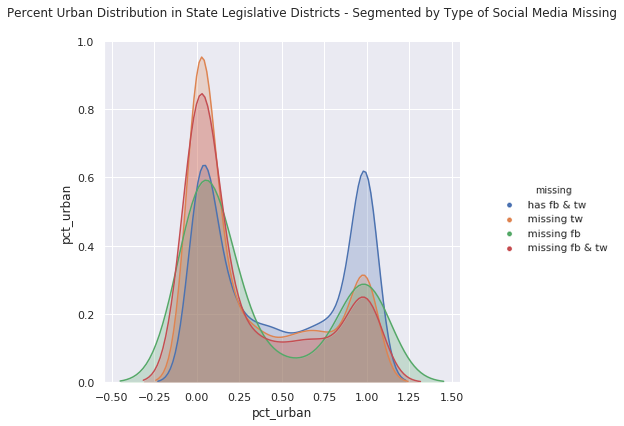
- Officials with Facebook and Twitter have an equal distribution between urban and rural districts. In other words, lots of officials carry both forms of social media.
- The 3 distributions of officials missing social media skew rural:
- The distribution of officials missing only Twitter is heavily skewed towards rural areas.
- Similarly, the distribution of officials missing both Facebook and Twitter is also heavily skewed towards rural areas.
- Officials missing only Facebook are more commonly rural than urban, but the distribution is far less skewed than for officials missing a Twitter or officials missing both Facebook and Twitter.
Back to the original question again – do patterns in the way elected officials use social media reflect the urban-rural divide in politics? We see compelling signs that the answer is YES. While many officials across the demographic spectrum have adopted social media, urban officials favor Twitter, and rural officials favor using only Facebook, or abstain from social media altogether and presumably communicate through other means.
State by State Plots
Since this analysis involved thousands of elected officials and their districts, it would be informative to break down this data to the state level. The photo scroll below plots social media use, median household income, and internet access in each state. This granular level provides insights into the specific data points discussed.
We hope this blog provided insight into how elected officials use social media and demonstrated a useful approach to merging political, demographic and geospatial data. Big thanks to the Azavea Data Analytics team for learning from their project template to extract and transform the project data. Visit the Cicero website to learn more about our work and the election data we keep.