
This post is part of a series of articles written by 2019 Summer of Maps Fellows. Azavea’s Summer of Maps Fellowship Program is run by the Data Analytics team and provides impactful Geospatial Data Analysis Services Grants for nonprofits and mentoring expertise to fellows. To see more blog posts about Summer of Maps, click here.
Why does substandard housing matter?
Over half of Philadelphia renters are rent-burdened, which means spending over one-third of one’s income on housing. Nearly one-third of these renters are even more burdened, spending over 50 percent of their salary on housing. Rising home prices and pervasive evictions are two key components of the housing crisis seen across the United States. Last year, another Summer of Maps project focused on evictions in New Orleans. This year, we’re diving deeper and looking at numerous indicators to understand the quality and stability of housing in Philadelphia.
Substandard housing is a particularly salient issue in Philly because the median house age is 93 years old. This makes Philadelphia housing stock about 40 years older than homes across other major US cities. Older housing stock is more difficult to maintain, and when not maintained can lead to negative health outcomes. Poorly maintained properties have been linked to increased instances of asthma and lead poisoning, for example. Given this larger context, together with the Public Interest Law Center, we set out to determine, how does substandard housing impact Philadelphia and who are the entities responsible for substandard housing?
How to count substandard housing?
Defining substandard housing indicators
There are two key challenges in identifying substandard housing:
- There is no standard definition around what constitutes substandard housing. L&I categorizes violations into “hazardous”, “unsafe”, “imminently dangerous”, and “non-hazardous”. However, this does not provide insight into what kinds of violations are health and safety risks versus nuisances.
- L&I only conducts inspections reactively in response to 311 calls. This means that the responsibility is on the renter to report issues, even if they fear reprisal from their landlord. As a result, many homes will be unreported and violations will continue to go un-inspected, while homes that are reported are likely to be inspected multiple times.
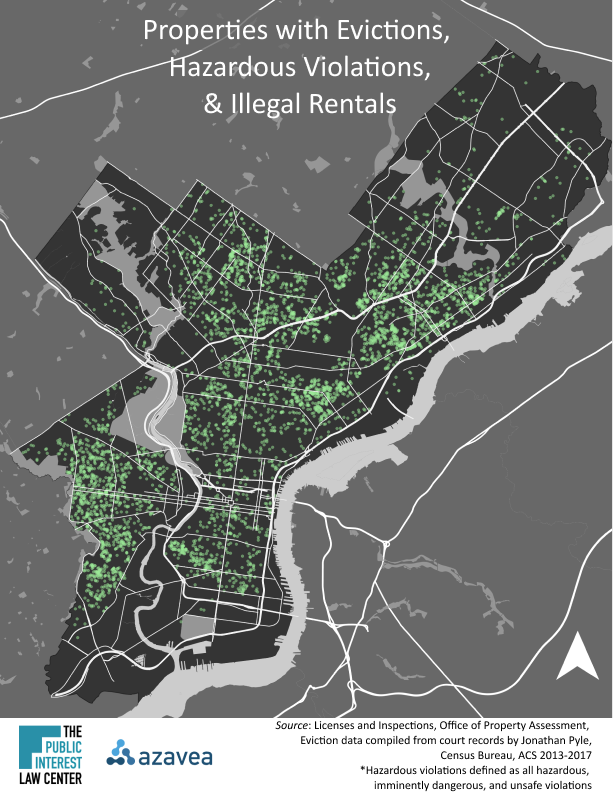
In this piece we will look at three indicators:
- Hazardous violations: classified by L&I as “hazardous,” “unsafe,” or “imminently dangerous”
- Potential illegal rentals: non-owner occupied housing that is not vacant and does not have up-to-date rental licenses
- Evictions: recorded through court proceedings
We chose these indicators of substandard housing because together they constitute housing stock that poses health hazards and lacks landlord accountability measures for tenants.
Open data for housing
This analysis was primarily built off of publicly available data from OpenDataPhilly and the Census Bureau. We also relied on eviction docket data scraped by Jonathan Pyle from Philadelphia Legal Assistance. Because we were working with messy data from different sources, our primary challenge was combining the following datasets together into one dataset:
- Property Assessments (from the Office of Property Assessment via OpenDataPhilly)
- Licensing and Inspection Code Violations (from Licenses and Inspections via OpenDataPhilly)
- Business Licenses (from Licenses and Inspections via OpenDataPhilly)
Additional data was collected to inform both our exploratory analysis and our model development:
- Docket of Eviction Cases 2014-2016 (from Philadelphia Legal Assistance)
- Socioeconomic and Demographic Data (2013-2017 American Community Survey)
To make the data more manageable, data was limited to the years 2016-2018. For a step-by-step guide on wrangling and joining housing data together, the code has been hosted on the Summer of Maps GitHub.
Methodology
To determine the number of landlords in Philadelphia, we started by filtering down our data to only non-owner-occupied properties. If a tax mailing address was different than a house address, we assumed that this property was not owner-occupied. We then grouped these non-owner-occupied properties by their mailing addresses to determine the number of landlords in Philadelphia. We used mailing addresses rather than owner name because it is increasingly common to register properties as shell companies. This means that if a landlord owns ten properties, according to OPA data, they could all show up as different LLCs, but theoretically they would all still use the same mailing address.
Using mailing addresses is by no means foolproof. It is possible for the same landlord to use multiple mailing addresses. Despite extensive address cleaning, there remains internal data inconsistencies. That being said, mailing addresses still provide us with the best option in trying to connect properties under the same ownership.
We then determined the number of LLCs by finding properties that included variations of the following in their owner column:
- LLC
- LP
- Agency
- Partners
- Association
- Limited
- Development
- Group
Most, but not all, of these incorporated entities are registered limited liability companies (LLCs). For the purposes of this blog, I will refer to all incorporated entities as LLCs. Once we identified these landlords, we then counted the number of LLC-owned properties at the block group level. This allowed us to explore the relationship between LLC-owned properties and substandard housing and race.
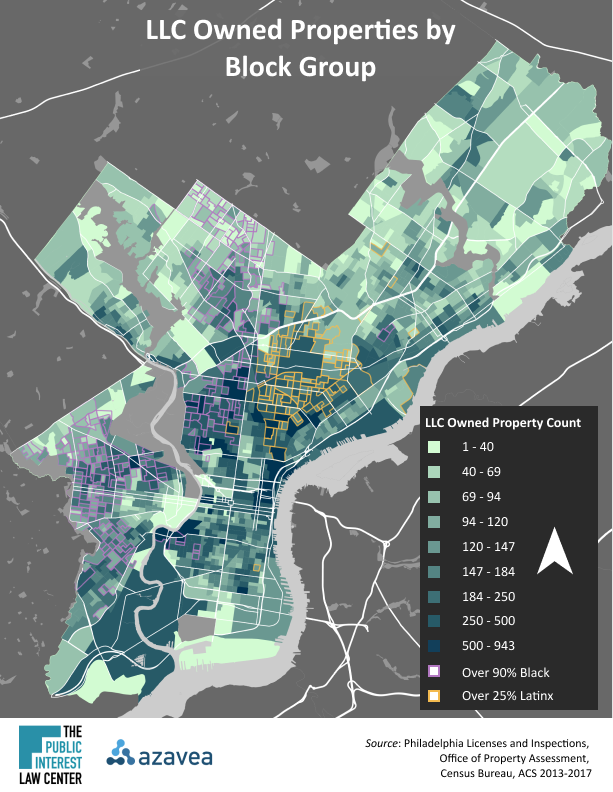
Who owns substandard housing?
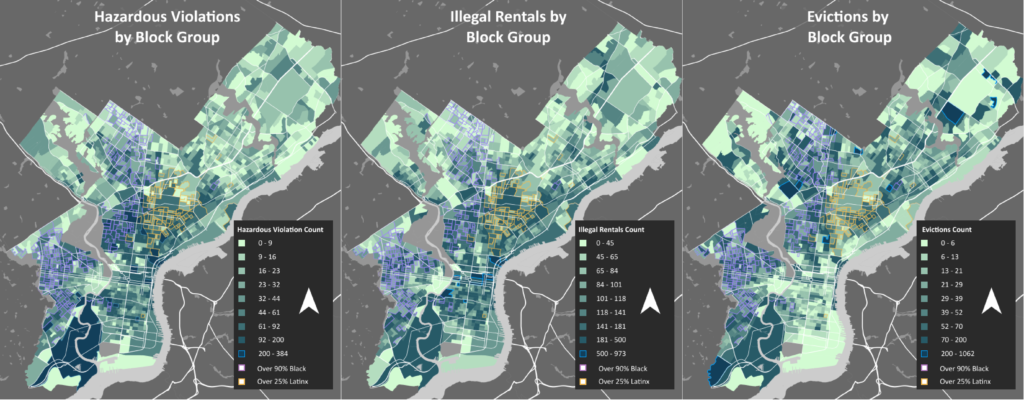
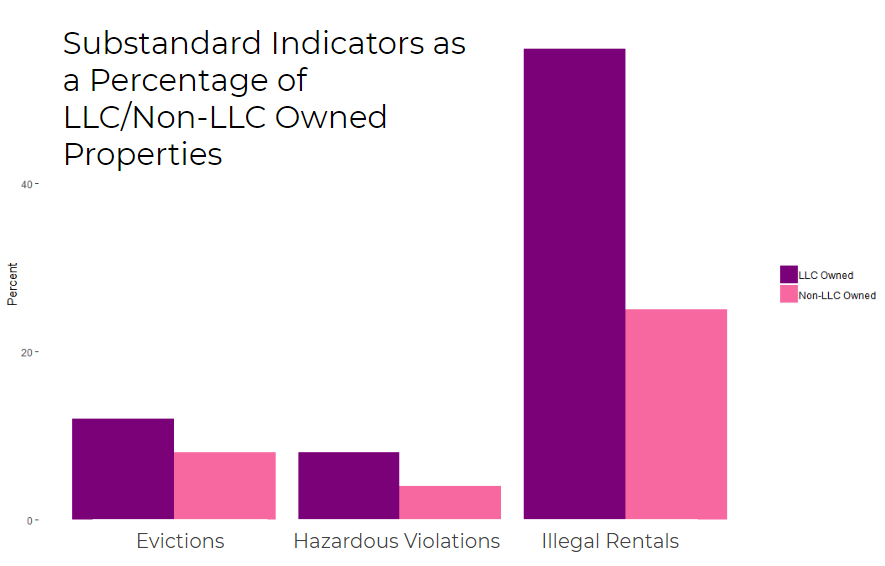
An estimated 25 percent of non-owner-occupied properties are owned by some sort of incorporated entity. We found that LLCs are disproportionately responsible for many substandard housing indicators. LLCs are also more likely to have substandard housing in communities of color. We can see that LLCs are concentrated in the same areas of north Philly and eastern north Philly where there are large Black and Latino populations, and high counts for illegal rentals and hazardous violations.
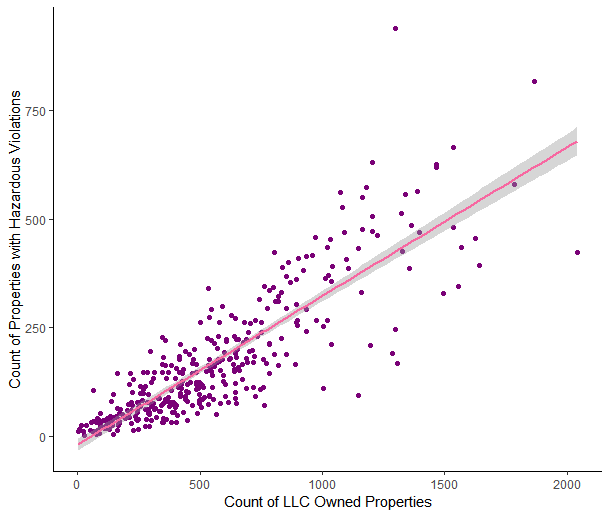
Perhaps the most glaring example of this was the correlation between LLCs and hazardous violations. For every additional LLC-owned property in a block group, there was a 0.86 increase in hazardous violations.
When we compare the percentage of LLC-owned properties and non-LLC owned properties that have substandard housing indicators, we can see that LLC-owned properties have proportionally more substandard housing indicators.
When we break these numbers down further, we can also see that, with the exception of evictions, these LLC-owned properties with substandard indicators that are also more concentrated in communities of color.
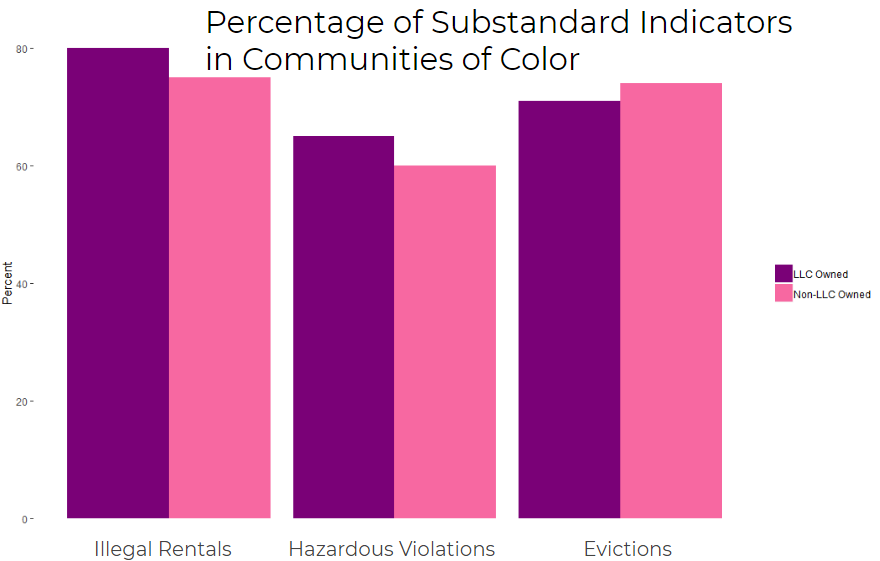
Ultimately, this shows that the effect of substandard housing is not shared equally across the Philadelphia population. Communities of color are disproportionately impacted. This also shows that LLC-owned properties are more likely than non-LLC owned properties to be responsible for substandard housing conditions.
What does this mean for Philadelphia?
The myth of the mom and pop landlord
Over 25 percent of rental properties are owned by incorporated entities of some sort. There are very few transparency mechanisms that hold these shell companies accountable, or even traceable. If it is difficult to determine who owns a property. It becomes even more difficult to determine who are the systemic offenders, or to connect patterns to each other. In June, Congress passed the Corporate Transparency Act, which mandates that all applicants for shell corporations must report owner information. While this is an important step, the law would not require this information to be public and would be moot unless local implementation measures were taken.
Last fall, Councilwoman Blondell Reynolds Brown, introduced a bill to city council that would require property owners to provide their names and mailing addresses when applying for a residential or commercial rental license. Making this data available is an important first step. If Philadelphia wants to address blight, the city must first acknowledge that we do not know who 25 percent of the landlords in Philadelphia are. But beyond that, data about housing ownership must be applied in order to hold landlords accountable.
Need for pro-active violations inspections
L&I’s current reactive method of inspecting properties according to 311 complaints limits their capacity to go after entities that we know to be repeat offenders and areas of the city we know to be disproportionately impacted by substandard housing. Instead, it creates a feedback loop where the same homes are inspected over and over again. Part of what is so difficult about identifying substandard housing is that it is undercounted and, literally, not on the map. If Philadelphia wants to identify substandard housing more effectively, then L&I must move beyond solely relying on 311 calls and must instead go after owners responsible for substandard conditions.