
We estimate that over one billion people do not have sufficient access to a road. This figure comes with a string of caveats, but it can help move the conversation forward on the Rural Access Indicator (RAI), one of the most important global development indicators in the transportation sector.
What is the RAI and why should you care?
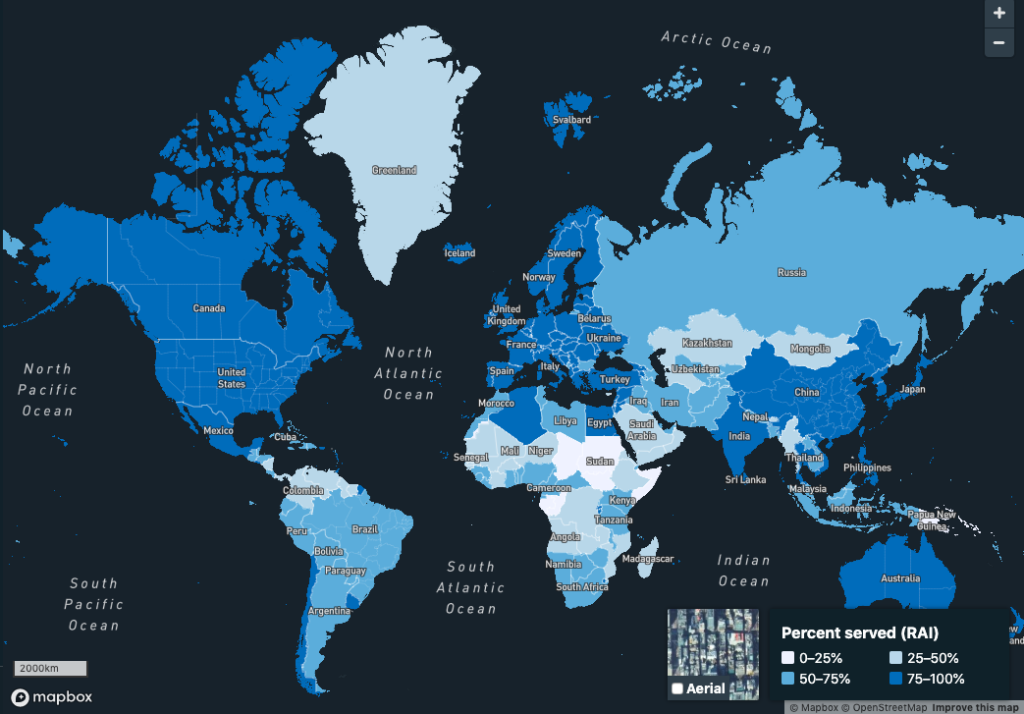
The Rural Access Indicator (RAI) is the proportion of the rural population who live within two kilometers of an all-season road. It is a proxy for transport connectivity. Transport connectivity provides a measure of access to vital services; educational, economic, health, etc. The RAI was developed in 2006 by the World Bank and was adopted by the UN as SDG Indicator 9.1.1.
In many developing countries, the majority of farmers are disconnected from local, regional, and global markets. This lack of access can perpetuate cycles of poverty. Improved understanding of where infrastructure is deficient can help prioritize investments to connect people through sustainable and resilient infrastructure to support economic development and human well-being.
How did Azavea get involved?
Azavea provides geospatial processing support to the UN Global Platform, which has a goal to provide a collaborative environment for sharing data and methodologies for the global statistical community, including SDG calculations. After discussions at last year’s UN World Data Forum with folks at the UK Office of National Statistics, we identified SDG 9.1.1 as a great example of an SDG indicator that could be calculated at a global scale using open datasets. We believe that by providing a benchmark value for an SDG using open datasets, we can encourage countries to participate by providing better data.
One of the explicit goals of the project was to lower the barrier of entry to report on SDG indicator 9.1.1, which is synonymous with the RAI, help to elevate it from a Tier II to a Tier I indicator, and move the conversation forward for interested stakeholders. Azavea connected with representatives from ReCAP and discovered overlapping goals for promoting the RAI and SDG 9.1.1., and with funding from UKAID we were able to create this proof of concept application.
Visit the tool: rai.azavea.com
How did we measure the RAI globally?
Two key pieces of information are required to calculate the RAI: roads and population. We need to know the location and quality of roads and we need to know where people live and whether they are rural or urban dwellers.
Three open datasets provide a useful starting point for this data; OpenStreetMap for road data, WorldPop for population data, and the Global Urban-Rural Mapping Project (GRUMP) for urban/rural classification. These datasets are admittedly incomplete. But they are the best, global datasets available to calculate the RAI for every country using a consistent methodology.
This is a lot of data. WorldPop data is available in a raster format at 30 meter pixel resolution for every country. The team at WorldPop divides the entire world into a grid of cells, each cell is 30 meters on a side, and every cell has a value that is an estimate of the number of humans living there. They use satellite imagery, census data, and a host of other datasets. Learn more about their methodology here.
[adinserter block = “1”]
OpenStreetMap is a collaborative, editable map of the world. In many locations, it is the best available map. People can tag roads with attributes like surface type and road category.
GRUMP provides several datasets that provide information on humanity’s global urban footprint. We used the Urban Extent Polygons.
We used Azavea’s open source geospatial processing library, GeoTrellis, to combine these datasets and generate the RAI statistic for each country. The code for the tool and the methodology is open source and is available here: https://github.com/geotrellis/geotrellis-road-distance-sdg/releases
Trial countries
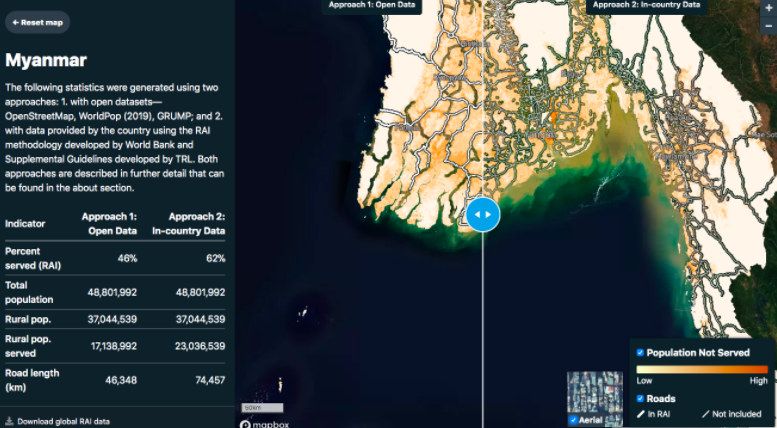
For three trial countries in the ReCAP 2019 project (Nepal, Malawi, and Myanmar), country-specific datasets have been used that are regarded as more accurate than the current open datasets. These country-specific datasets have been used to generate scores that better reflect the RAI for those countries. In addition to country-specific datasets, a separate, supplementary methodology developed by TRL was used. Their supplementary methodology provides an approach to estimate the “all-season” nature of a road by generating an “accessibility factor” that can be applied to regions. More information about this methodology will be released in a report in the coming months. For these three countries, the results of the two approaches can be compared.
What’s next
It is our hope that this tool can serve as a catalyst to conversations around SDG calculations that can lead to improved measurements. We believe that by providing a benchmark value for an SDG indicator using open data as a starting point, we can find better datasets to replace the open datasets.
We’d like to validate this assumption that a benchmark SDG measurement is a valuable contribution.
We’d like to continue the conversation with the UN Global Platform to understand how we can support their mission to support National Statistic Offices in calculating SDGs.
We’d love any feedback or suggestions on what you’d like to see, so feel free to reach out.