This post is part of a series of articles written by 2018 Summer of Maps Fellows. Azavea’s Summer of Maps Fellowship Program is run by the Data Analytics team and provides impactful Geospatial Data Analysis Services Grants for nonprofits and mentoring expertise to fellows. To see more blog posts about Summer of Maps, click here.
In 2015, there were 118 million households in the United States. In that year, 25 million households reported that they had at some point given up food or medicine in order to pay their utility bills. 17 million households received a utility shut-off notice. Nearly 13 million households left their houses so cold it would damage their health because they couldn’t afford their heating bills. Overall, 37 million of America’s 118 million households reported some type of energy or utility insecurity.

Utility insecurity, also called energy insecurity, is defined as “an inability to adequately meet household energy needs.” Usually, this means financial inability due to high bills, but it could also refer to physical problems such as broken boilers, busted pipes, or poor insulation.
Comparing food insecurity and utility insecurity
The Legal Clinic of for the Disabled is a Philadelphia-based non-profit that offers free legal services to those living in or near poverty who have a disability. As part of Azavea’s Summer of Maps program, I worked with the Legal Clinic this summer to study the connections between the Legal Clinic’s clients and individuals undergoing food and utility insecurity. The Legal Clinic sought to understand both the spatial and the social correlations between the people they serve and those two phenomenon. But studying food insecurity and studying utility insecurity are very different.
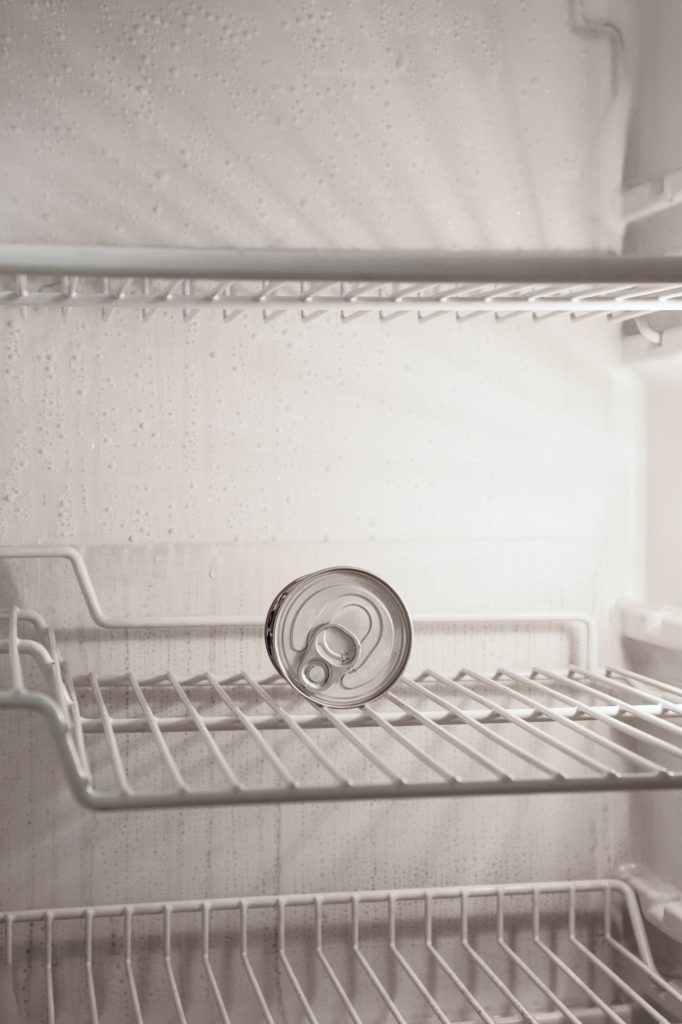
Food insecurity is a very well-studied topic. As of this writing, a simple search for academic papers on “food insecurity” returns nearly 150,000 results, covering a vast range of contexts and scales. A similar search for “energy insecurity” returns fewer than 6000 papers – and “utility insecurity” just 19 papers, only a few of which are actually relevant. It is a measure of how little the topic has been studied in America that when the Energy Committee of the United States Senate wrote a report on household utility insecurity in 2014, they used a definition pulled from a British Act of Parliament. Since then, the situation has improved a little – but not much.
An emerging field
According to Dr. Diana Hernandez of Columbia University, one of the nation’s leading experts on utility insecurity, both the term “utility insecurity” and the field of study are only just beginning to exist. “Energy is something that we are all reliant on, and yet we haven’t had a lot of attention to this issue,” she says. Why?
Partially, she says, because it is only recently that several related phenomena, such water shut-offs and inadequate heating, have come to be grouped together under the heading of utility insecurity. In addition, utility insecurity has often been “overlooked” compared to food insecurity, although the work done on that topic has helped pave the way for studying other types of household insecurities.
There is a third reason why utility insecurity hasn’t been well-studied so far. The data just isn’t there. As one of my professors has told me a thousand times, “good science depends on good data.” Dr. Hernandez’ several excellent recent papers on the topic relied on the painstaking work of carefully coded personal interviews, on the scale of dozens of individuals. She has not been able to use any large-scale datasets covering whole cities because, she told me, those datasets just do not exist in a public format.
Almost every household in America, especially in urban and suburban areas, is connected to the water network and the electricity grid. Most are connected to a gas network for heating. Water service is almost always provided by a publicly owned branch of government – in Philadelphia, the Philadelphia Water Department. Electric services are often private or semi-public – in Philadelphia, PECO is owned by Exelon Corporation. Natural gas suppliers vary widely by region. There is no single system applicable from city to city across the United States. Across the country, governments and corporations alike have massive amounts of data on the utility situation of nearly every single household – how much their bills are, if they are in debt, how much energy they use, and when they use it. But this data is almost never easily available.
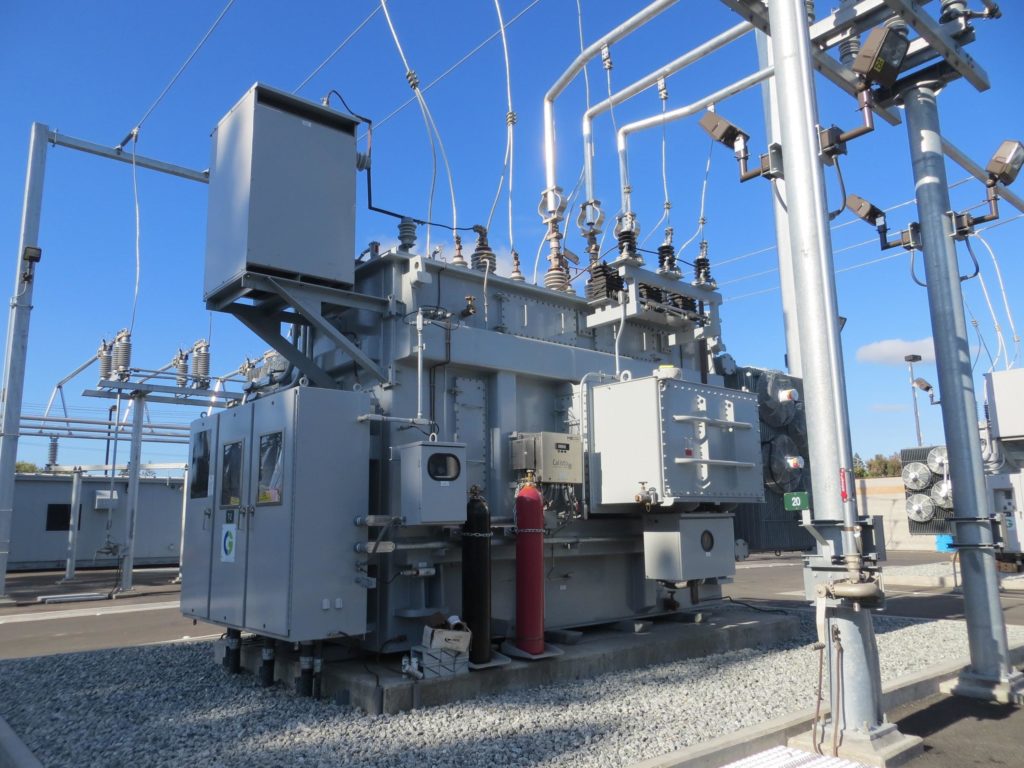
Private companies are naturally reluctant to give up data that’s relevant to utility insecurity. It wouldn’t be good for business to loudly report that the bills they send out are putting families into financial hardship. But even in the cases of public, government-run utilities like the Philadelphia Water Department, hard data is tough to come by. Frequently, only top-line summaries are available, with actual data kept hidden away. For the Philadelphia area, the best that can be said is that in 2016, 85,937 households had their electricity cut off by PECO. As for water shut-offs? Probably around 36,000 per year. Geospatial data? Almost impossible to come by.
Geospatial analysis of utility insecurity
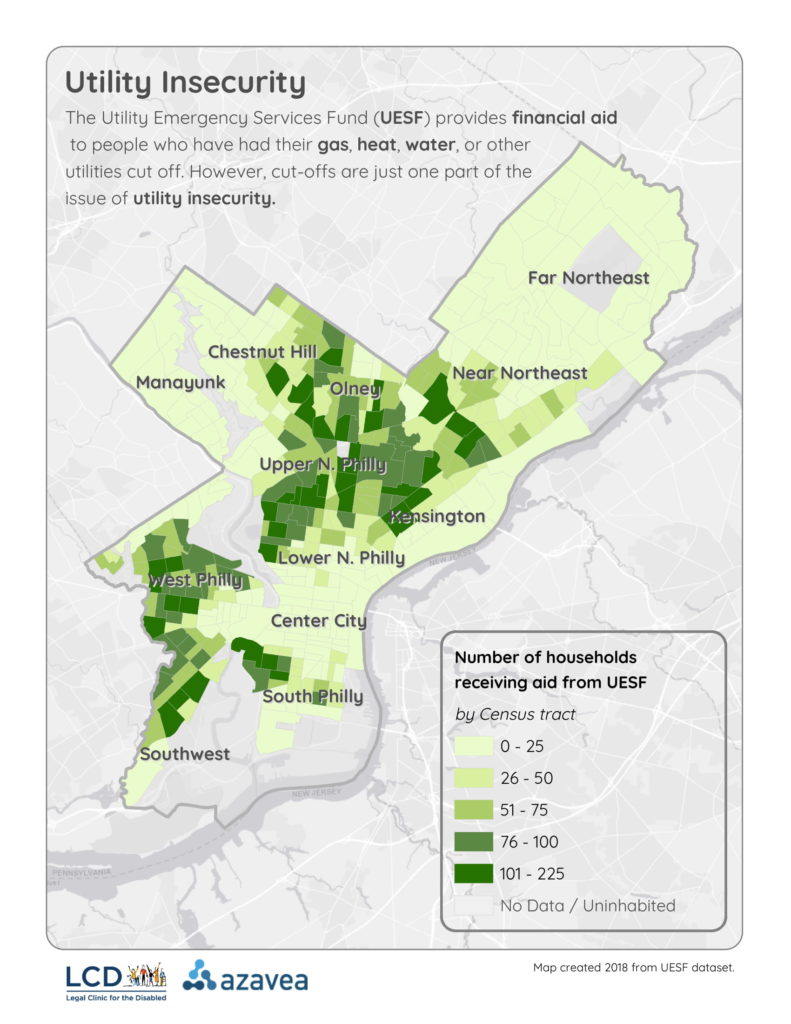
So what data did I use to study utility insecurity for the Legal Clinic for the Disabled? Non-governmental, non-corporate data. The Utility Emergency Services Fund, or UESF, is a non-profit based in Philadelphia designed to help fight utility insecurity. Founded in 1983, it has helped deal with this issue longer than the issue has been named. My work was based on a 16,000 point dataset of households helped by UESF’s Utility Grant program, which provides financial aid to people behind on their utility bills, with the goal of ending shutoffs and reconnecting service.
The data, stripped of identifying personal information, provided an invaluable insight into the patterns of utility insecurity in Philadelphia. But it cannot tell the full story – certainly not everyone who is utility insecure would be enrolled in UESF’s programs. The dataset is a group of self-selected households who are both in debt to their utilities and are able to find, apply, and successfully receive a UESF grant. Not only that, but it can be difficult to obtain aid. Their list of requirements includes not having received aid from them in the past 2 years, being under 175% of the federal poverty line, and having applied for federal LIHEAP aid prior to applying to UESF.
My analysis, however, did turn up some interesting results. Most relevantly to my partners at the Legal Clinic for the Disabled, there is a high correlation between the Legal Client’s clinics and those receiving aid from UESF. Not only that, while UESF aid is concentrated in the known areas of neighborhood-wide poverty in Philadelphia (North Philly, West Philly), poor households all over the city have received help from UESF – utility insecurity is a city-wide issue.
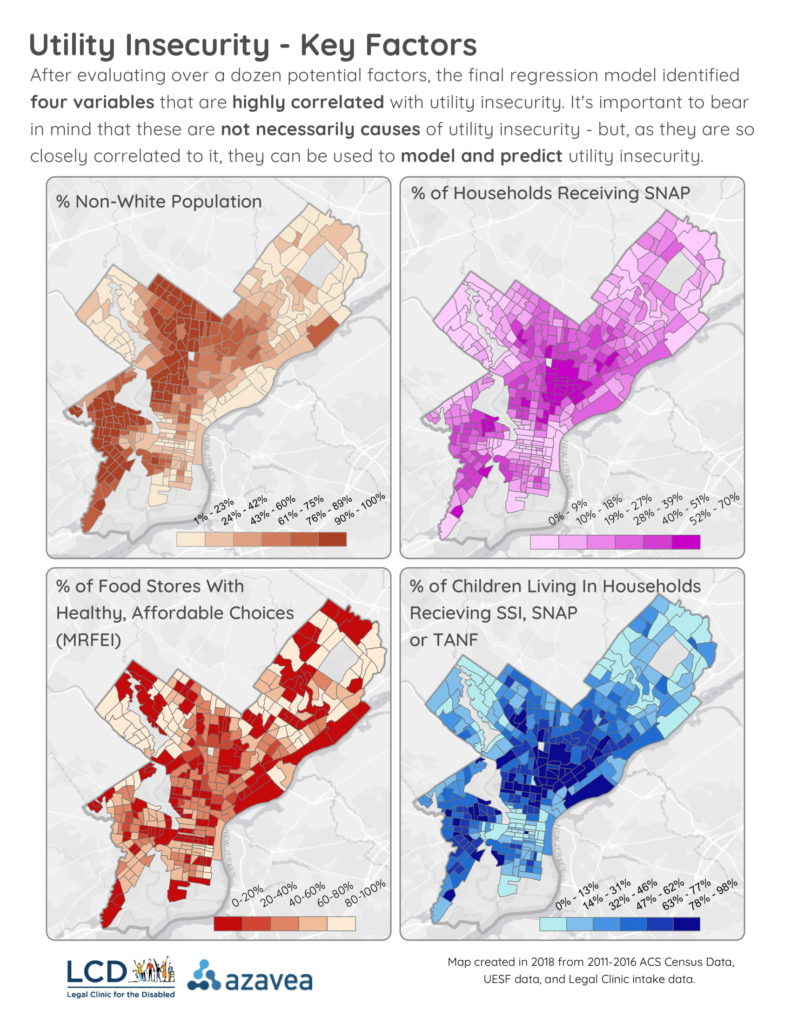
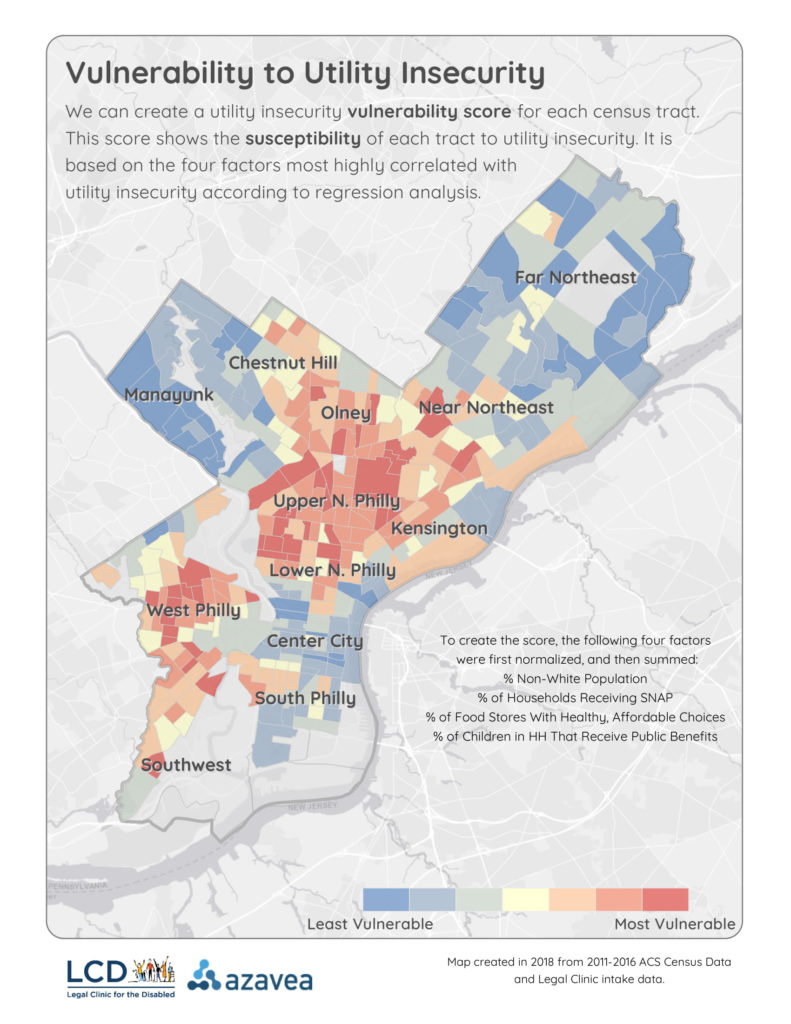
I used a regression model to try and identify factors that were strongly correlated with UESF-aided households. The model returned four variables, seen in the map below:
These are correlations, not causations, but they do suggest that, as the Legal Clinic for the Disabled had guessed, utility insecurity is closely linked to other social factors, such as food insecurity, poverty, and race. Using these factors, I was able to create a vulnerability score for utility insecurity by census tracts, normalizing and combining these social factors.
Useful links for asking questions and getting answers about utility insecurity
So how can geospatial analysts continue to advance the study of utility insecurity? First of all, by starting simple. As Dr. Hernandez of Columbia describes, most topics of study for science go through two stages. In the first stage, which she called the 1.0 period, researchers define the field, define the issue, and set out broad questions that they think the field should answer. In the 2.0 phase, researchers set out to answer those broad questions more and more specifically, getting down to the details. Utility insecurity, Dr. Hernandez says, is still in the 1.0 period – being defined and delineated as an area of serious study.
It was certainly true that my analysis of UESF data raised more questions for me than answers. Utility insecurity is something that reaches into nearly every single neighborhood in America; into more than 30% of households. It deserves our attention, both as geospatial analysts and as a society.
The information I compiled as part of this project is just a start to investigate the complexities of utility insecurity. Here is a list of resources that may be helpful to understanding this issue and working toward solutions:
Scientific Papers and Data
Understanding Energy Insecurity and Why It Matters to Health
Keeping the Heat On For Children’s Health: Preventing Utility Shutoffs
The Impact of LIHEAP Participation on Household Energy Insecurity
Fuel poverty and human health: A review of recent evidence
Household Energy Insecurity Data Table, 2015 – US Energy Information Administration, RECS
Government and Other Reports
Energy Insecurity Among Families With Children – National Center for Children in Poverty
Plenty at Stake: Indicators of American Energy Insecurity – Energy Committee, US Senate
When the Water Is Shut Off: Comparative Practices – Circle of Blue
Pennsylvania Public Utility Commission 2014 Report – Terminations, Etc
News Articles
Utility terminations skyrocket in Pennsylvania, but why? – Pennlive
Among the Powerless – Energy Insecurity – CityLab
Where America’s Poor Pay the Most for Electricity – CityLab
I found that these sources helped me begin to understand this too-common phenomenon – and, with any luck, in a few years, there will be many more to link, and many fewer cases of utility insecurity.

