A Tool to Highlight Underfunded and Under-resourced Communities: A Peek Behind the Technical Curtain of Headwaters Economics’ Rural Capacity Index
By Jillian Long and Adeel Hassan on March 30th, 2022
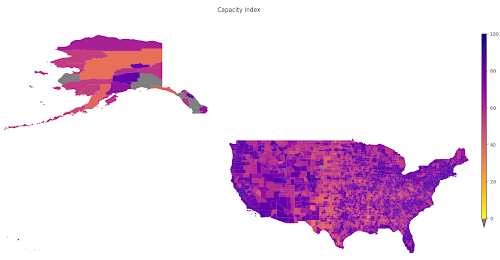
To address the disparity in access to funding resources, we partnered with Headwaters Economics to develop the Rural Capacity Index.