
This blog post is a guide to setting up a geoprocessing web application using GeoTrellis, Akka HTTP, and React.
It’s the result of a research project done as part of Azavea’s 10% research time. The aim of the project was to learn about GeoTrellis in order to build a geoprocessing service; ultimately the research enabled us to rewrite the Model My Watershed geoprocessing service to replace the intial Spark Job Server-based implementation with one using Akka HTTP.
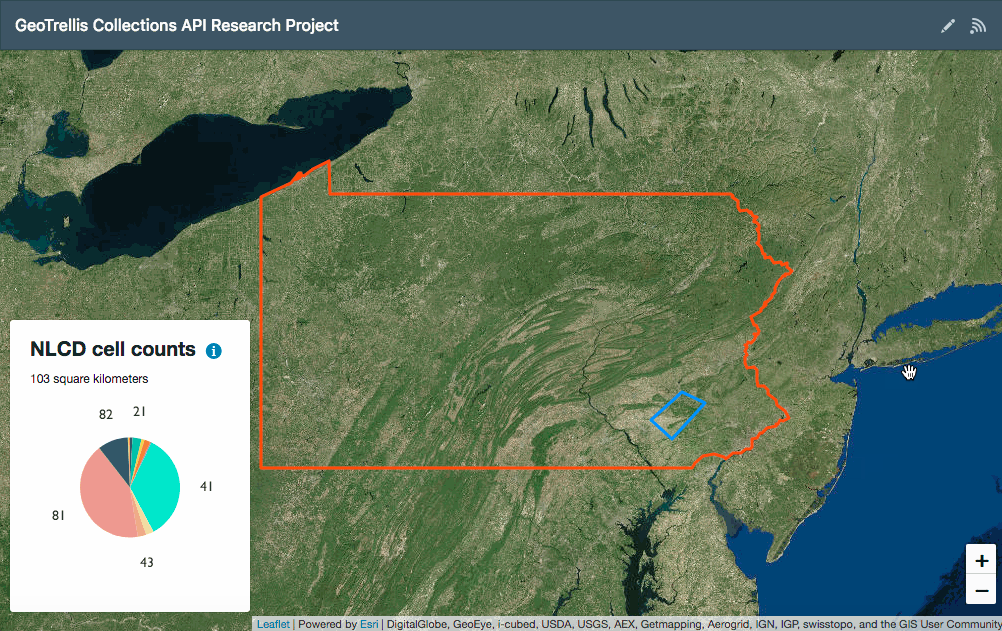
In what follows, I’ll walk through setting up a development environment for a web application which allows users to draw an area of interest within Pennsylvania on a map then retrieve and display NLCD land use type cell counts from a GeoTrellis layer ingested from GeoTIFF data set.
In the end you’ll be able to set up a running development environment so you can try out using GeoTrellis.
Setting up the project
You can find the full project in its GitHub repository here:
https://github.com/azavea/geotrellis-collections-api-research
To set everything up you’ll need to be using macOS or Linux and you’ll also need to make sure you’ve got some dependencies installed first. You can see a list of requirements here. Succinctly, the app requires the following dependencies:
To check whether you’ve got everything installed, run the following command from your shell:
$ which make curl docker java sbt spark-submit
and verify that you see a directory path listed for each:
/usr/bin/make
/usr/bin/curl
/usr/local/bin/docker
/usr/bin/java
/usr/local/bin/sbt
/usr/local/bin/spark-submit
You’ll also need to ensure Docker’s currently running and that spark-submit is available on your path.
Once you’ve verified that everything’s installed and running, clone the project repository, cd into its directory, and run the following command to build everything:
$ make
This will kick off a series of build steps orchestrated by separate make rules: it will build a containerized React app client, download a GeoTIFF data set, and process the GeoTIFF into a GeoTrellis layer.
(Warning: the whole process may take a little while.)
Once built, you can start the project’s servers by running
$ make server
That command will start the GeoTrellis API server on port 7000 and the React app on port 9555. Once it’s running, you can visit localhost:9555 in a browser to load the client:
To help get oriented, let’s walk through the build steps and some of the code.
Ingesting a GeoTIFF into a GeoTrellis layer
GeoTrellis can read GeoTIFFs directly, but to make use of its faster raster data types, one needs to transform a GeoTIFF into a TileLayerRDD via a process typically called an “ingest”.
Part of the make rule above will run make ingest which will in turn:
- download a GeoTIFF using cURL
- create an executable ingest jar file to run via
spark-submit - run the ingest and write the layer catalog to
ingest/land-cover-data
The actual code to perform the ingest is in a LandCoverIngest object:
object LandCoverIngest {
  val localGeoTiffPath =
    new java.io.File(new java.io.File(".").getCanonicalFile,
      "land-cover-data/geotiff/nlcd_pa.tif").getAbsolutePath

  val localCatalogPath =
    new java.io.File(new java.io.File(".").getCanonicalFile,
      "land-cover-data/catalog").getAbsolutePath

  def main(args: Array[String]): Unit = {
    val conf = new SparkConf()
      .setIfMissing("spark.master", "local[*]")
      .setAppName("Ingest PA Land Cover GeoTiff")
      .set("spark.serializer", classOf[KryoSerializer].getName)
      .set("spark.kryo.registrator", classOf[KryoRegistrator].getName)

    implicit val sc = new SparkContext(conf)
    try {
      val geoTiffRDD =
        HadoopGeoTiffRDD.spatial(new Path(localGeoTiffPath))

      val (_, metadata) =
        geoTiffRDD.collectMetadata[SpatialKey](FloatingLayoutScheme(256))

      val paLandCoverLayer =
        ContextRDD(
          geoTiffRDD
            .tileToLayout(metadata, NearestNeighbor)
            .mapValues { tile => tile.convert(ByteConstantNoDataCellType) },
          metadata.copy(cellType = ByteConstantNoDataCellType))

      val paLandCoverLayerID = LayerId("nlcd-pennsylvania", 0)

      FileLayerWriter(localCatalogPath)
        .write(paLandCoverLayerID, paLandCoverLayer, ZCurveKeyIndexMethod)
    } finally {
        sc.stop()
    }
  }
}
Here the LandCoverIngest code takes the input GeoTIFF path and the output catalog path, uses Spark to generate an RDD, then writes that back out as a GeoTrellis layer with an id of nlcd-pennsylvania which includes some metadata describing things like its projection, its tile extent and layout, and its cell data type.
In ingest/land-cover-data/catalog/attributes/nlcd-pennsylvania__.__0__.__metadata.json you’ll see a manifest file which starts with the following lines:
[
    {
        "name": "nlcd-pennsylvania",
        "zoom": 0
    },
    {
        "header": {
            "format": "file",
            "keyClass": "geotrellis.spark.SpatialKey",
            "valueClass": "geotrellis.raster.Tile",
            "path": "nlcd-pennsylvania/0"
        },
        "metadata": {
            "extent": {
                "xmin": 1261380,
                "ymin": 1962000,
                "xmax": 1782480,
                "ymax": 2295150
            },
            "layoutDefinition": {
                "extent": {
                    "xmin": 1261380,
                    "ymin": 1957230,
                    "xmax": 1783620,
                    "ymax": 2295150
                },
                "tileLayout": {
                    "layoutCols": 68,
                    "layoutRows": 44,
                    "tileCols": 256,
                    "tileRows": 256
                }
            },
            "bounds": {
                "minKey": {
                    "col": 0,
                    "row": 0
                },
                "maxKey": {
                    "col": 67,
                    "row": 43
                }
            },
            "cellType": "int8",
            "crs": "+proj=longlat +datum=WGS84 +no_defs "
        },
Running an ingest locally — and writing a layer catalog back to the local file system — is a somewhat artificial exercise. GeoTrellis has been designed to make use of distributed computing clusters, which is in part why it uses Spark and Spark’s RDD or “Resilient Distributed Dataset”.
This means that for larger ingest jobs one can perform the ingest using an Amazon AWS EMR cluster to accomplish ingests of national- and international-scale datasets and to create layers with multiple zoom levels, as in cases where one wanted to generate layers of visual tiles.
Likewise, GeoTrellis can also write layers to S3 and read layers from S3, using its appropriately-named S3LayerReader and S3LayerWriter classes.
To simplify things, I’ve used a small data set, performed the ingest locally, and stored the layer locally. In the next step, I’ll walk through setting up the service to query that layer using a GeoTrellis FileCollectionLayerReader and Akka HTTP.
Creating a GeoTrellis service with Akka HTTP
The project uses the land cover raster as the data source for its GeoTrellis & Akka HTTP API. The most relevant pieces of the API code live here, including
- an Akka HTTP server
- some utilities for handling HTTP request and layer reading I/O
- the core geoprocessing operation: returning a list of NLCD cell counts from an area of interest polygon
The server code leans on Akka HTTP and spray-json to accept POST requests and return results. It begins by declaring some case classes to match the input and output JSON:
case class GeoJsonData(geometry: String)
case class ResponseData(response: Map[String, Int])

object RequestResponseProtocol extends DefaultJsonProtocol {
  implicit val requestFormat = jsonFormat1(GeoJsonData)
  implicit val responseFormat = jsonFormat1(ResponseData)
}
Next it declares two routes with CORS support (necessary to enable querying the API from the browser), including a /ping route for health checks and a /panlcdcount route which accepts a polygon area of interest and returns a response mapping NLCD cell type values to their counts within that area of interest:
post {
  path("panlcdcount") {
    entity(as[GeoJsonData]) { shape =>
      complete {
        Future {
          getPANLCDCount(shape)
        }
      }
    }
  }
}
The getPANLCDCount function call is wrapped in a Future to avoid blocking; that function creates a shape which GeoTrellis can parse from the area of interest, retrieves the tiles from the raster layer which intersect the area of interest, and then calculates and formats results via the rddCellCount operation:
def getPANLCDCount(aoi: GeoJsonData): ResponseData = {
  val areaOfInterest = createAOIFromInput(aoi.geometry)
  val rasterLayer = fetchLocalCroppedPANLCDLayer(areaOfInterest)
  ResponseData(rddCellCount(rasterLayer, areaOfInterest))
}
rddCellCount is probably the most interesting bit of the code:
private def rddCellCount(
  rasterLayer: TileLayerCollection[SpatialKey],
  areaOfInterest: MultiPolygon
): Map[String, Int] = {
  val init = () => new LongAdder
  val update = (_: LongAdder).increment()

  val metadata = rasterLayer.metadata
  val pixelCounts: TrieMap[Int, LongAdder] = TrieMap.empty

  rasterLayer.foreach({ case (key: SpatialKey, tile: Tile) =>
    val extent = metadata.mapTransform(key)
    val re = RasterExtent(extent, metadata.layout.tileCols,
      metadata.layout.tileRows)

    Rasterizer.foreachCellByMultiPolygon(areaOfInterest, re) { case (col, row) =>
      val pixelValue: Int = tile.get(col, row).toInt
      val acc = pixelCounts.getOrElseUpdate(pixelValue, init())
      update(acc)
    }
  })

  pixelCounts
    .map { case (k, v) => k.toString -> v.sum.toInt }
    .toMap
}
This operation takes in a tile layer collection and an area of interest, sets up a TrieMap of LongAdder instances to use as a multi-threaded accumulator, then loops over each cell of each tile intersecting the area of interest to determine whether the cell itself intersects the shape and what is the cell value: an integer representing an NLCD land use type. Using TrieMap and LongAdder enables the service to process tiles from multiple raster layers in parallel.
The concurrent accumulator’s a bit superfluous here since this project only queries a single layer. For more sophisticated geoprocessing services, however, using TrieMap and LongAdder enables developers to use Scala’s Parallel Collections by calling .par on the collection of layers. In Model My Watershed’s geoprocessing service we use parallel collections, for example, to retrieve cell counts for land use type and soil type layers simultaneously. In addition to cell count operations, Model My Watershed geoprocessing service has several others, including operations to find the average raster cell value and the maximum and minimum cell values, most of which are designed to work with multiple raster layers.
With the API server running, a client can now make a request like this:
curl --request POST \
  --url http://localhost:7000/panlcdcount \
  --header 'content-type: application/json' \
  --data '{"geometry":"{\"type\":\"Polygon\",\"coordinates\":[[[-75.915527,40.010787],[-75.695801,40.430224],[-75.322266,40.329796],[-75.487061,39.926588],[-75.915527,40.010787]]]}"}'
and receive a response which looks like this (when prettified):
{
    "response": {
        "23": 42796,
        "11": 16202,
        "33": 9054,
        "22": 14163,
        "21": 139348,
        "43": 110900,
        "32": 4059,
        "82": 94575,
        "42": 59245,
        "81": 644752,
        "92": 5078,
        "41": 770469,
        "91": 2563,
        "85": 6853
    }
}
In the response, each key represents a land cover type according to the NLCD Land Cover Class Definitions; each value represents a count of cells for that land cover type within the area of interest. You can see the GeoTIFF’s original metadata here.
Building a frontend client with React and Leaflet
As a frontend client, I created a React app using patterns I described in “Getting Started with React and Leaflet” in a slightly more sophisticated way. The client uses React, Redux, and Leaflet built via Webpack along with Leaflet.draw to enable users to create areas of interest, axios to make API requests to the geoprocessing service, and Victory to display the results in a pie chart.
You can see the client application source here; some points of interest incude:
- setting up Leaflet.draw to send data for a drawn shape to the API
- making and resolving the API request via axios and Redux
- displaying API response data with Victory
Leaflet.draw’s set up in a way similar to the pattern I described in the React/Leaflet tutorial. In this case, I added a Leaflet.draw handler and set up the map to listen for drawstart and drawcreated events on the Leaflet map, triggering drawstart on clicking the pencil icon in the app header and dispatching a submitAreaOfInterest function call to Redux to submit the drawn layer when drawing is finished:
componentDidMount() {
    const {
        map: {
            leafletElement: leafletMap,
        },
        props: {
            dispatch,
        },
    } = this;

    esri.basemapLayer('Imagery').addTo(leafletMap);

    leafletMap.on('draw:drawstart', () => {
        dispatch(clearData());
        dispatch(clearAPIError());
    });

    leafletMap.on('draw:created', this.onCreate);

    this.polygonDrawHandler = new L.Draw.Polygon(leafletMap);
}

componentWillReceiveProps({ drawingActive }) {
    if (drawingActive) {
        this.polygonDrawHandler.enable();
    } else {
        this.polygonDrawHandler.disable();
    }
}

onCreate({ layer }) {
    this.props.dispatch(submitAreaOfInterest(layer.toGeoJSON()));
}
submitAreaOfInterest validates that the drawn shape is within Pennsylvania’s boundaries, formats the shape for the API request, then makes the request via axios while updating the Redux state to indicate that a request has started, failed, or succeeded:
export function submitAreaOfInterest(aoi) {
    cancelPriorRequest();
    return (dispatch, getState) => {
        dispatch(startSubmitAreaOfInterest(aoi));
        const { geometry: paGeom } = pennsylvaniaBoundaries.features[0];
        if (!turfContains(paGeom, aoi)) {
            const errorMessage = 'Drawn shape must be within Pennsylvania';
            return dispatch(failSubmitAreaOfInterest(errorMessage));
        }

        const { appPage: { selectedApiEndpoint } } = getState();
        axios.post(${apiServerURL}${selectedApiEndpoint},
            JSON.stringify({ geometry: JSON.stringify(aoi.geometry) }),
            {
                headers: {
                    'Content-Type': 'application/json',
                },
                cancelToken: new CancelToken((c) => { cancelAxiosRequest = c; }),
            })
             .then(({ data }) => dispatch(completeSubmitAreaOfInterest(data)))
             .catch(() => dispatch(failSubmitAreaOfInterest('API error')));

        return null;
    };
}
Once data has returned successfully, it’s added to the Redux state thence propagates through the app to an NLCDChart component which formats the data for display using Victory.
Here’s the result:
Learning more about GeoTrellis
Now that you’re able to run and navigate the application, you can start developing against it to learn more about GeoTrellis, React, and Leaflet. For instance, you could
- ingest a different GeoTIFF as your source raster layer
- rewrite the geoprocessing API to perform average, max, or other map algebra operations
- update the geoprocessing API to process multiple raster layers in parallel
- render visual tiles
- adjust the server to return results in alternate formats
- display the results in a different kind of chart
If you’d like to learn more about using GeoTrellis in web applications, check out these resources:
GeoTrellis landsat tutorial project
This tutorial walks through using GeoTrellis to process a landsat image into NDVI tiles and serve them as PNG tiles for display on a Leaflet map.
Serving Tiles with GeoTrellis, Lambda, and API Gateway
Another artifact of Azavea’s 10% research time, this blog post assesses the viability of using AWS Lambda to create a serverless tile server with GeoTrellis.
How to Run GeoPySpark in a GeoNotebook with Docker
To make GeoTrellis more accessible to developers who don’t know Scala, GeoTrellis recently added Python bindings called GeoPySpark. This blog post demonstrates how GIS developers can quickly set up an interactive GeoTrellis envirionment using Docker and a Jupyter notebook.
How to Build Asynchronous Workflows in a Geospatial Application
This blog post explains how to use Celery to orchestrate complex (and potentially long-running) geoprocessing operations within a web application’s request-response cycle.