
First time using GeoPySpark
The purpose of this blog is to walk you through the easiest possible path to enable the use of GeoPySpark interactively in a Jupyter notebook. GeoPySpark is a Python library designed to support the processing of large geospatial data.
The target audience for this blog is someone who has some knowledge of both Python and GIS. Although to really take advantage of GeoPySpark you will need a deep knowledge of at least one of them, if not both.
I will still walk you through the concepts with the assumption that they are all new to you.
The technologies and concepts that I will discuss, to varying depth:
- Docker
- Jupyter notebook
- GeoNoteBook
- GeoTrellis
- GeoPySpark
- Weighted Raster Overlay
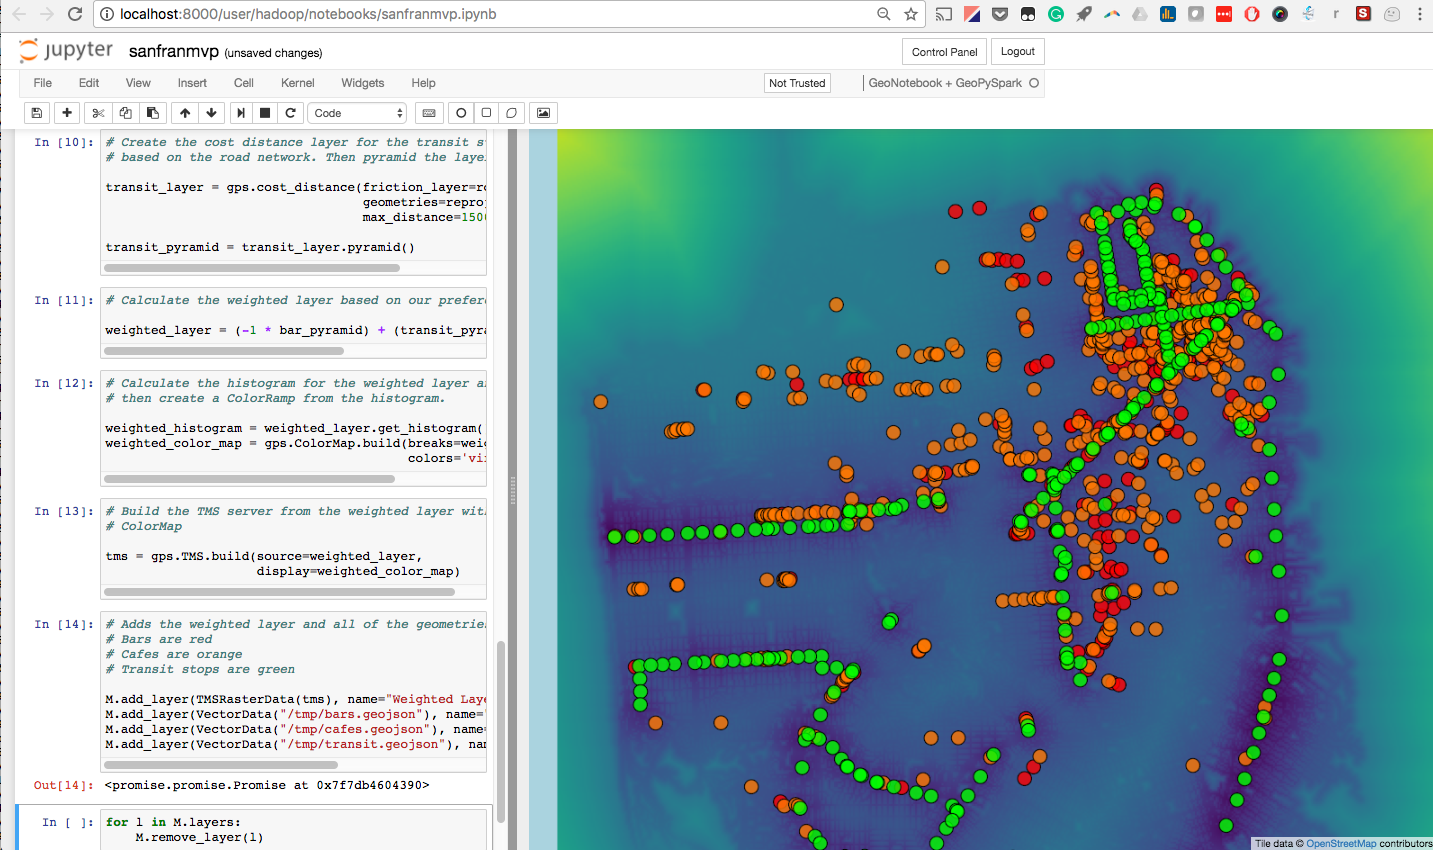
If you complete the tutorial you will be able to produce something that looks like this. You will be able to change the weights, colors, and datasets, interactively:
Getting started:
Docker
If you have not used Docker, there is no shortage of resources and tutorials to explore. I will keep it high level here: Docker is extremely valuable for its ability to create self-contained environments with all the necessary software dependencies, so ideally, an application will just work. The first link points to Docker’s documentation site, and is very thorough. But find a tutorial that suits your style to learn what docker is and how to install it.
Before moving on, confirm Docker is working correctly on your computer by running docker run hello-world in your terminal. You’ll know if its working if you get a Hello from Docker! message returned. You are ready to run your first docker image.
Jupyter
From their official documentation:
Notebook documents are both human-readable documents containing the analysis description [e.g. python code] and the results (figures, tables, [also maps] etc..) as well as executable documents which can be run to perform data analysis.
Notebooks provide an interface for interactive and exploratory analysis. This is a valuable tool for interacting with GeoTrellis via its python binding project: GeoPySpark.
GeoNotebook
From their GitHub:
GeoNotebook is an application that provides client/server environment with interactive visualization and analysis capabilities using Jupyter, GeoJS and other open source tools. Jointly developed by Kitware and NASA Ames.
The GeoTrellis team at Azavea has worked closely with the Kitware team to develop a strategy for working together to enable big data processing in GeoNotebooks. This tutorial relies on GeoNotebooks for visualization.
GeoTrellis
GeoTrellis is an open source, geographic data processing library designed to work with large geospatial raster data sets. It is is written in Scala and has an open-source Apache 2.0 license.

Scala is an imperative and functional programming language and offers many benefits for execution in a distributed processing environment. However. There is a significantly larger community of geospatial Python developers than Scala developers. Which is why we created GeoPySpark
GeoPySpark
GeoPySpark provides access to a portion of GeoTrellis features through Python.
A previous blog covers the technical accomplishments of creating python binding for a Scala project.
This tutorial exposes a minimal amount of GeoPySpark’s functionality. Take a look at the documentation to learn more.
Weighted Raster Overlay
This is a commonly used tool in geospatial analysis. Its purpose is to enable a user to interactively modify the “weight” of different criteria to determine priorities based on geospatial features. In the demo that follows, we will look at three factors (bars, cafes, transit stops) in San Francisco that might influence where you want to buy a home or set up a business. The tool will allow you to prioritize these features based on proximity. The model incorporates roads to provide a more realistic estimation of a proximity based on accessibility in a city where we travel on streets.
Into the notebook
Run this command from your terminal:
docker run -it --rm --name geopyspark -p 8000:8000 quay.io/geodocker/jupyter-geopyspark:blog
It should only take a couple of minutes to download the image.
This command does several things:
- Downloads the image from quay.io, a host for container images. This image contains a build of GeoPySpark + GeoNotebook + the tutorial packaged together.
- It maps the docker container’s 8000 port to your system’s 8000 port. This makes the container available to your host system’s web browser.
-itFlags are commonly used when launching docker containers and are necessary, but their precise meaning is beyond the scope of this blog.--rmoption cleans up the notebook after you exit the process.- Now the notebook is available for use, type
http://localhost:8000into your browser. - You will need to login to the notebook, user:
hadoop| password:hadoop
After logging in you will see one notebook called “sanfranmvp.ipynb.” Open it. You should see this screen:
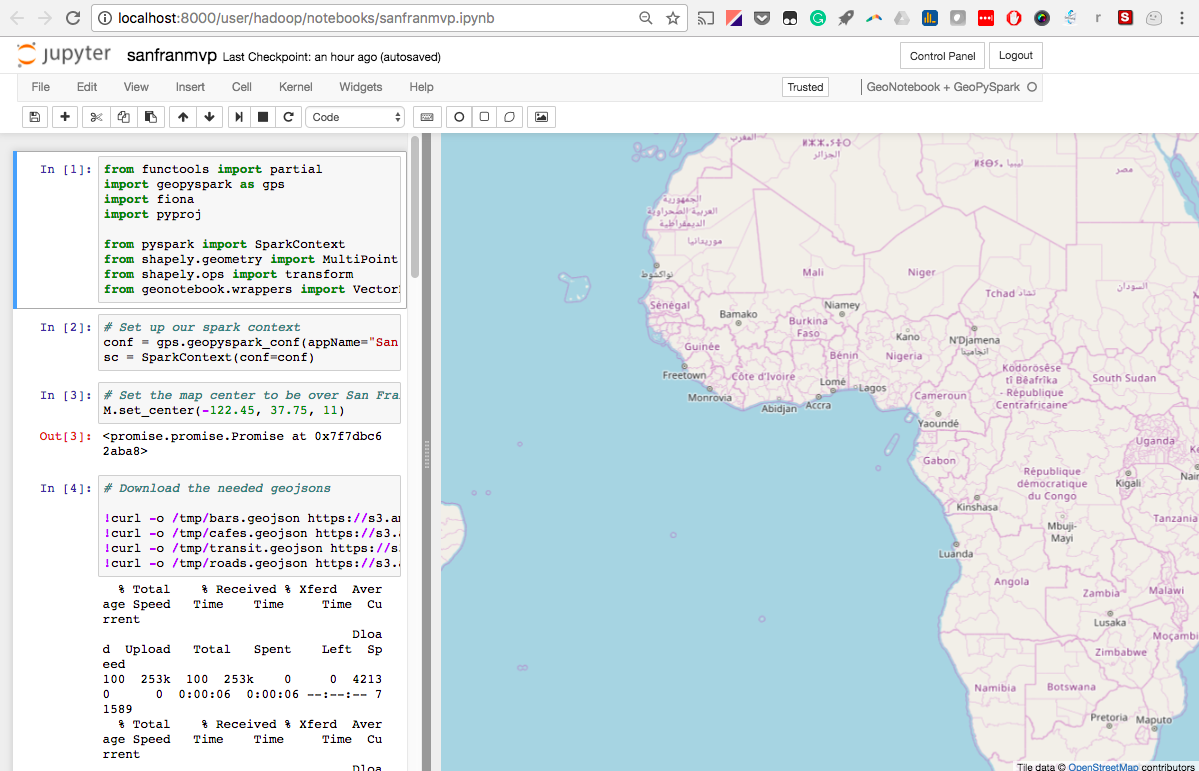
Click on the first cell. It has a number of dependencies. “shift + enter” will execute the cell.
The notebook is meant to walk you through an example workflow to understand the different components of GeoPySpark.
The comments in each of the cells provide a brief explanation of what is happening in each of the cells.
GeoPySpark was designed to enable it to leverage distributed computation on large datasets. But it also supports more interactive development workflows on a single machine with smaller datasets. These workflows can then be scaled up to run on larger datasets. This can be accomplished through the use of an AWS service such as EMR.
I meant to keep this demo as simple as possible to introduce you to the tools necessary to get GeoPySpark running in a GeoNotebook. There are many more possibilities that will be explored in future blog posts.
Reach out to learn more
Comments, questions, feedback, and requests are all welcome. Gitter is the best place to find a GeoTrellis developer. But feel free to write issues on GitHub, or contact me directly.