
This post is part of a series of articles written by the 2020 Summer of Maps Fellows. Azavea’s Summer of Maps Fellowship Program is run by the Data Analytics team and provides impactful Geospatial Data Analysis Services Grants for nonprofits and mentoring expertise to fellows. To see more blog posts about Summer of Maps, click here.
When President Trump ran for office in 2016, he promised to build a continuous wall along the U.S.-Mexico border to prevent immigrants from crossing into the U.S. President Trump originally claimed that Mexico would pay for the wall, yet the project has cost the U.S. $11 billion dollars so far, making it the most expensive border wall in the world at $19.2 million per mile.
So far, 275 total miles of Trump’s border wall has been constructed, with hundreds of more miles of construction planned. Most of the constructed wall segments have simply replaced the barriers from previous administrations, but much of the planned border wall will exist in regions that have never had a barrier before.

When initially planning the border wall’s construction, the Trump administration used the Real ID Act, initially enacted as a result of 9/11, to waive numerous environmental protections such as the Endangered Species Act, the Clean Air Act, and more. Waiving these protections allows the border wall to be built without the proper in-depth environmental impact analysis that otherwise would have been required.
Unique landscapes and species richness line the region along the U.S. border. The thought of building an 18-to-30-foot steel or concrete wall in this area troubles local residents, environmental conservation groups, and more.
Nearly four years after President Trump’s election, Defenders of Wildlife and I used Geographic Information Systems (GIS) to conduct our own environmental impact analysis of the border wall. We used data from numerous sources to better understand the spatial relationships between the existing and proposed border wall, regional at-risk wildlife, and the diverse habitats and landscapes surrounding the border. Using these different variables, we then determined which areas along the border to prioritize for increased conservation efforts.
In this blog, I present some of the key findings of our analysis.
Existing and proposed border wall background
Before the Trump administration’s push for a continuous border wall, some semblance of a wall or fence already existed in more populous areas along the border. In more remote areas or areas along the border where the landscape serves as a natural barrier, no wall or fence was previously thought to be necessary. President Trump’s goal is to build a continuous steel or concrete wall regardless of the presence of natural barriers in many cases.
My impact analysis accounts for all existing walls/fences in addition to the Trump administration border wall segments that have been approved for construction. Because of this, numerous areas along the border have a double-counted border wall, as a barrier may currently exist but is in the process of being replaced by the Trump administration wall.
Using satellite imagery and waivers from sources such as the Department of Homeland, Defenders of Wildlife was able to put an exact location on the map for existing and future border wall segments. I used this data to look at how the border wall individually impacts critical habitats, protected areas, and imperiled species ranges.
The wall’s impact on wildlife
My analysis found that 78 total U.S. federally endangered and threatened species have ranges that are within the construction zones of the existing and proposed border wall. Among these 78 species, 51 are endangered and 27 are threatened.
Additionally, on the Mexico side, my analysis found that 16 IUCN-listed threatened, endangered, or critically endangered species lay within the construction zones of the border wall.
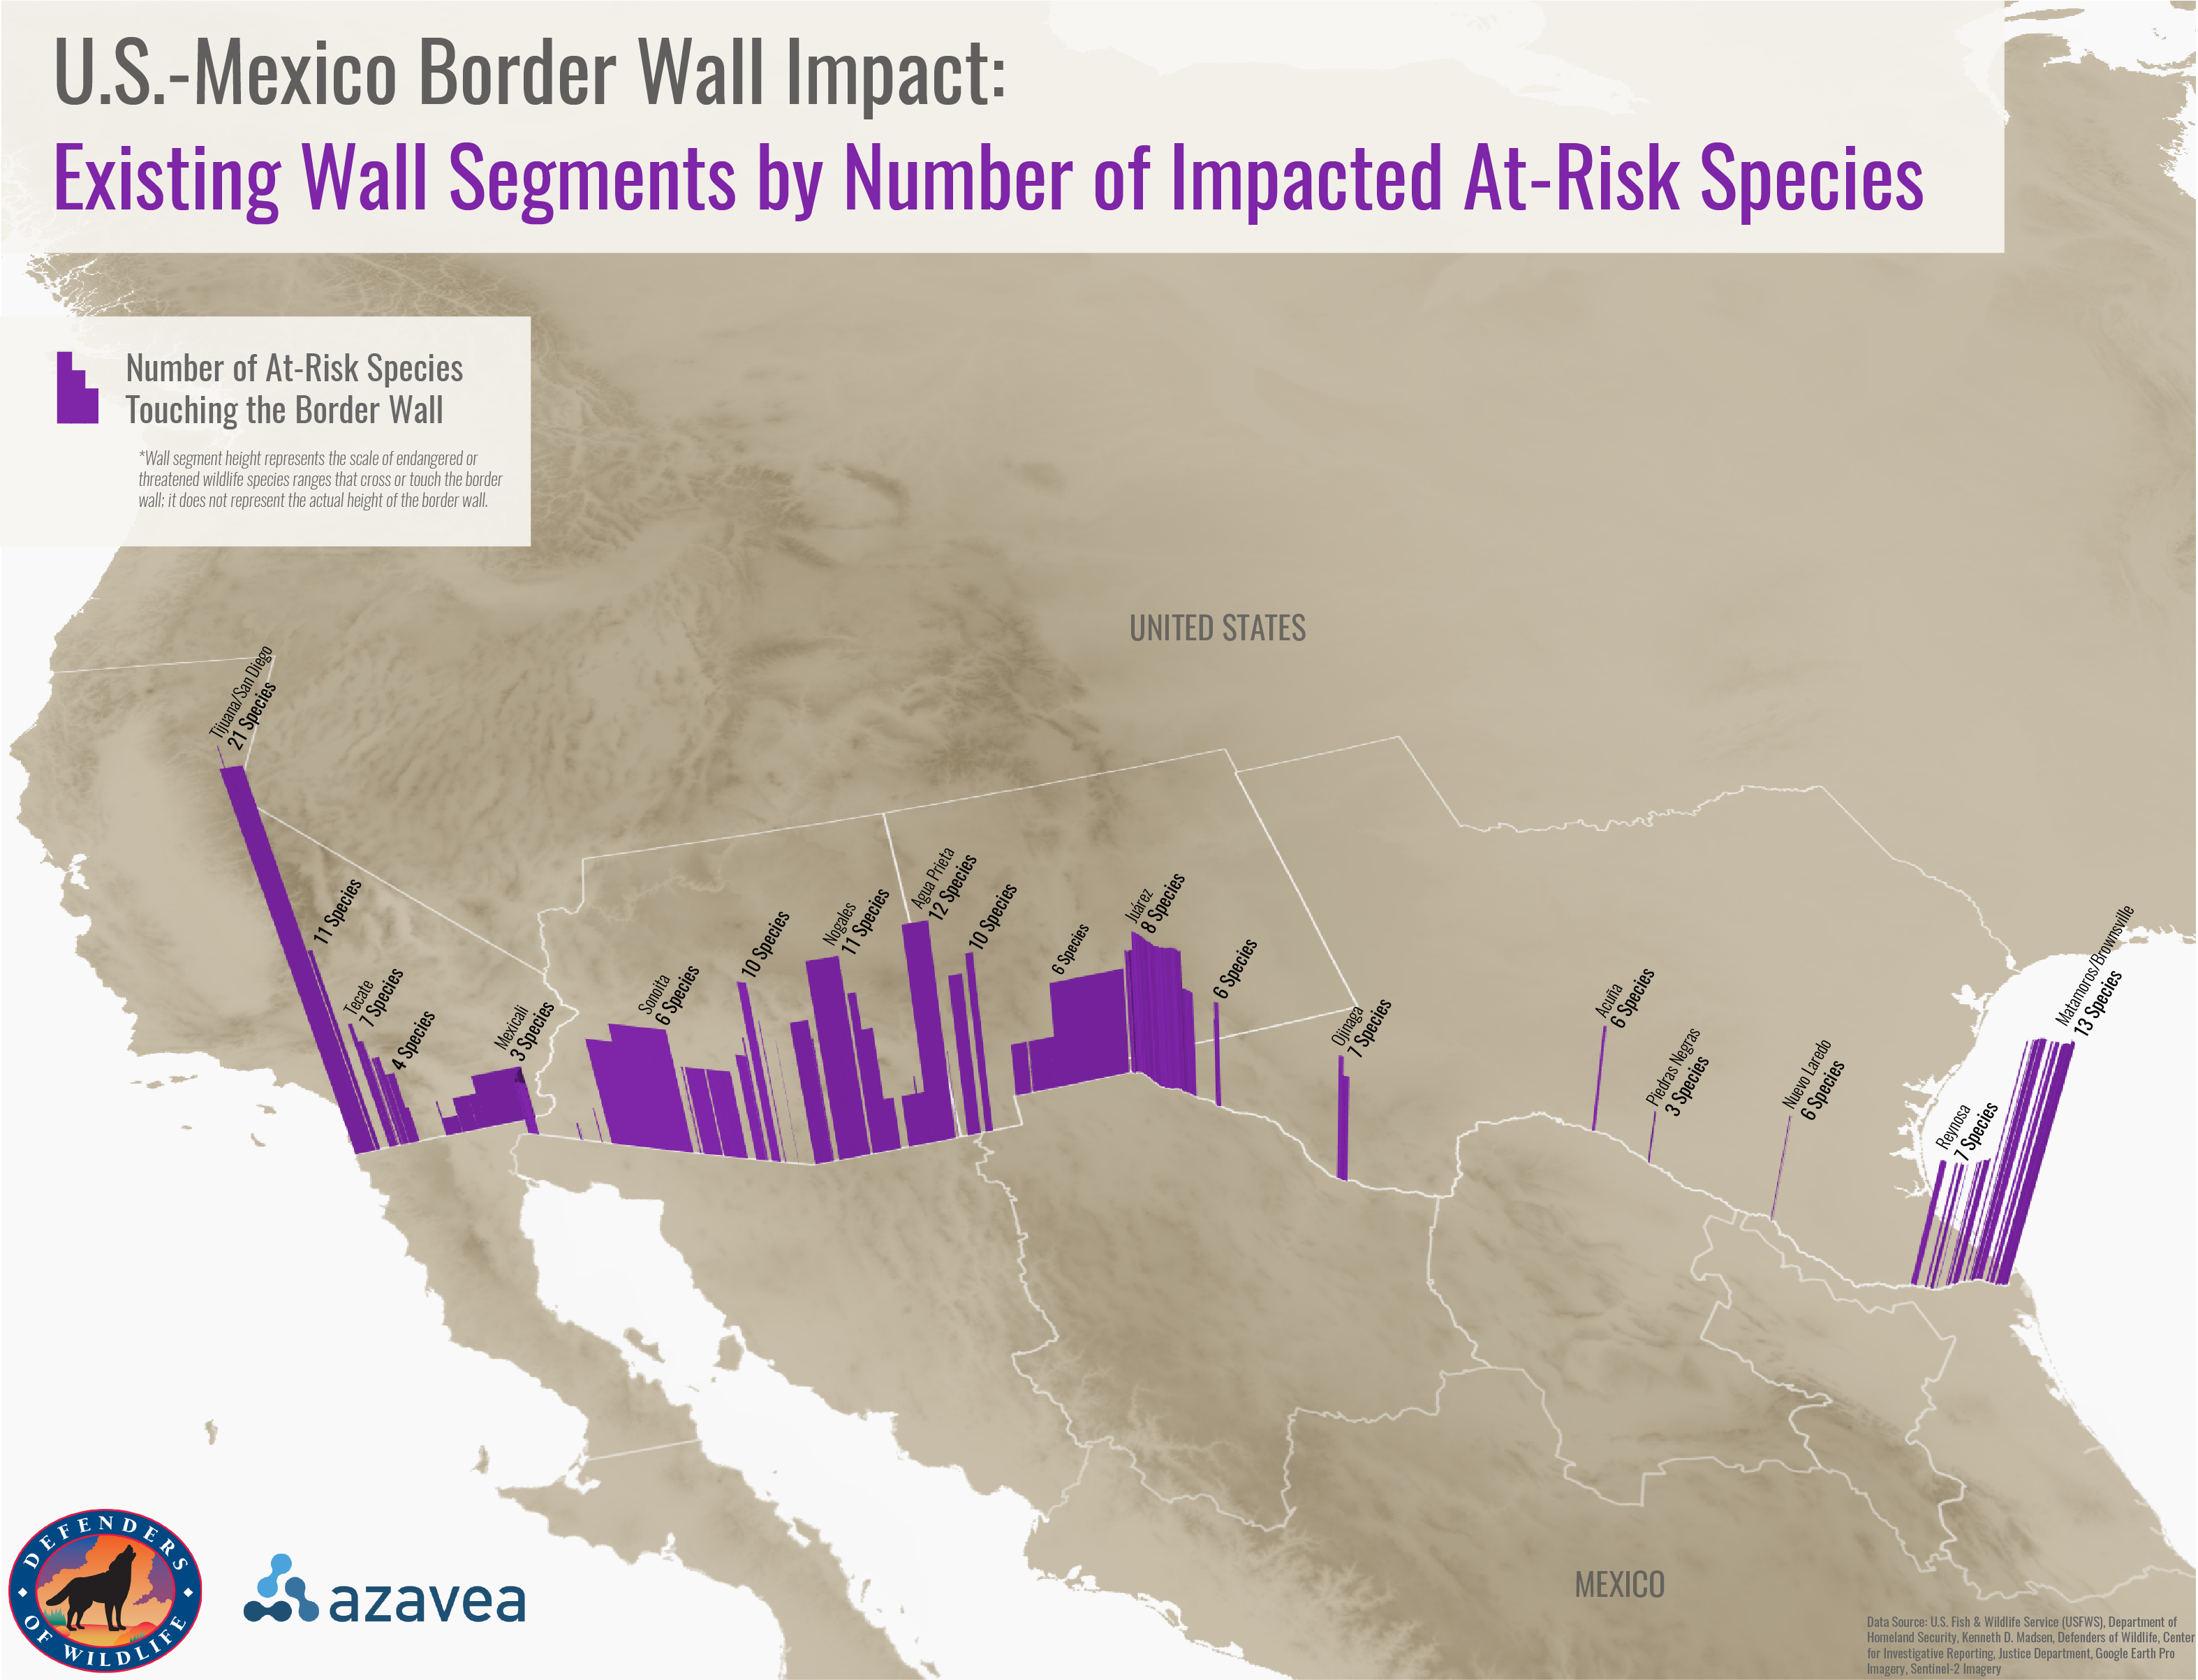
Some existing and proposed wall segments impact more species than others. The 3D map below shows the number of endangered or threatened species ranges within the existing border wall’s construction zones on the U.S. side alone. The border wall between Tijuana, Mexico, and San Diego, California is the most obstructive at 21 total impacted species, but the wall affects numerous other regions as well.
The results look fairly similar for the proposed wall segments, though certain planned wall segments (such as those in southern Texas) will be even more obstructive than the existing wall or barrier nearby.
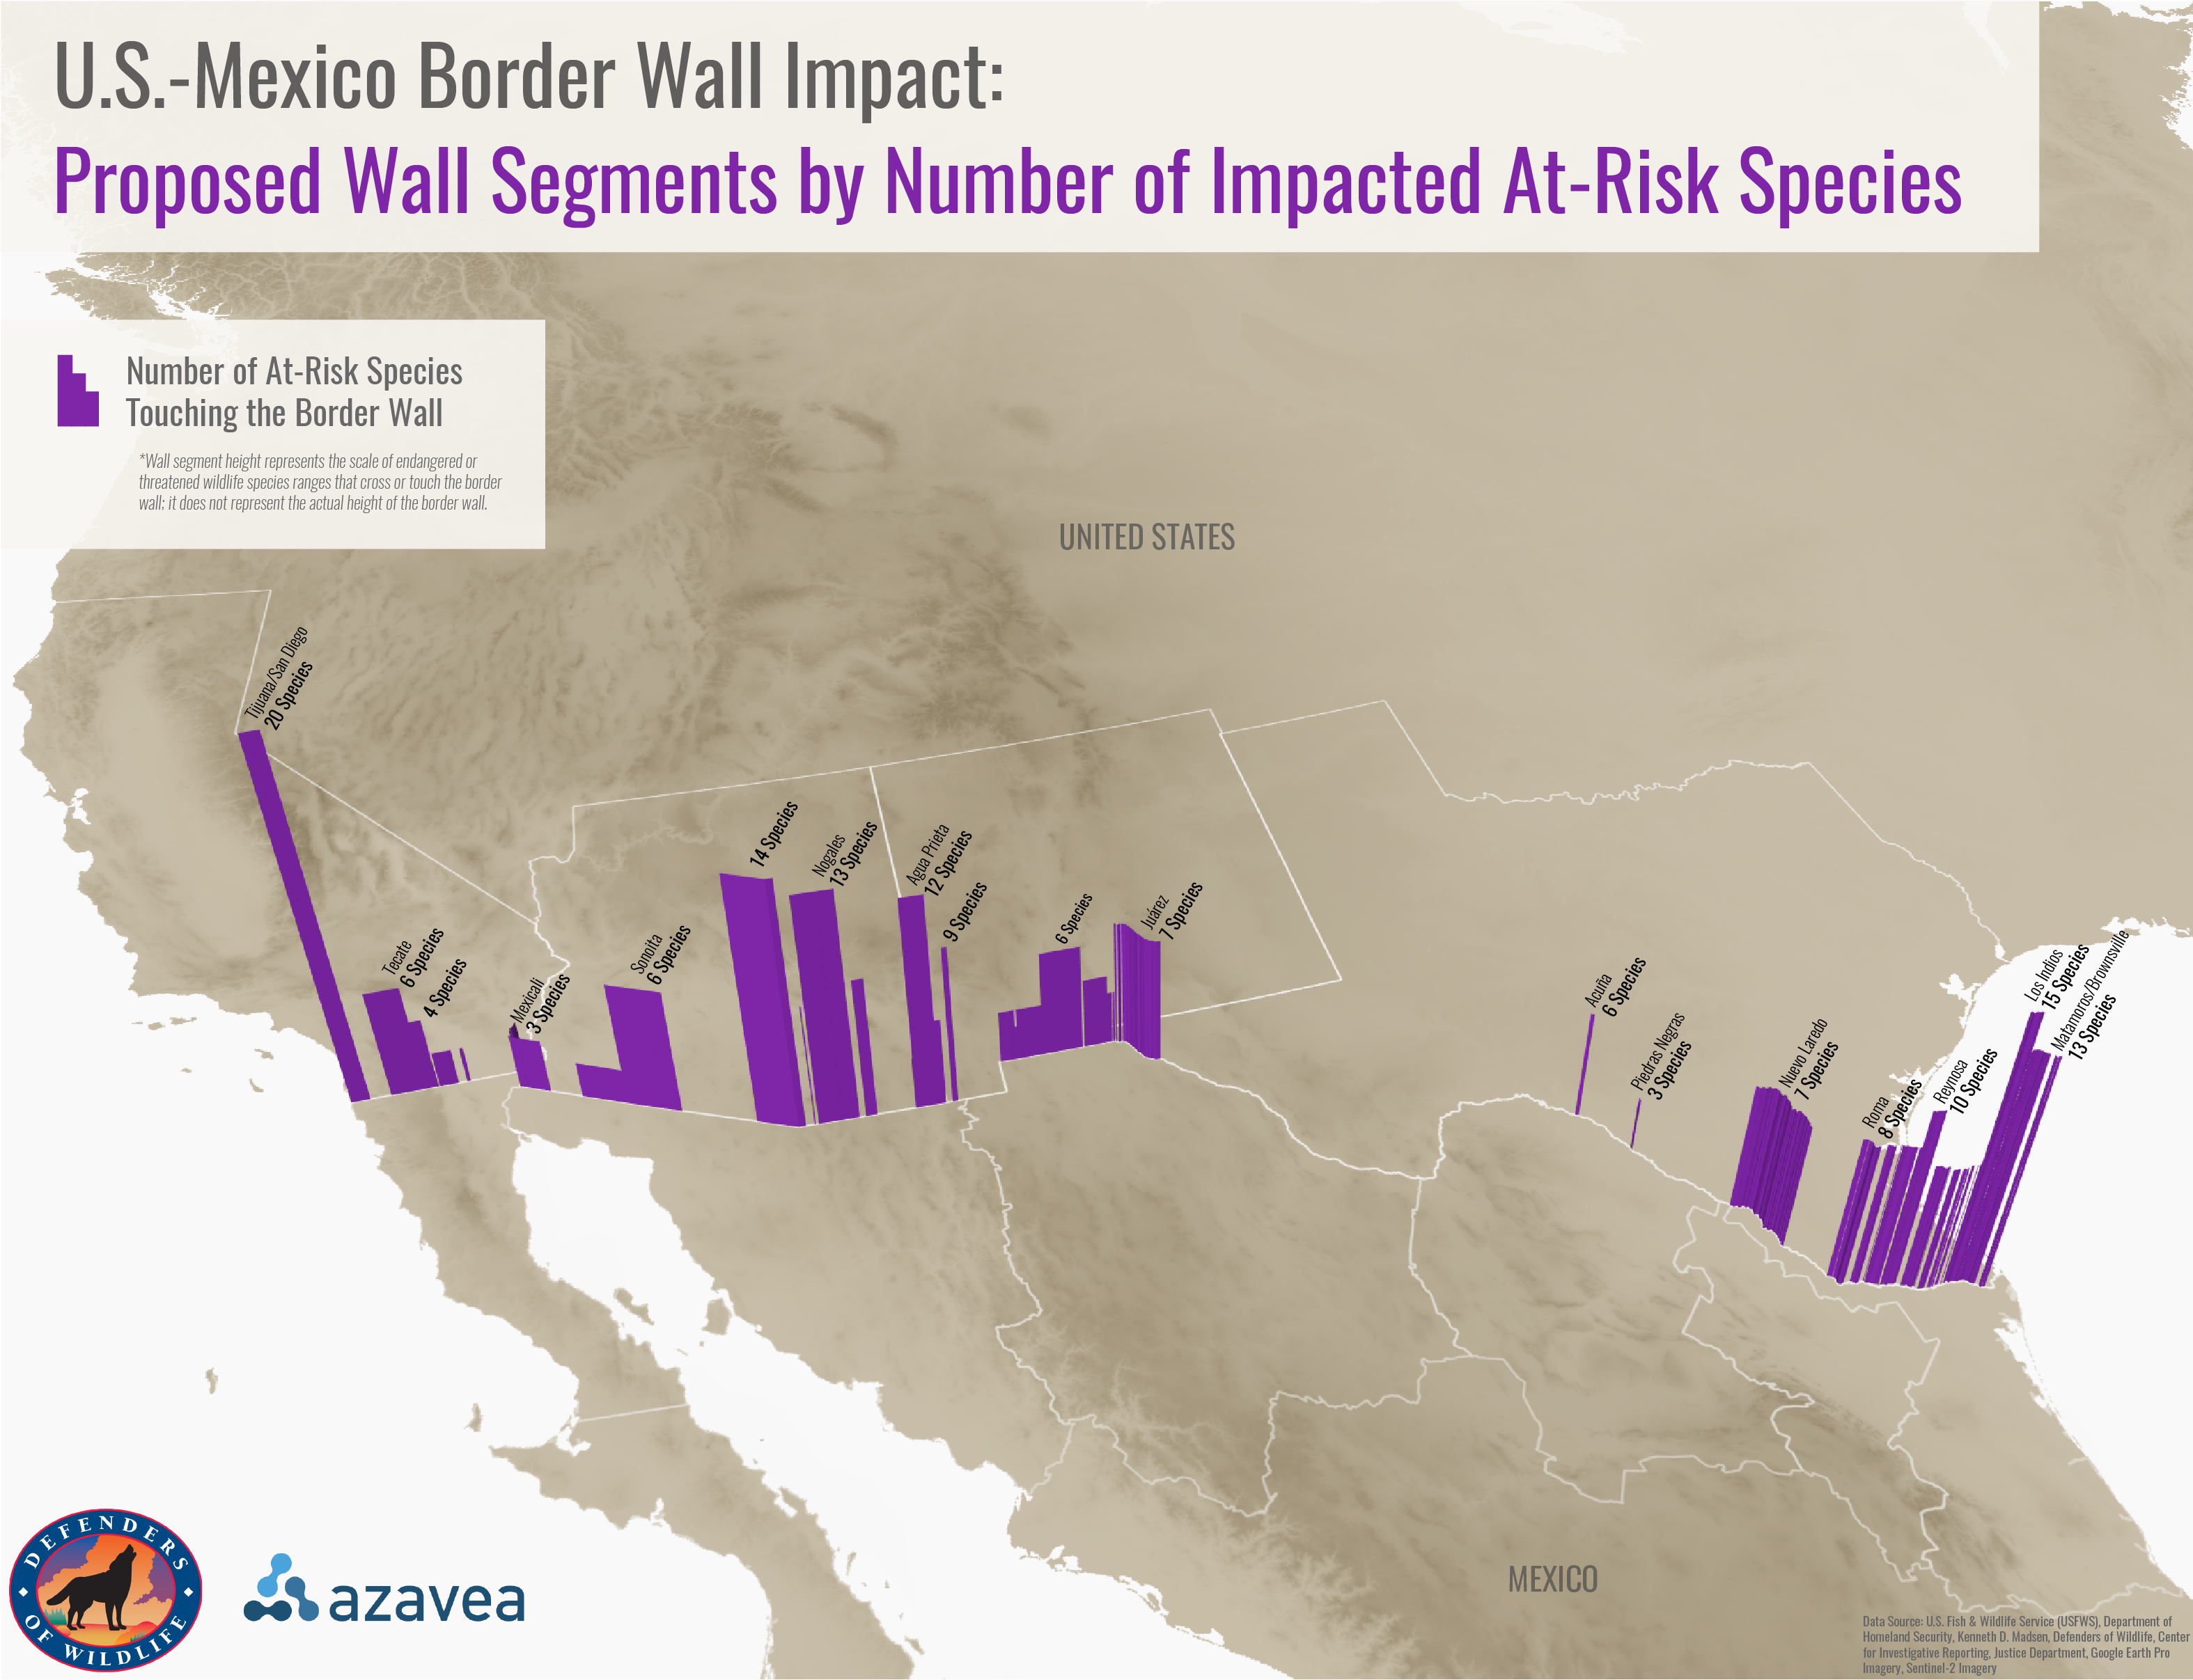
My analysis found that 92.7% of the existing or proposed border wall impacts the ranges of U.S. endangered species, and 97.9% impacts the ranges of threatened species. For species that are already imperiled due to habitat fragmentation or degradation, a border wall will only put more strain on the existing population.
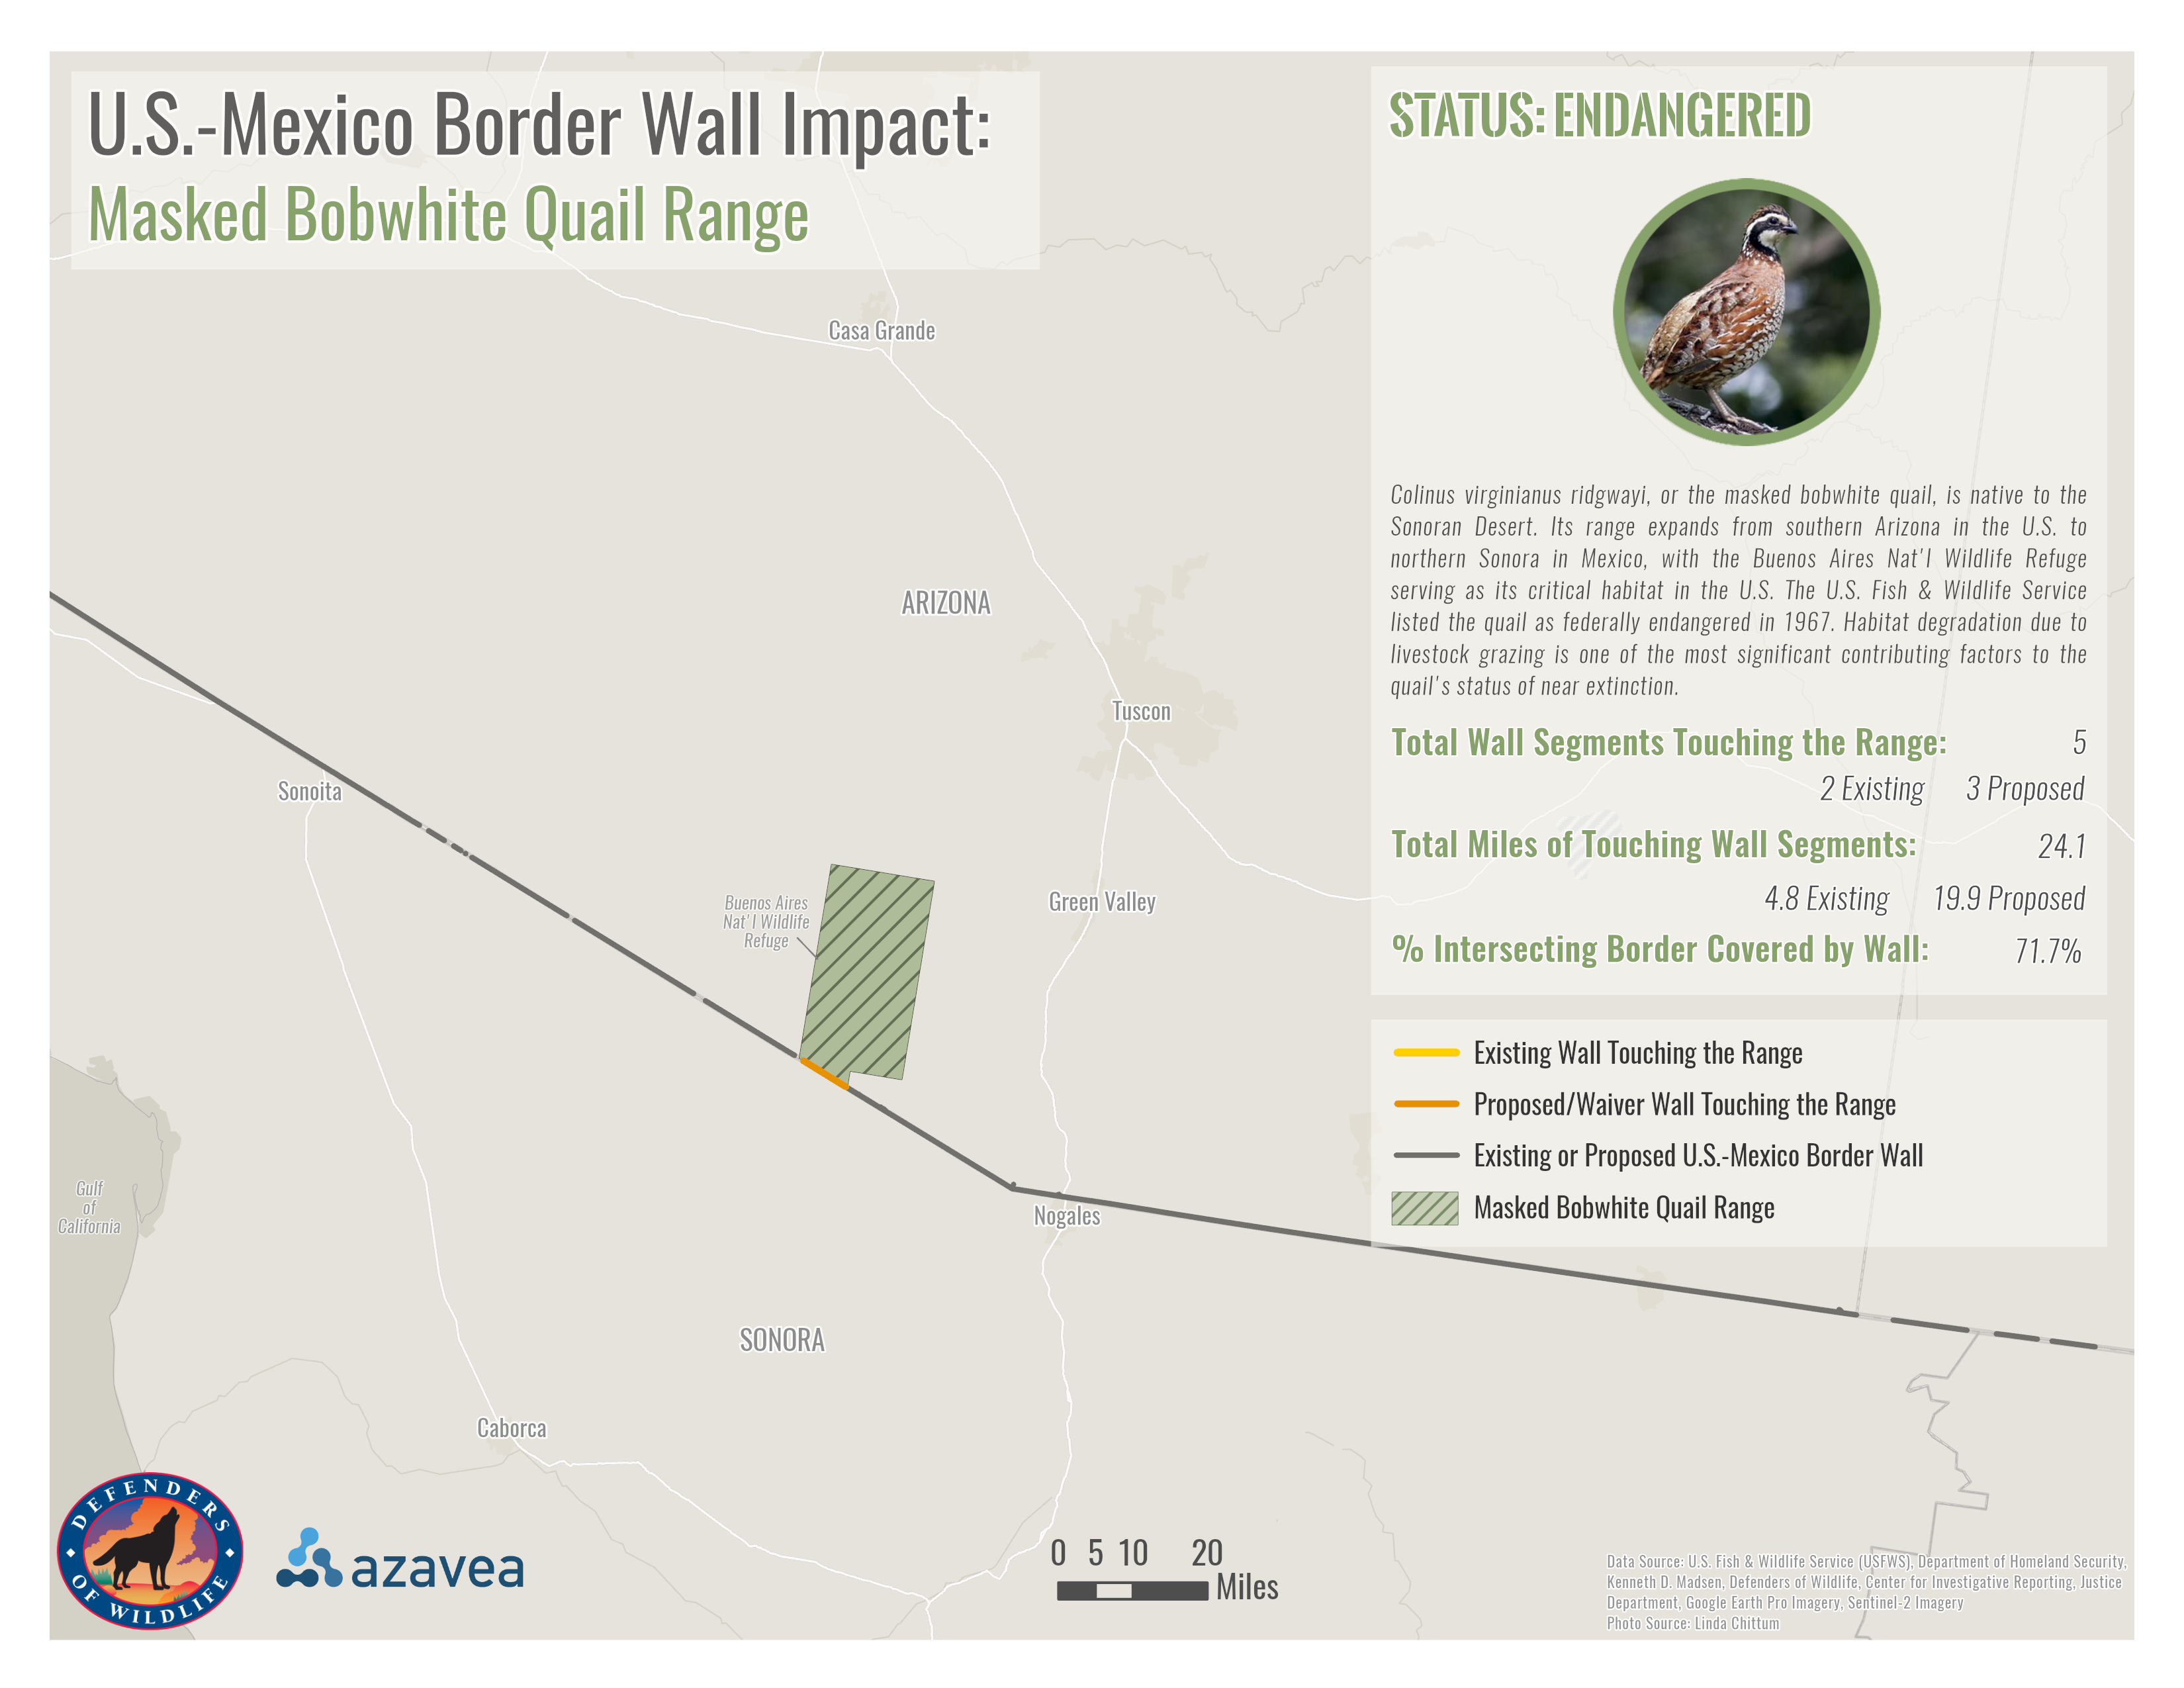
I also highlighted 7 unique endangered or threatened species along the border that will be directly impacted by a wall.
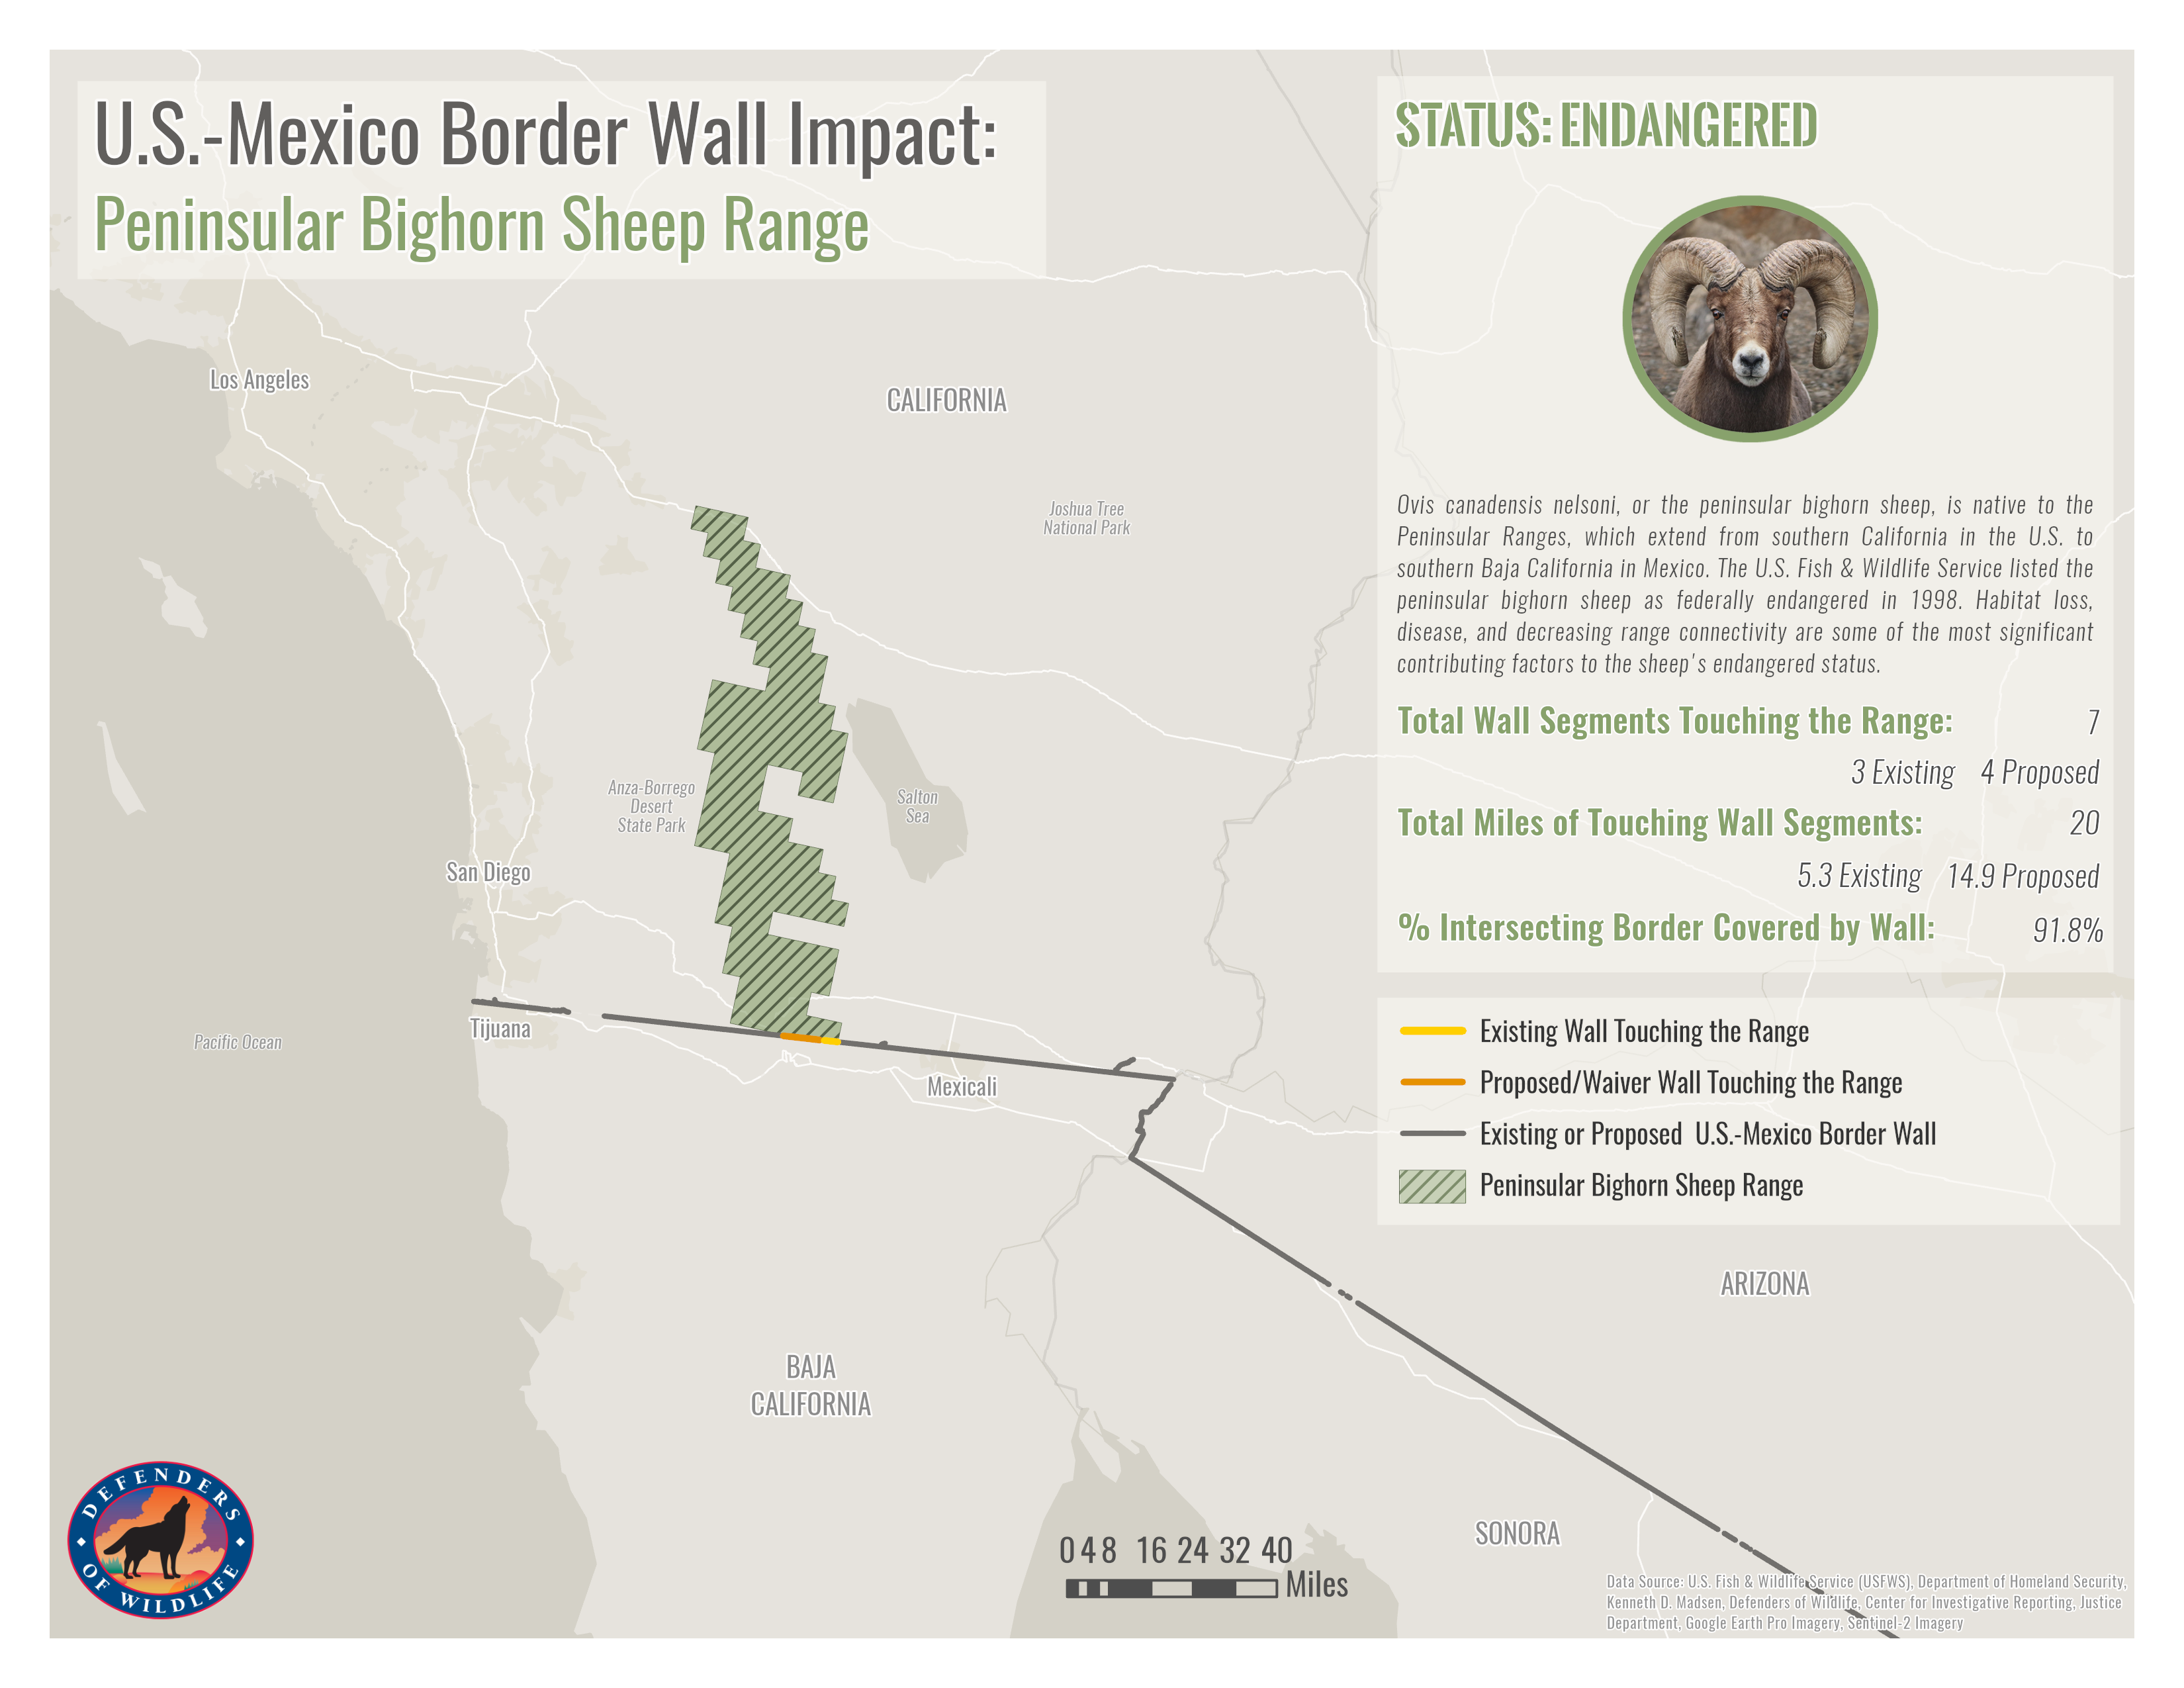
Decreasing the range of grazing sheep
The map below shows the range of the Peninsular Bighorn Sheep, listed as endangered since 1998 partially due to decreasing range connectivity. My analysis found that 91.8% of the sheep’s range touching the border is covered by existing or proposed border wall, which means that the sheep’s already fragmented habitat will be further divided by this 18-to-30-foot wall.
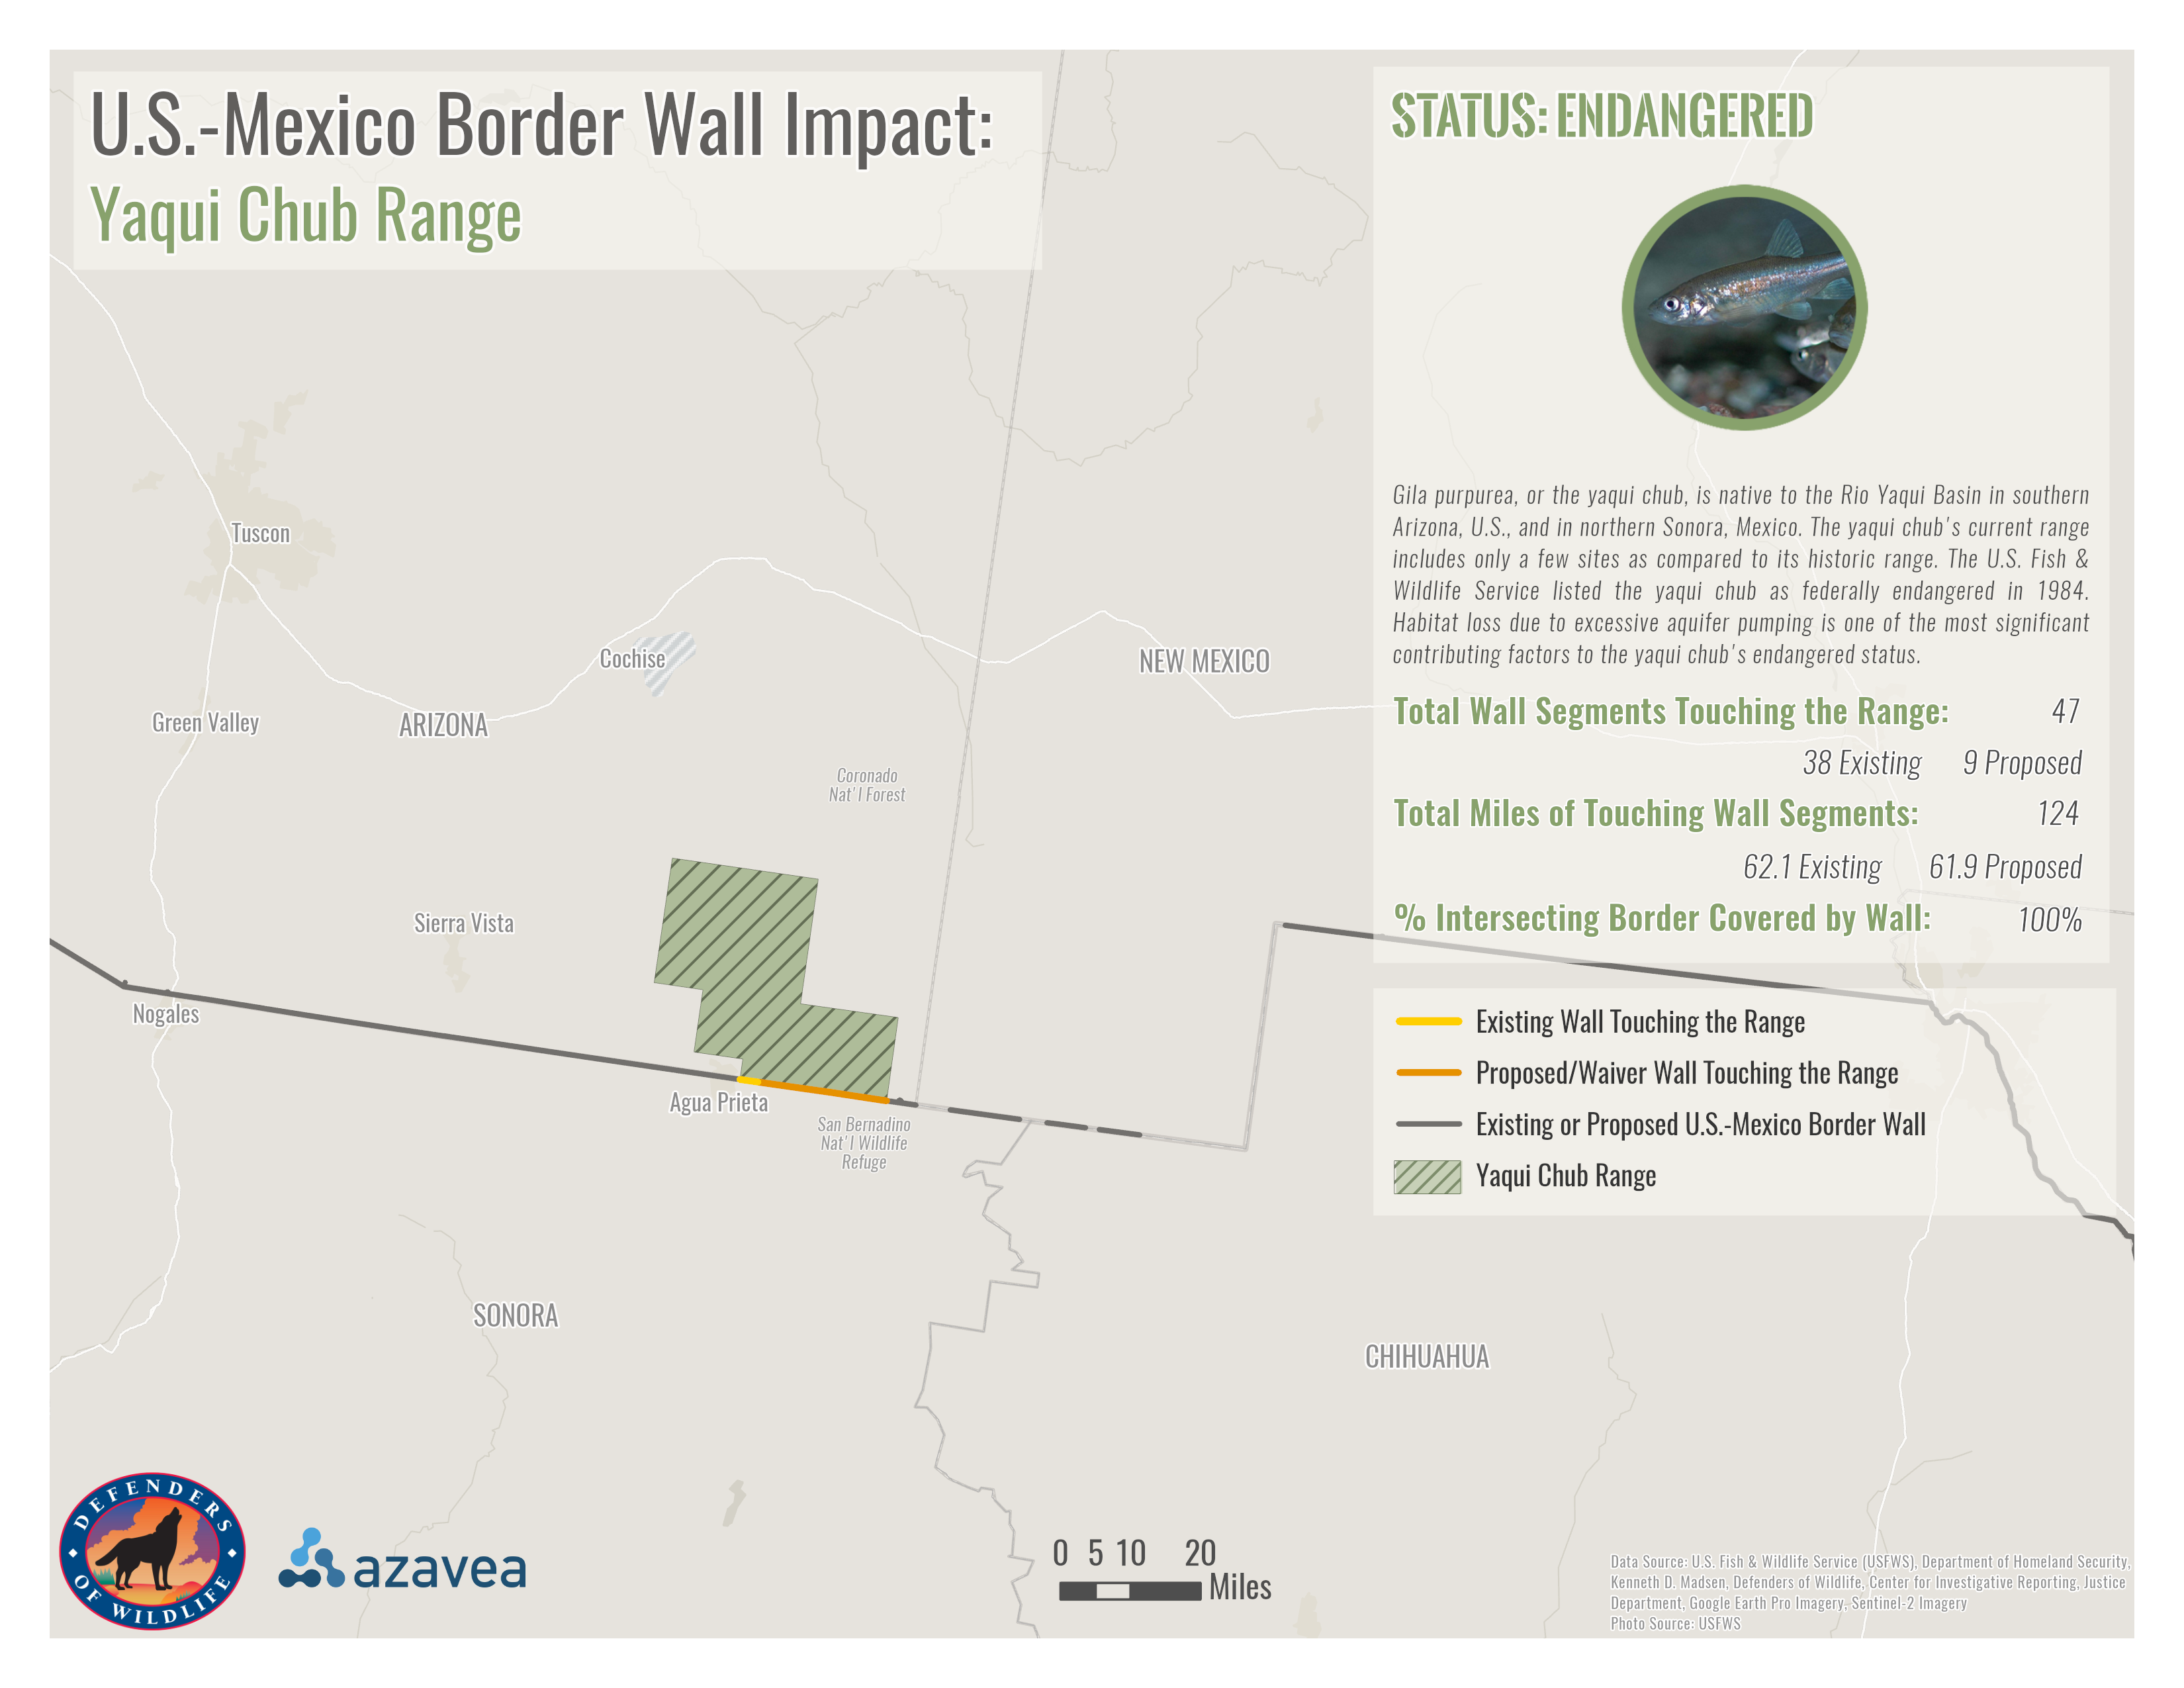
The effects of groundwater depletion on fish
When considering how the border wall will impact wildlife, it’s easy to first picture some of the larger mammals that obviously wouldn’t be able to cross a wall. But what about some of the other types of species, like fish or birds? For fish such as the Yaqui chub, the border wall’s construction is especially obstructive. Much of President Trump’s wall is supposed to be concrete, which requires concrete mixing at the construction site. To mix the concrete, contractors extract millions of gallons of groundwater. Numerous imperiled fish, and all the species and ecosystem services that depend on these fish, depend on this groundwater for their habitat. The construction of this border wall only puts additional strain on imperiled populations.
When a perceived change of landscape affects flying patterns
Even though birds could theoretically fly over a wall, many won’t due to a perceived change of landscape when flying nearby. Since the border serves a major migration corridor, the inability or unwillingness to fly over the wall may drastically impact migration patterns. Additionally, low-flying birds such as the masked bobwhite quail simply cannot fly high enough to cross an 18-to-30-foot wall. This can put vulnerable populations of low-flying birds even more at risk of extinction.
In addition to species ranges, I also examined the region’s critical habitats and protected areas. I found that 16 total U.S. critical habitats are within the construction zone of the existing or proposed border wall. Of these 16, 9 are home to endangered species and 8 are home to threatened species. On the Mexico side, I found that the existing or proposed border wall impacts 9 of the country’s protected areas.
It’s clear that the border wall will impact a plethora of imperiled wildlife and their habitats, but what does this mean for conservation efforts?
Areas most in need of conservation
By analyzing the spatial distribution and presence of regional biodiversity, U.S. critical habitats, and protected areas, Defenders of Wildlife and I were able to determine which areas along the border need to be the most protected from the border wall’s impact.
From this analysis, we can better understand which areas could potentially have wildlife crossings built or which areas we should be focusing on for blocking wall construction. Below is a map highlighting the areas along the border that should be most prioritized for conservation.
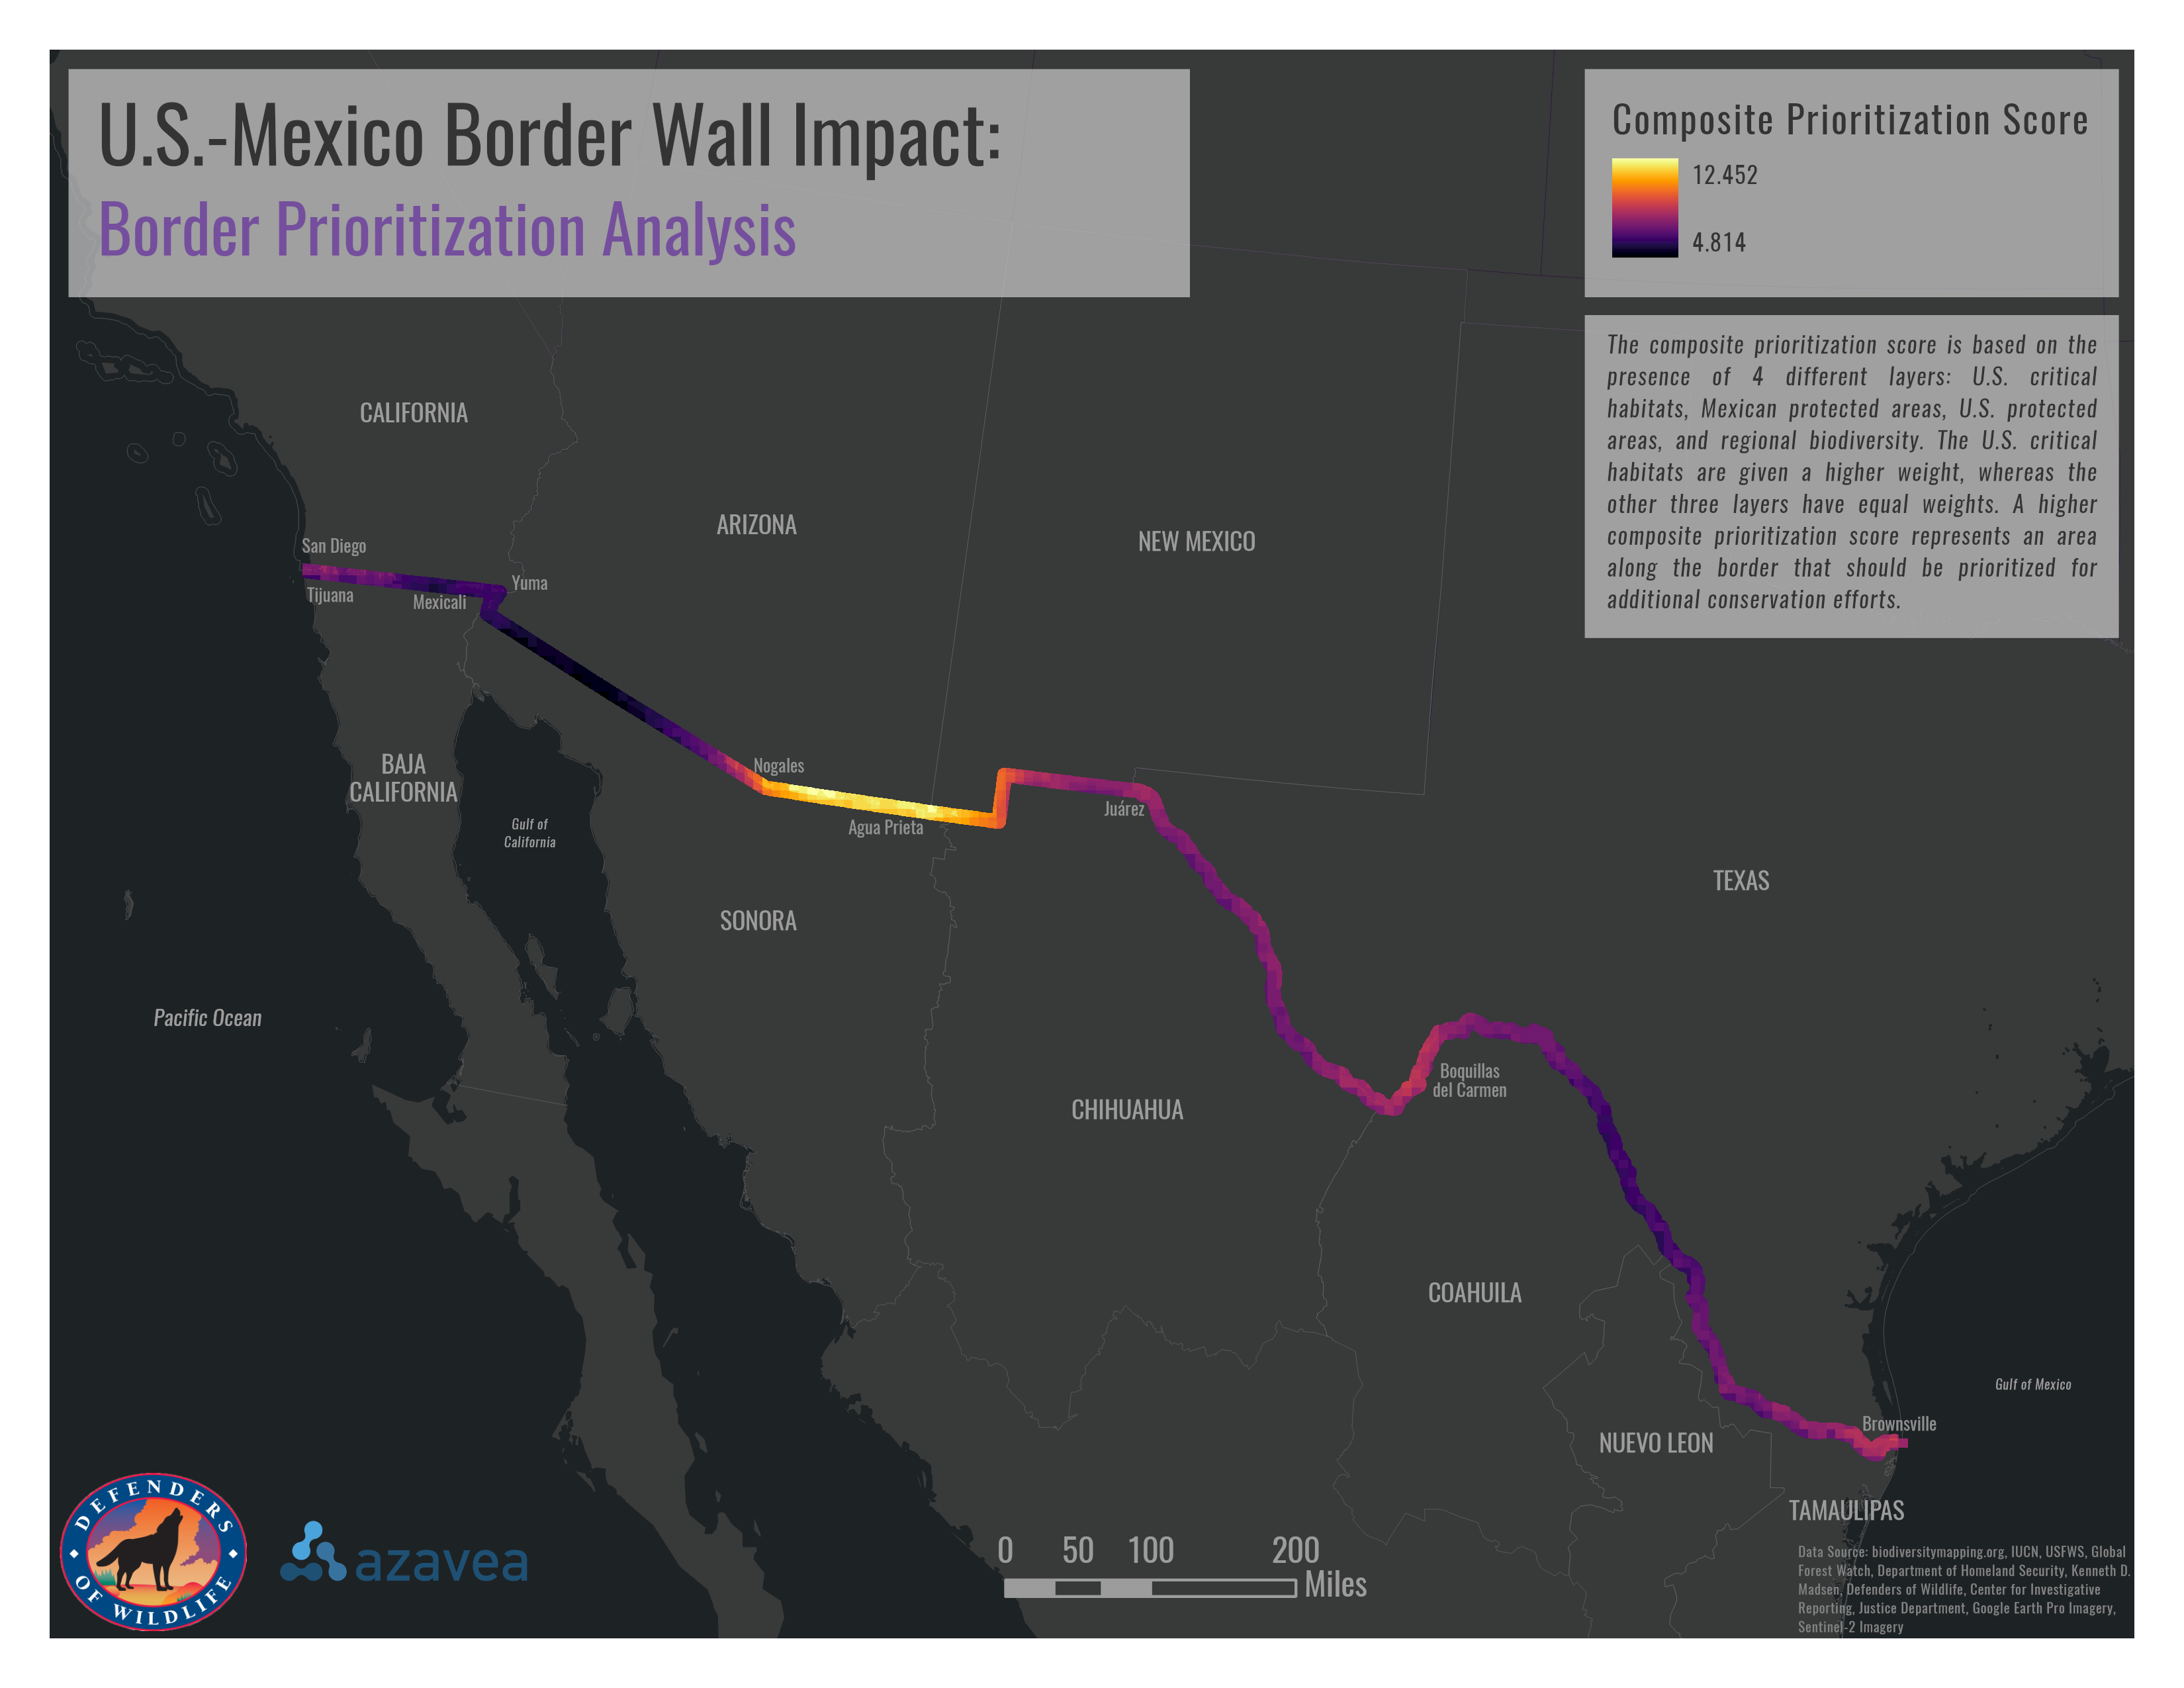
Areas with more yellow, or a higher composite prioritization score, are more in need of additional conservation efforts. This score was based on the level of biodiversity and the presence of critical habitats and/or protected areas for each area along the border.
The portion of the border that extends between Nogales, Arizona, U.S., and Agua Prieta, Sonora, Mexico, received the highest composite score due to high species richness and clusters of critical habitats and protected areas in that region.
Unfortunately, both existing and proposed wall lines affect the region that is most vulnerable. This doesn’t mean that we have to stop fighting against the construction of the border wall. Visit Defenders of Wildlife’s Take Action webpage to learn more about how you can demand change and help imperiled North American wildlife.