
This blog post is a guide to transforming open geospatial data into slippy map tiles using PostGIS, QGIS, and QTiles. It aims to help developers learn how to turn data sets like those available on OpenDataPhilly into a form that can be represented in geospatial web applications.
To accomplish this, we’ll walk through a simple sample task: producing a set of tiles that can be displayed as an overlay in Leaflet or OpenLayers depicting Philadelphia building footprints included in Microsoft’s recently released Building Footprint Data. Generated by neural network operating on aerial imagery, that data set features
Approximately 125 million building footprint polygon geometries in all 50 US States in GeoJSON format.
Available in the USBuildingFootprints repository, the data has been split into one large GeoJSON file for each state. Since these files range in size from 13 – 2500 MB when uncompressed, they’re not directly usable in Leaflet without some transformation. Transforming them into map tiles makes it easy for us to see the building footprint shapes depicted on a Leaflet map.
In order to create Philadelphia building footprint map tiles to use in Leaflet, we’ll follow a four step process:
- load the Pennsylvania data set into PostGIS
- create a new PostGIS table which includes only Philadelphia data
- view the Philadelphia data in QGIS
- tile the data for use in Leaflet with the QTiles plugin
At the end, we’ll have a set of slippy map tiles representing Philadelphia building footprint data to use as a Leaflet overlay, as well as a sense for how other open geospatial data could be processed for use on the web.
Loading Geospatial Data into PostGIS
We’ll first load the Pennsylvania data into PostGIS. To help simplify the process, I’ve set up a Docker-based ETL project which will work largely automatically. To run it, you’ll need to be on Linux or macOS and have a few pieces of software installed and available on your path:
- Docker
- Rake
- cURL
- GDAL
- QGIS
cURL, and Rake are standard developer tools that can be installed using your operating system’s package manager if they’re not already available as built-ins. Docker is a container service which will use to create a virtualized sandbox PostgreSQL database server. qgis is an open-source GIS application that provides, in part, an graphical interface for using GDAL – a library for working with geospatial data in both raster and vector formats. One of GDAL’s tools is ogr2ogr, which we’ll use to load a GeoJSON file into PostGIS. (All these tools are open-source, and you can learn more about them by visiting their respective websites.)
Once you’ve installed the requirements and cloned the repository, you can load the data into a Dockerized PostGIS container by running:
rake build
rake build will orchestrate a series of Rake tasks ultimately resulting in having a Dockerized PostGIS server running locally with a buildings database which includes both pennsylvania and philadelphia tables. Each row in these tables represents a single building footprint entry, with its geometry stored in well known binary format in a wkb_geometry column.
Automating the ETL with Docker and Rake makes the process repeatable across time and across different developer workstations. The Civic Apps team at Azavea has steadily moved toward treating ETL jobs as software development and keeping ETL code under version control because it makes it easier to do things like reingest data when the a source data set changes.
It’s worthwhile to understand the steps of the process to make them easier to modify for other largely similar yet slightly different ETL jobs. The Rakefile’s build task enumerates the series of specific tasks it performs (you can see their implementations in the Rakefile, too):
desc "Build"
task :build => [
    :check_env,
    :start_database,
    :download_buildings,
    :install_postgis,
    :import_buildings,
    :create_philadelphia_table
]
:check_env is just a simple guard to ensure curl and GDAL’s ogr2ogr are available in the environment.
:start_database starts a PostgreSQL database Docker container according to the configuration in docker-compose.yml.
:download_buildings uses cURL to download the Pennsylvania building footprint data and unzip it into a data/ directory.
:install_postgis installs the PostGIS extension in the buildings database. PostGIS enables us to perform geospatial operations on the data, including things like intersecting the pennsylvania table’s rows with Philadelphia’s city limits in order to create a philadelphia table.
:import_buildings uses GDAL’s ogr2ogr tool to load the building data in Pennsylvania.geojson into a pennsylvania table in PostGIS. Outside of Rake format, the ogr2ogr command to load the building footprint data is:
ogr2ogr -progress -s_srs "EPSG:4326" -t_srs "EPSG:3857" -f "PostgreSQL" \
  PG:"host=localhost dbname=buildings user=phillybuildings password=phillybuildings" \
  "./data/Pennsylvania.geojson" -nln pennsylvania
While the file source and database target options here may be self-explanatory, it is worth pointing out that the operation is also reprojecting the shapes on importing them using -s_srs the -t_srs options.
In the source GeoJSON file the shapes are stored in EPSG:4326 as is expected by the GeoJSON spec. However, to tile them for Leaflet we want to reproject them into EPSG:3857, or Web Mercator. Although we could use PostGIS to handle reprojection after loading the data, ogr2ogr enables us to reproject the shapes while loading the data, using the -s_srs option to specify the “source spatial reference system” and -t_srs to specify the “target spatial reference system.”
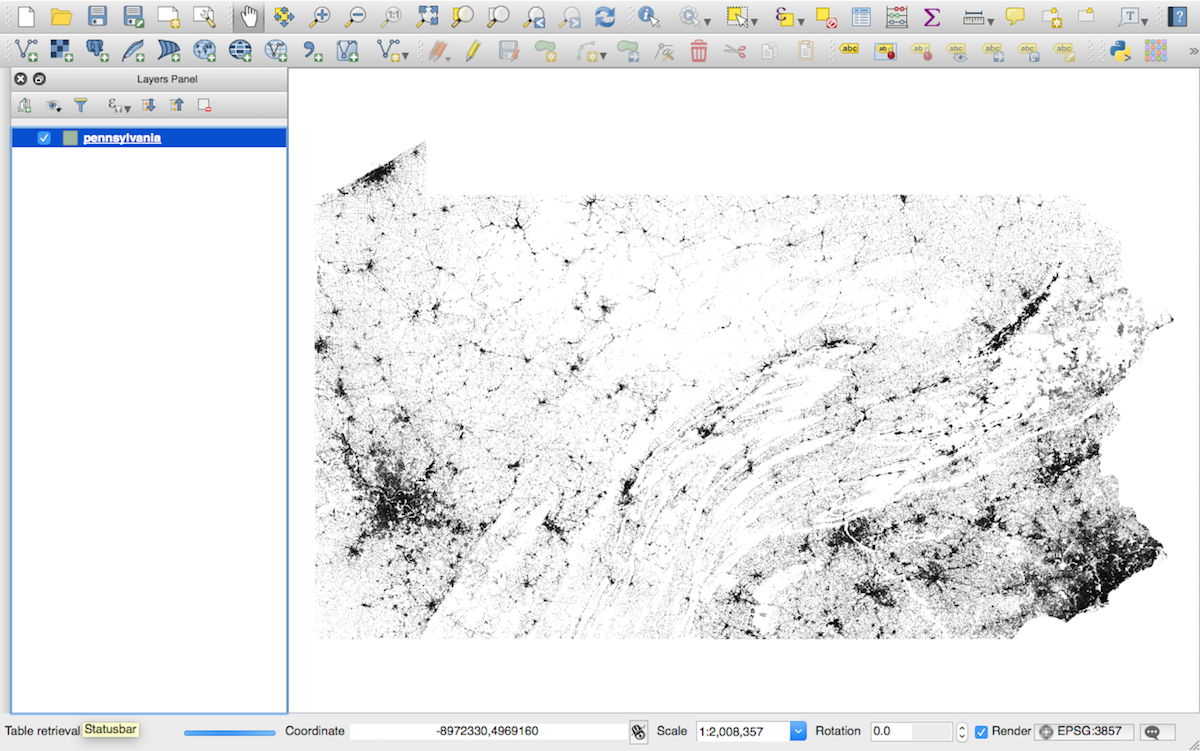
After the buildings are imported into a pennsylvania table, we can now view that data in QGIS by making a new PostGIS database connection. Viewed in QGIS, the data will look like this:
ogr2ogr can load data from other file formats, too, like Shapefiles or GML files.
Creating a Philadelphia Table
Now that we’ve got Pennsylvania buildings loaded into PostGIS and visible in QGIS, we could use QTiles to start creating Leaflet map tiles for all of Pennsylvania. However, the scope of our initial hypothetical task was to create tiles only for Philadelphia. Limiting the data to Philadelphia will help speed up the tile creation process and also vastly reduce the number of tiles that get created.
To do this, we’re going to create a new philadelphia table in the buildings database which includes only the pennsylvania rows whose shapes are within Philadelphia city limits. We’ll accomplish this using a SQL query which will create the new table by running PostGIS’s ST_Intersects operation on the pennsylvania table and a GeoJSON file storing Philadelphia city limits downloaded from OpenDataPhilly.
The ST_Intersects documentation has a detailed explanation of what the operation does. In general it will intersect two shapes in order to determine whether they “share any portion of space.” For our purposes we use it to gather only building footprint rows whose shapes are within Philadelphia city limits to include in the philadelphia table.
The :create_philadelphia_table Rake task creates the new table by using a SQL query saved in create_philadelphia_table.sql. When the table has been created successfully, you’ll see its row count printed to the terminal:
SELECT 120900
If we were to view the a philadelphia table in QGIS, the rendered data would look like this:
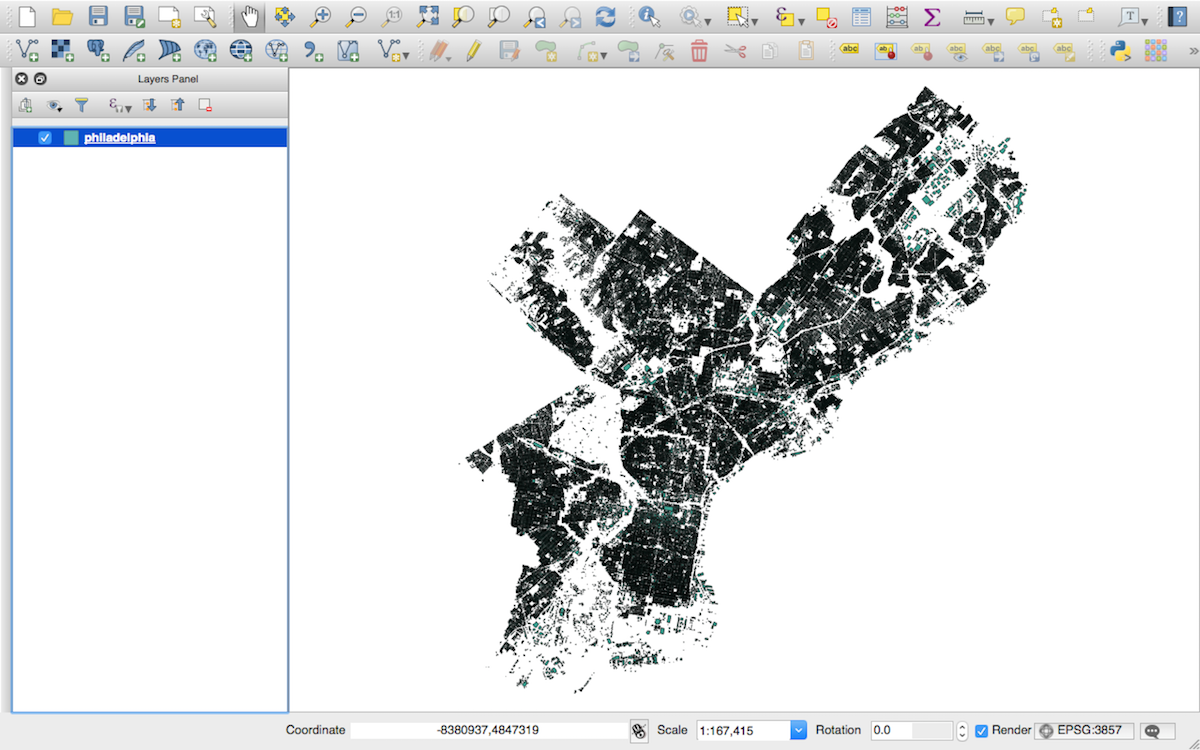
The image above depicts the Philadelphia building footprints rendered with a default QGIS symbology; the tiles we create will be rendered in the same way. If you’d like to change the symbology – for example, to make the building footprints orange rather than green – you can check out this QGIS tutorial on creating custom symbologies for vector data sources.
Creating Slippy Map Tiles with QTiles
QGIS has a suite of powerful tools for performing GIS operations, and now that the philadelphia PostGIS table is available we can use QGIS to do things like make custom maps and perform geospatial analyses. For our task we’ll use a QGIS plugin called QTiles to create a set of map tiles for Leaflet. This great tutorial explains how to install the QTiles plugin and use it to create custom tiles.
If you’re not familiar with “slippy map tiles”, they are image files stored in z/x/y path formats where z represents the zoom level, x represents the tile column, and y represents the tile row. The standard format enables Leaflet and other web map libraries to know what is the right set of tiles to request for a given map view. This blog post about creating pyramided map tiles has a much more in-depth explanation about how slippy tiles work.
One thing to know here, however, is that when tiling a given area of interest the number of tiles generated to encompass that area increases very rapidly as the zoom level increases. The OpenStreetMap wiki’s zoom level page has a great chart depicting the increase: at zoom level 4, 256 tiles will encompass the entire world; at zoom level 11, 4,194,304 are required; at zoom level 19 that number jumps to 274,877,906,944.
Although we’re creating tiles only for Philadelphia and not the entire world, the same principle still applies: the higher the zoom level we specify, the more tiles we’ll need generate, and the more compute CPU, memory, and time the process will take. Creating tiles for zoom levels 0 – 10 should work fairly rapidly even on an older machine; tiling up to 15 will take slightly longer; tiling up to zoom level 20 will take about an hour on a high-end MacBook.
I’d suggest trying out tiling up to maximum zoom level 15, since that’s high enough to see detail in the tiles but low enough to limit the time the tiling process will take.
The following steps will generate tiles:
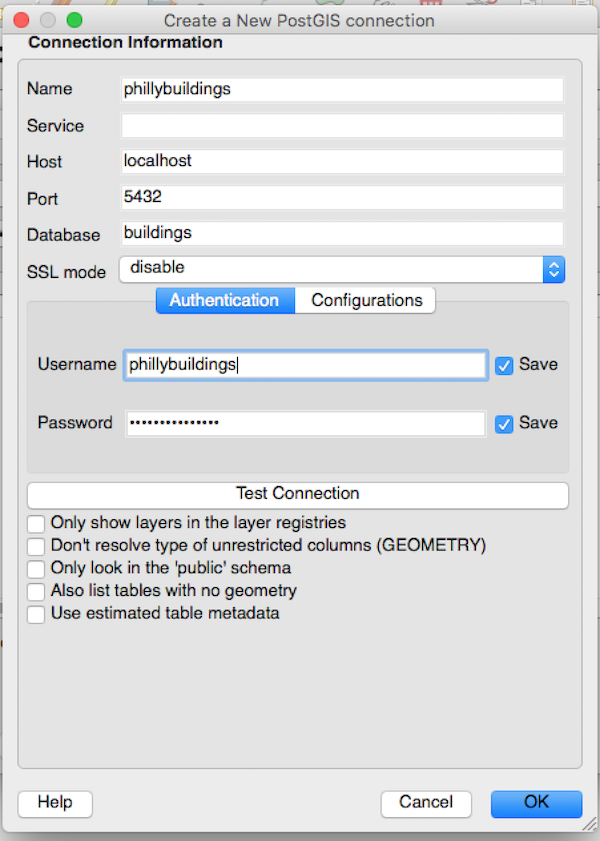
First, view the philadelphia table you just created in QGIS. To accomplish this, you’ll need to establish a connection to the Dockerized PostGIS database by making a new PostGIS database connection. Following the Rake build steps, the database server will be running on localhost:5432. Both the username and password are declared in the docker-compose.yml file as phillybuildings and the database itself is called buildings:
Once the connection is established, add the philadelphia table as a PostGIS layer.
You can install the QTiles plugin in QGIS by selecting Plugins > Manage and Install Plugins and then searching for “QTiles”:

Once QTiles is installed, you can launch it by opening the Plugins menu again and selecting QTiles > QTiles, which will launch an options menu.
To configure the tiling step, set the options to match what’s depicted here:
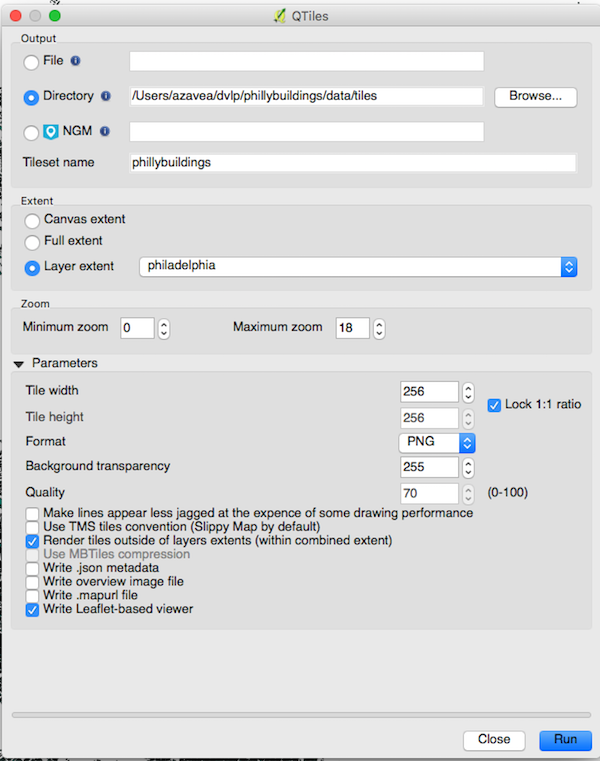
Take note that we’ve set the following options:
- “Maximum zoom” is set to
15to limit the number of tiles created - “Layer extent” has been set to
philadelphia, which means that QTiles wil only create tiles for the region encompassed by thephiladelphialayer - “Background transparency” is set to
0, to prevent QTiles from generating empty opaque tiles - “Write Leaflet-based viewer” has been checked to make it easy to verify the result of the tiling operation
Note that you should also set the “Directory” to be the directory into which you’d like to save the tiles and map viewer.
Clicking “Run” will start the tiling operation, with progress indicated by a bar on the bottom of the screen. Once the tiling’s been done, you can open the QTiles-generated phillybuildings.html file in the browser to see the tiles on a Leaflet map:
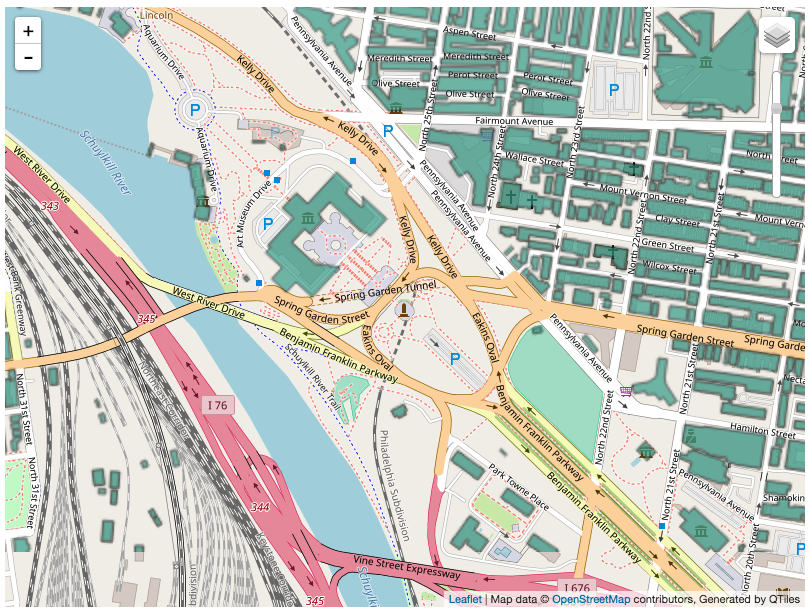
Using Slippy Map Tiles in Leaflet
The newly-generated tiles can be used as a Leaflet Tile Layer. The HTML file created during tiling has an example of how to create the layer:
var mytile = L.tileLayer('file:////Users/azavea/dvlp/phillybuildings/data/tiles/phillybuildings/{z}/{x}/{y}.png', {
  maxZoom: 18,
  tms: false,
  attribution: 'Generated by QTiles'
}).addTo(map);
On an aerial map (using a higher zoom level than we generated here), the new Leaflet overlay looks like this:
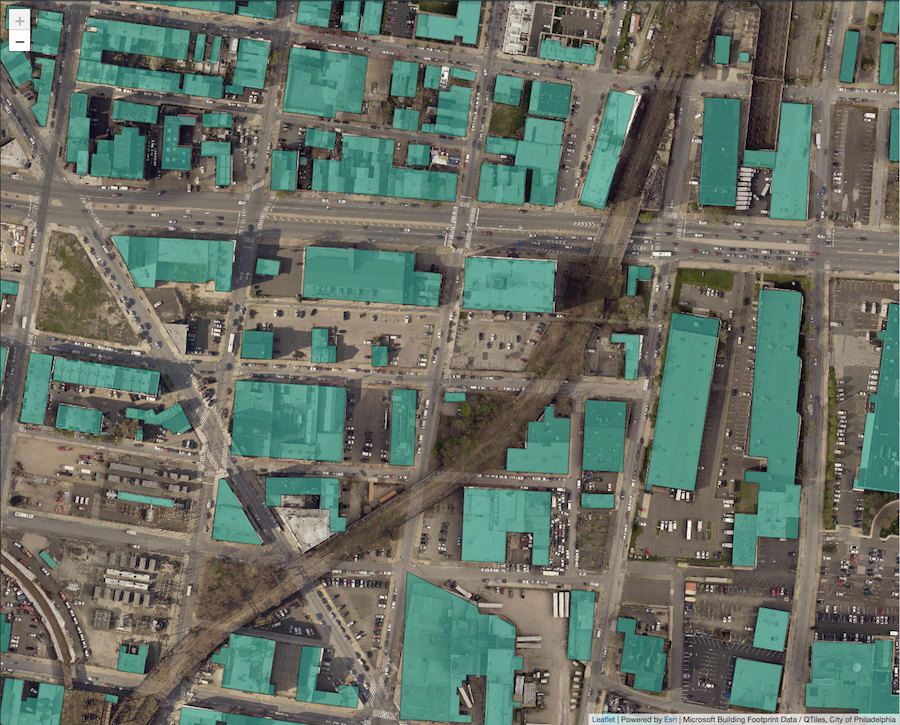
You can use them for local development by pointing to the file URI. For production deployments, the files could be hosted remotely by a provider like AWS S3 or Azure Blob Storage.
Finding Open Geospatial Data
Finding geospatial data and loading it into PostGIS is a common task in the process of developing GIS web applications. Once such data is loaded into PostGIS, it can be used for analysis, queried in an API using GeoDjango, or turned into tiles for Leaflet.
While this tutorial focused on processing and tiling data from the Microsoft US Building Footprints data set, it may also offer an idea of how one might load geospatial data from other similar sources. If you’d like to try working with different data sets, here are a few places to find them:
- OpenDataPhilly has a collection of GeoJSON-formatted data from the City of Philadelphia
- the Western Pennsylvania Regional Data Center has a similar collection of GeoJSON data for Pittsburgh and Allegheny County
- Chicago also has a collection of geospatial data including some which can be exported to GeoJSON
To load these data sets into PostGIS, you can experiment with making changes to the ETL project we used for this tutorial.
Discovering Additional Tiling Resources
If you’d like to learn more about creating tiles for geospatial web applications, check out the following blog posts:
Generating Pyramided Tiles from a GeoTIFF using GeoTrellis
This blog post presents a tutorial for creating slippy map tiles from a GeoTIFF by using GeoTrellis. It describes the process of tiling an NLCD land cover layer to display on a Leaflet map and includes a detailed explanation of the slippy map tile file structure.
Tilegarden: Serverless Tile Rendering with AWS Lambda
An artifact of Azavea’s Open Source Fellowship, Tilegarden is a project which enables serving tiles dynamically using Lambda functions. The post also features a working demo of Tilegarden being used to render Philadelphia’s stormwater and wastewater inlets.
How to Convert Geodatabase Spatial Data and Related Tables to Vector Tiles
This tutorial uses GDAL, ogr2ogr, and other interesting GIS tools in order to create vector tiles from Mapbox-hosted data. The tiles it created are used in the New Jersey Wildlife Habitat Finder, an Azavea research project which makes a New Jersey wildlife habitat data set accessible and usable on the web.
Serving Tiles with GeoTrellis, Lambda, and API Gateway
The result of another Azavea research project, this blog post documents the costs and benefits of building a “serverless tile server” using AWS Lambda functions along with GeoTrellis.