
This blog post presents a tutorial for generating pyramided map tiles (also called Slippy Map tiles) from a GeoTIFF using GeoTrellis, which can be used in Leaflet or OpenLayers.
Pyramided Tiles
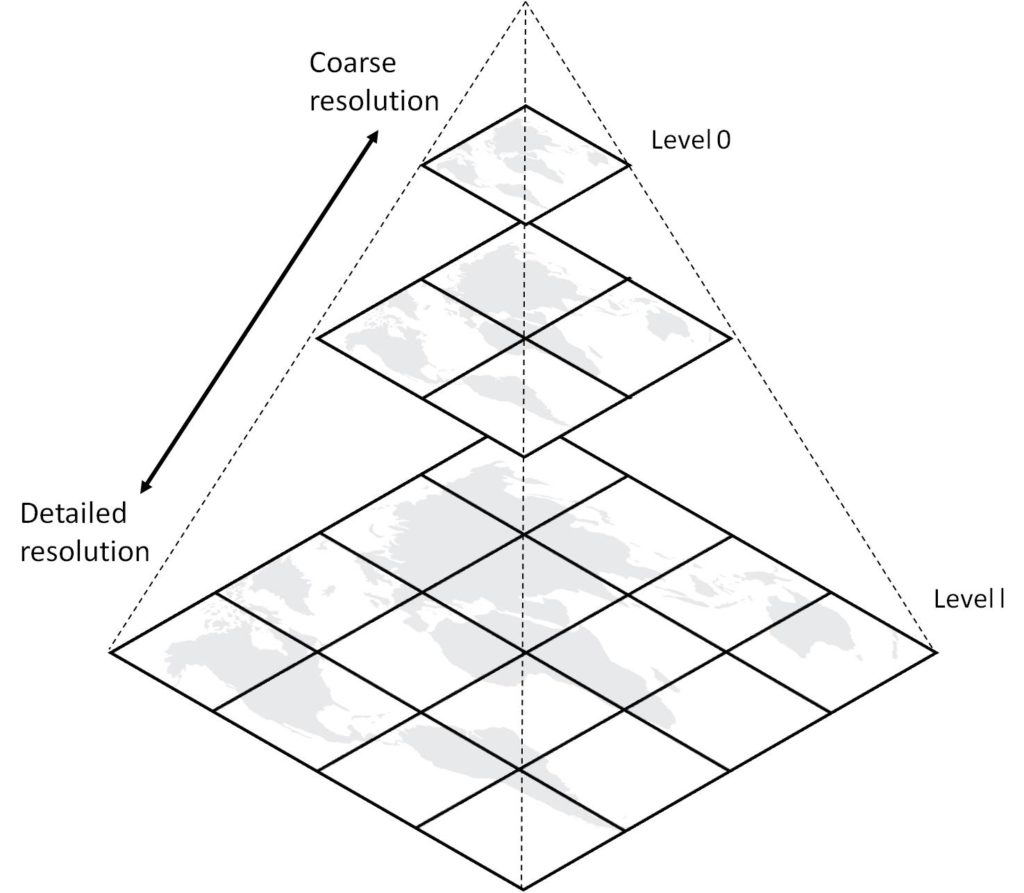
To show the appropriate detail at a certain zoom level while conserving bandwidth, images of large geographic areas are tiled to optimize delivery. In a zoomed out state, we may need only a single image to show the entire area, albeit at a very coarse resolution. In a zoomed in state, a small area should be shown in much more detail. Each zoom level has 4 times the tiles of the previous one, with Zoom Level 0 starting with exactly 1 tile. The size of each tile in the scheme is identical, most often 256px square on the web.
The source GeoTIFF has full detail at maximum resolution for the entire area. In order to generate pyramided tiles, we need to resample the source at different sizes, and then cut the resulting image into tiles, arranged in a format that can be accessed by Leaflet. This is the Z/X/Y or Slippy Map tile format, where Z is the zoom level, and X and Y are the column and row of the tile.
Zoom Levels
Since each zoom level has an exponentially larger number of tiles than the last, generating tiles to high zoom levels can get very expensive! To determine the number of tiles to generate, we can use the following table as a guide:
A number of factors inform which zoom level to pick:
- Resolution of the source data. Generating high resolution tiles from low resolution source would be wasteful, since above the source resolution the tiles would not be reliable or have any interesting information. On the other hand, generating low resolution tiles from high resolution source would be lossy, since the detail of the source would not be captured completely. One should pick the zoom level that most closely corresponds to source resolution.
- Processing power. Generating each zoom level requires more work than all the zoom levels before it. A humble laptop may take a very long time to generate high zoom levels. Since GeoTrellis is optimized for large scale distributed processing, for these cases it is best to spin up an EMR Cluster and do it there.
- Storage capacity. Where will the tiles be saved? Are there limits to how many files can be saved or served online?
The source data we are going to use in this blog post has 30m resolution, which means that one pixel represents a 30×30 meter square. So zoom level 13 will give us the highest detail with the least wastage.
Setting Up the Project
Previously, we learned about building a Geoprocessing App with GeoTrellis and React. As part of that, we ingested a GeoTIFF of the National Land Cover Data classification for Pennsylvania into a Geospatial Spark RDD. Storing data in that format allows for fast querying at run time, which we observed in the app.
For this tutorial, we’re going to use the same project, which has been upgraded to include a demo for generating pyramided tiles.
Ensure you have the following tools installed locally:
$ which make curl docker java sbt spark-submit
/usr/bin/make
/usr/bin/curl
/usr/local/bin/docker
/usr/bin/java
/usr/local/bin/sbt
/usr/local/bin/spark-submit
Then, clone this repository: azavea/geotrellis-collections-api-research, and cd into it. Open up the project in your favorite text editor.
Generating Tiles
Generating tiles using GeoTrellis is done in a similar fashion as ingesting a GeoTIFF. We write a Scala Object with a main method which has instructions for reading the RDD, transforming it as needed, and writing the painted tiles according to a color map that translates data values into colors. In our case, class is LandCoverPaint. The most useful part is within this try block:
try {
  // Read color map from original GeoTIFF
  val geotiff = SinglebandGeoTiff(localGeoTiffPath)
  val colorMap = geotiff.options.colorMap.get

  // Initialize source layer from the local catalog
  val layerId = LayerId(LayerName, 0)
  val layerReader = FileLayerReader(localCatalogPath)
  val sourceLayer =
    layerReader.read[SpatialKey, Tile, TileLayerMetadata[SpatialKey]](
      layerId,
      SparkPartitions
    )

  // Set zoomed layout scheme with projection and tile size
  val layoutScheme = ZoomedLayoutScheme(WebMercator, TileSize)

  // Reproject the source layer to WebMercator for painting
  val LayoutLevel(_, layoutDefinition) = layoutScheme.levelForZoom(MaxZoom)
  val (_, webMercatorLayer) =
    sourceLayer.reproject(
      WebMercator,
      layoutDefinition,
      Options(
        method = NearestNeighbor,
        targetCellSize = Some(layoutDefinition.cellSize)
      ))

  val path = s"$localTilesPath/$LayerName/{z}/{x}/{y}.png"

  // Pyramid the reprojected layer into as many zoom levels as specified,
  // given the layout scheme and resampling method
  Pyramid.levelStream(
    webMercatorLayer,
    layoutScheme,
    MaxZoom,
    ResampleMethod
  ).foreach { case (z, levelLayer) =>
    // For each zoom level layer, find the spatial key to z/x/y path
    val paintedLayerId = LayerId(LayerName, z)
    val keyToPath = SaveToHadoop.spatialKeyToPath(paintedLayerId, path)

    // Paint the layer values with the color map from above and save
    levelLayer
      .mapValues(_.renderPng(colorMap).bytes)
      .saveToHadoop(keyToPath)
  }
}
It starts off by declaring some constants for configuring the painting process Then, a main method reads the color map from the original GeoTIFF, initializes the source catalog for reading data, sets a zoomed layout scheme (since we want pyramided tiles at each zoom level), reprojects the source layer (which is in EPSG:5070 Conus Albers) to EPSG:3857 Web Mercator (which is used by Leaflet to render maps in the browser), and writes the PNG files for each tile. Since the operations are performed locally, we use FileLayerReader and SaveToHadoop. To perform these operations on inputs and outputs saved in S3, we would use S3LayerReader and SaveToS3 which provide a similar API.
The file is run by the make paint directive, whose details can be seen in the Makefile:
paint: ingest
ifeq (,$(wildcard ./ingest/land-cover-data/tiles/nlcd-pennsylvania/0/0/0.png))
   bash -c "trap 'cd ..' EXIT; cd ingest; spark-submit \
       --name \"Paint PA Land Cover Tiles\" \
       --master \"local[*]\" \
       --driver-memory 4G \
       --class LandCoverPaint \
       target/scala-2.11/geotrellis_collections_api_ingest-assembly-2.0.jar"
endif
The paint target depends on the ingest target, which in turn depends on the download-tif target. Each runs only if it needs to, painting the tiles, ingesting the GeoTIFF, and downloading the GeoTIFF respectively.
To run all the steps in order, simply run make:
$ make
The three steps above take about 15-25 minutes to complete, and will tax your CPU completely. Once it finishes, you can check to see the tiles exist:
$ ls ingest/land-cover-data/tiles/nlcd-pennsylvania/
0  1  10 11 12 13 2  3  4  5  6  7  8  9
Where each folder corresponds to a zoom level. They go up to 13 as specified because our source data is a 30m dataset, and zoom level 13 comes closest to it.
One such painted tile looks like this:
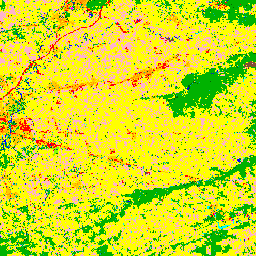
The colors used to paint the tile come from the color map already present in the source GeoTIFF. In case the source did not specify any colors, or we wanted to change them, we could specify a custom color map.
Adding Tiles to Front-End
Now that the tiles are ready, we just need to add them to Leaflet in the front-end. To allow this, first we load the tiles directory into the Docker container that runs the app, and add a toggle button to load them. With that, we can simply run make server and see the finished app in action at http://localhost:9555.
$ make server
Furthermore, these tiles can be uploaded to S3, and used on the web:
To see the full set of changes added to the original project to add painting capabilities, see this pull request.
Conclusion
GeoTrellis is a full-featured tool for working with geospatial data. Not only does it support ingesting and querying data, but also exporting it into visual formats that can be used in conjunction with the analytical service to provide cohesive user experiences. These techniques are used in production in projects like Model My Watershed, and make use of both runtime and ETL capabilities of GeoTrellis.
To learn about painting tiles dynamically with GeoTrellis, check out the GeoTrellis Landsat Tutorial Project, which renders PNGs on the fly in response to query parameters. Next, read up on serving dynamic tiles using GeoTrellis on Amazon Lambda. And if you have questions about ingesting or GeoTrellis in general, their gitter has an active, friendly, and welcoming community of contributors willing to help.