
A new exhibit on redlining in Philadelphia — A Dream Deferred — opened to the public last night. Little Giant Creative partnered with Azavea, IB5K, and local artists and historians to create an interactive experience that encourages visitors to explore how policy and race have shaped the landscape of Philadelphia and the lives of its residents. Azavea Data Analytics team members who crunched the numbers and analyzed the data presented in the maps and visualizations for the project attended.
The Story
The name for the exhibit comes from a Langston Hughes poem of the same name that asks what happens when people and cities are kept from reaching their full potential. There is a nasty history of redlining in this country and particularly in Philadelphia that has done just that.
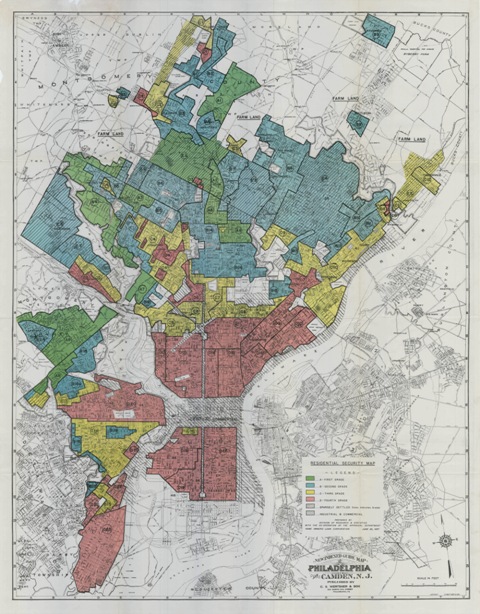
Beginning in the 1930’s, bank lenders, insurers, and the US government utilized the process of “redlining” to differentiate neighborhoods for city planning purposes. Districts were color-coded by risk level. Those marked with red lines were considered the riskiest for mortgage support. This practice disincentivized lending agents from investing in these “red-lined” neighborhoods, which led to decades of disinvestment, predatory lending, and manipulated housing prices.
Redlining disproportionately affected (and even targeted) neighborhoods with high numbers of people of color. The consequences of this process have resulted in devastating cycles of poverty for generations of people of color.
Redlining was made illegal in 1968, but the effects are visible today.
The Exhibit
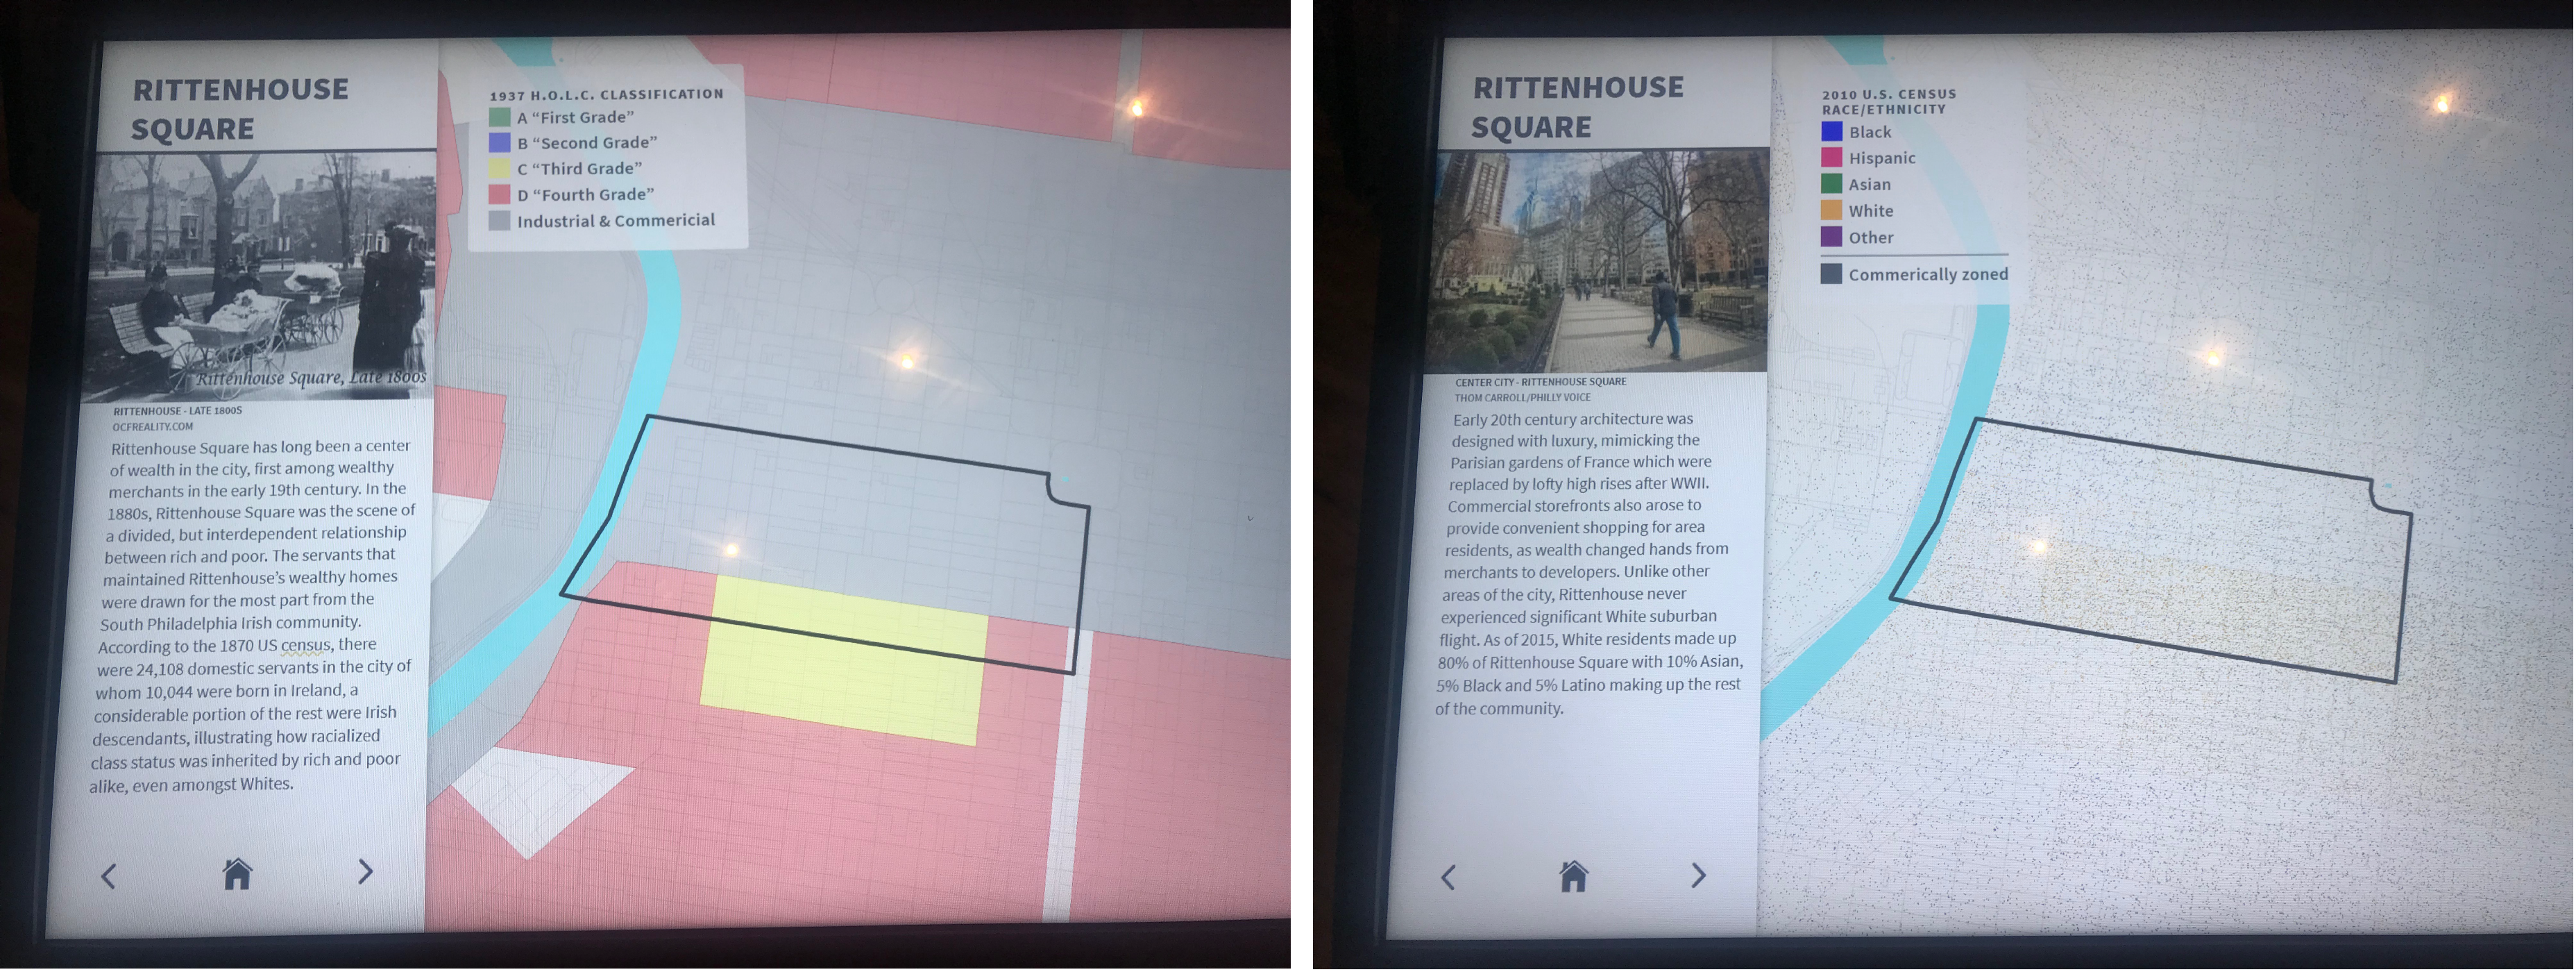
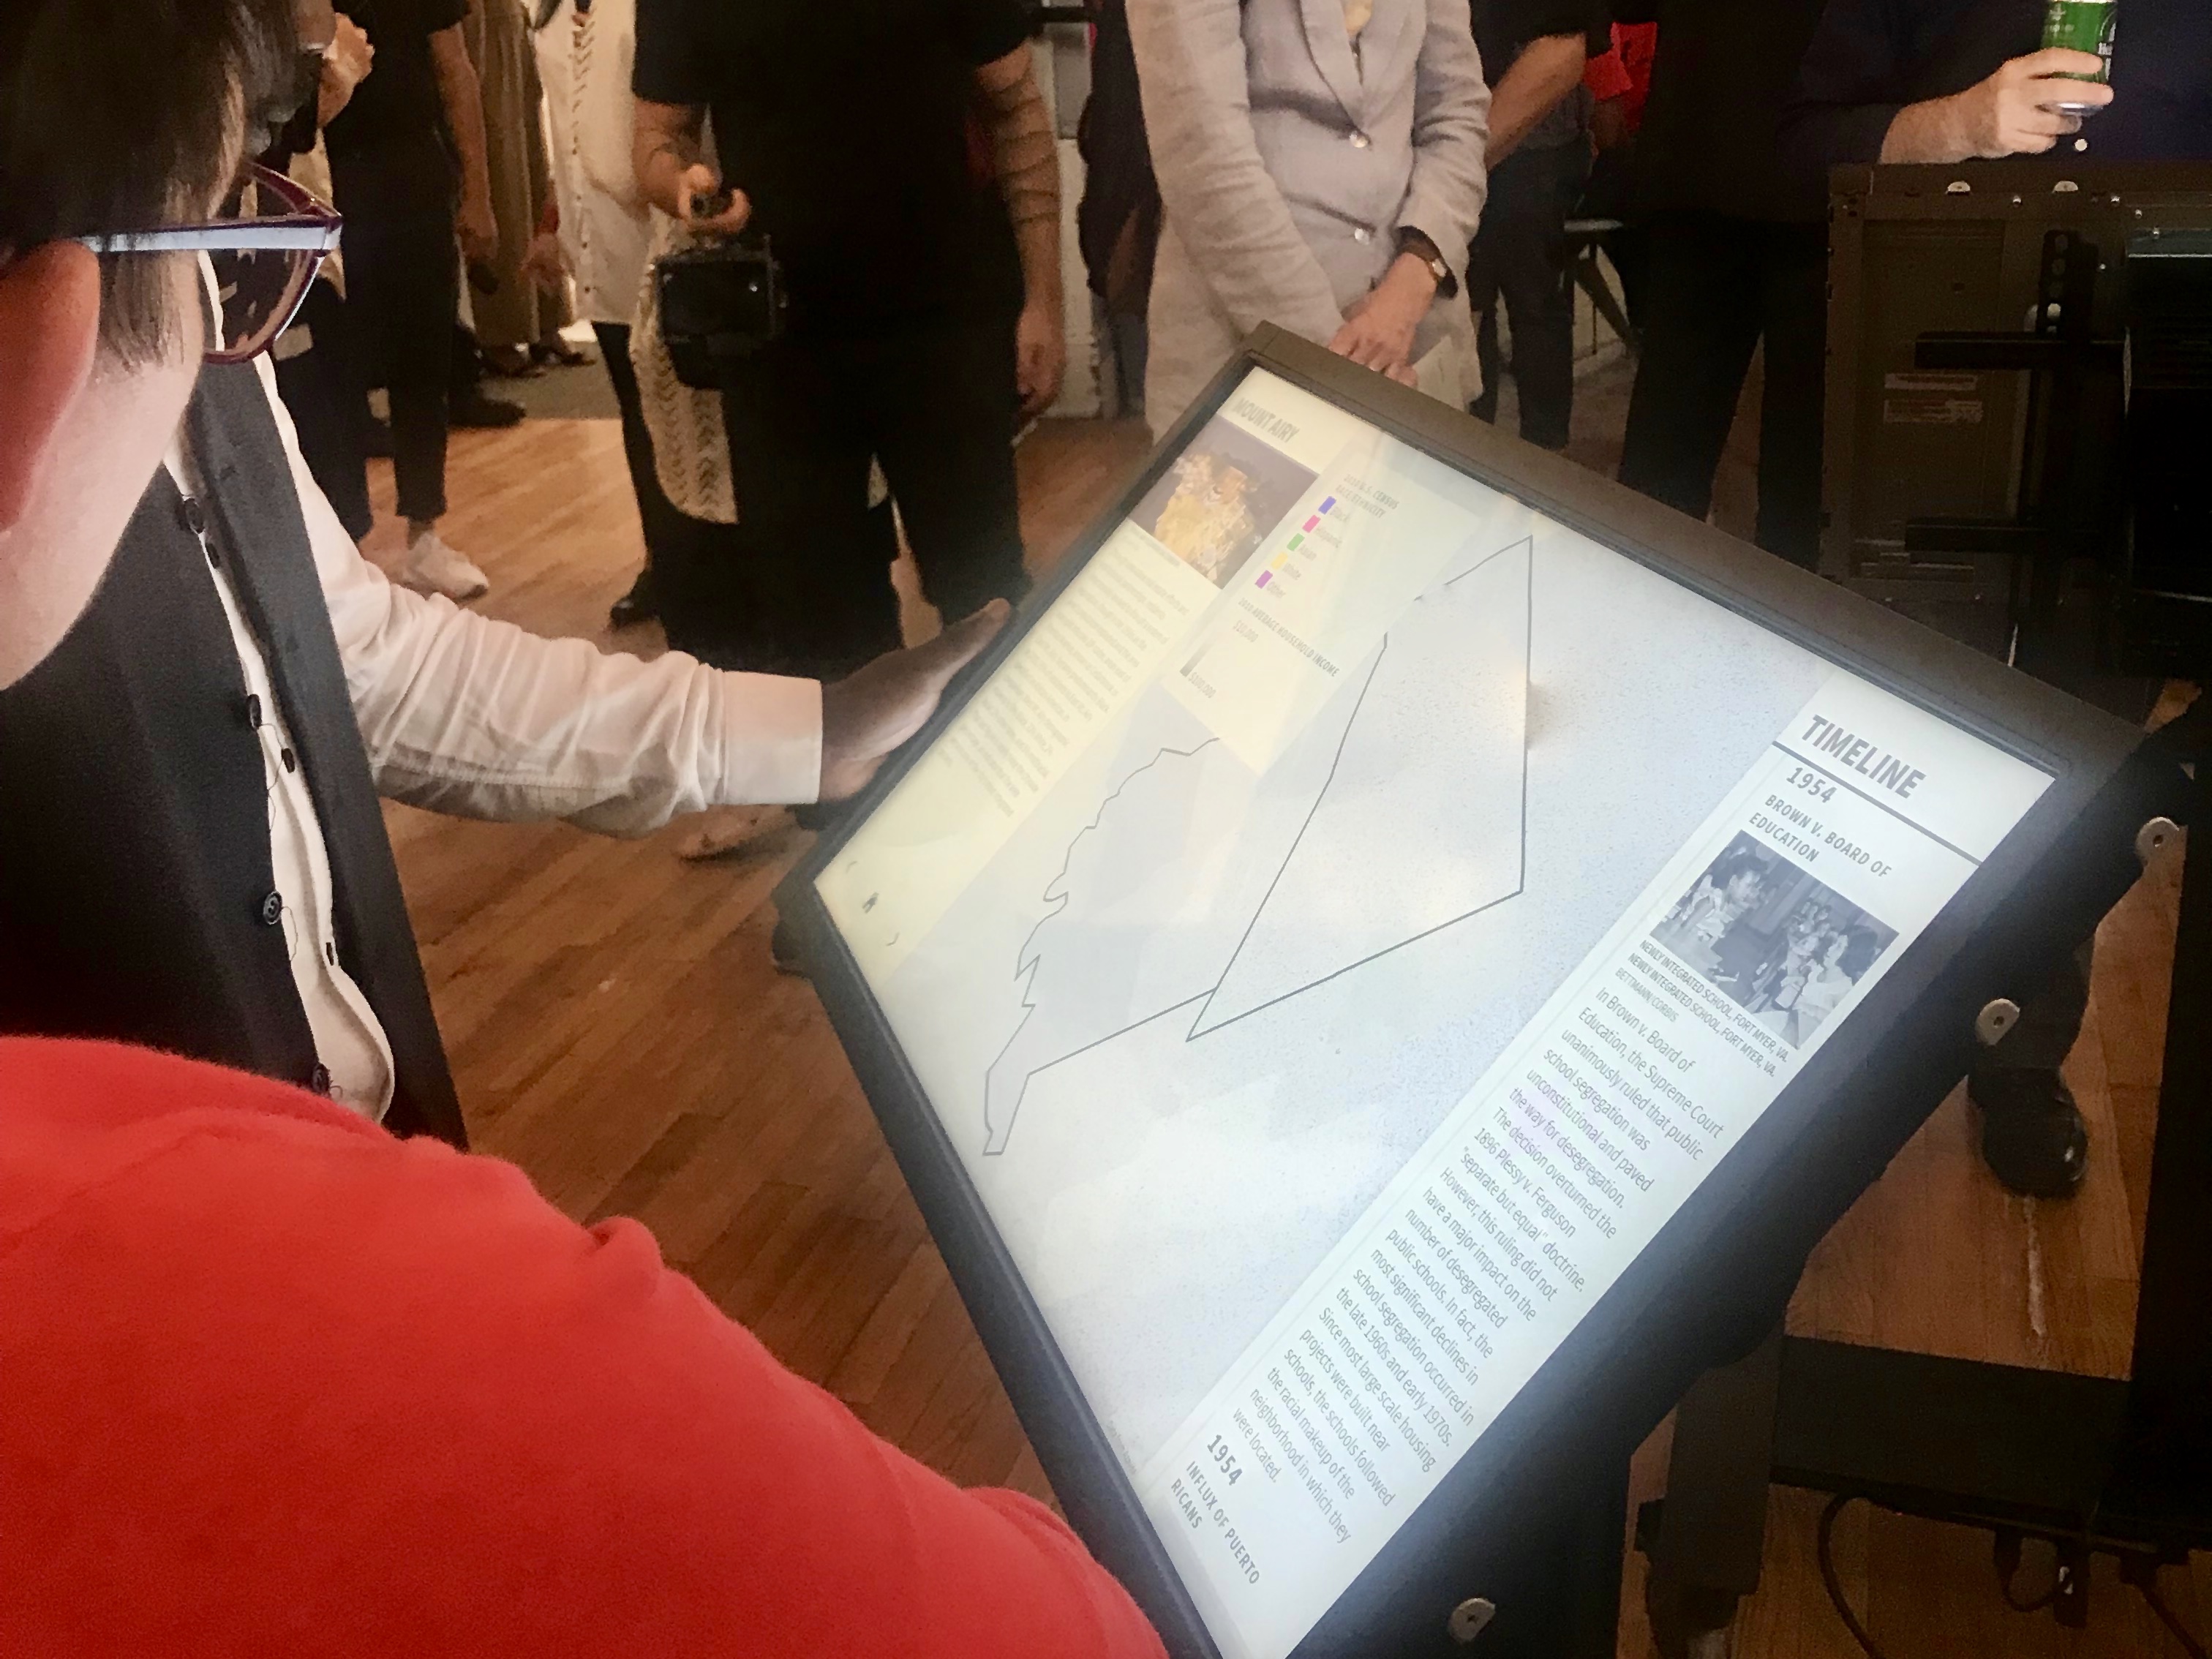
“A Dream Deferred” walks visitors through the devastating impact of redlining on Philadelphia through interactive touchscreens and compelling data maps.

These displays overlay historical redlining maps with modern maps of crime rates, health outcomes, job opportunities, and concentrations of high poverty. The exhibit makes a convincing case for redlining having a compounding effect on the lives of its victims and argues that where people lives determines their quality of life.
Additionally, exhibit visitors can hear first hand what victims of discriminatory land ownership practices have experienced in a moving 20-minute documentary film. On the adjacent wall is an art installation by local artist Shawn Theodore. Informed by historical mapping data, the artist uses photography, visual art, and sculpture to reimagine what our communities might look like if resources were distributed evenly. A reflection booth sits in a quiet corner near the exit. This is where visitors can take time to reflect on what they have walked through and record their stories.
Exhibit organizers hope that through its immersive experience, shocking data visualizations, and person-centered storytelling, “A Dream Deferred” will bring awareness and empathy to the issues of generational poverty and racial discrimination in this city, and drive its citizens to action.
Don’t Miss Out!
Make sure to catch this exhibit and see a great example of Azavea’s social impact work before it’s gone! The free exhibit is located at 600 Spring Garden Street and is open to the public September 21 through November 17.
Hours:
Wednesday & Thursday 12pm to 7pm
Friday & Saturday 1pm to 8pm
Sunday 1pm to 5pm
Bonus: a pop up cafe in the exhibit space will feature Vietnamese coffee from Cà Phê Roasters and pastries from Darnell’s Cakes. Yum!
There are so many opportunities to use mapping and data visualizations to promote awareness of pressing social issues. Do you plan to work on a project like this one? Let us know how we can be involved!