
In part 1 of our series on Azavea’s redistricting and gerrymandering work, we look at the history of our involvement in this space and what we’re currently working on.
Gerrymandering, compactness, contiguity, the efficiency gap. These are the kinds of words that make a lot of redistricting nerds excited these days. Rarely does the application of GIS and spatial analysis intersect such a fundamental part of our democracy and its policies in the way that it does with redistricting and gerrymandering. With our mission as a B Corporation, nothing could be as important as using our expertise to better inform the public and effect positive change on this policy issue.
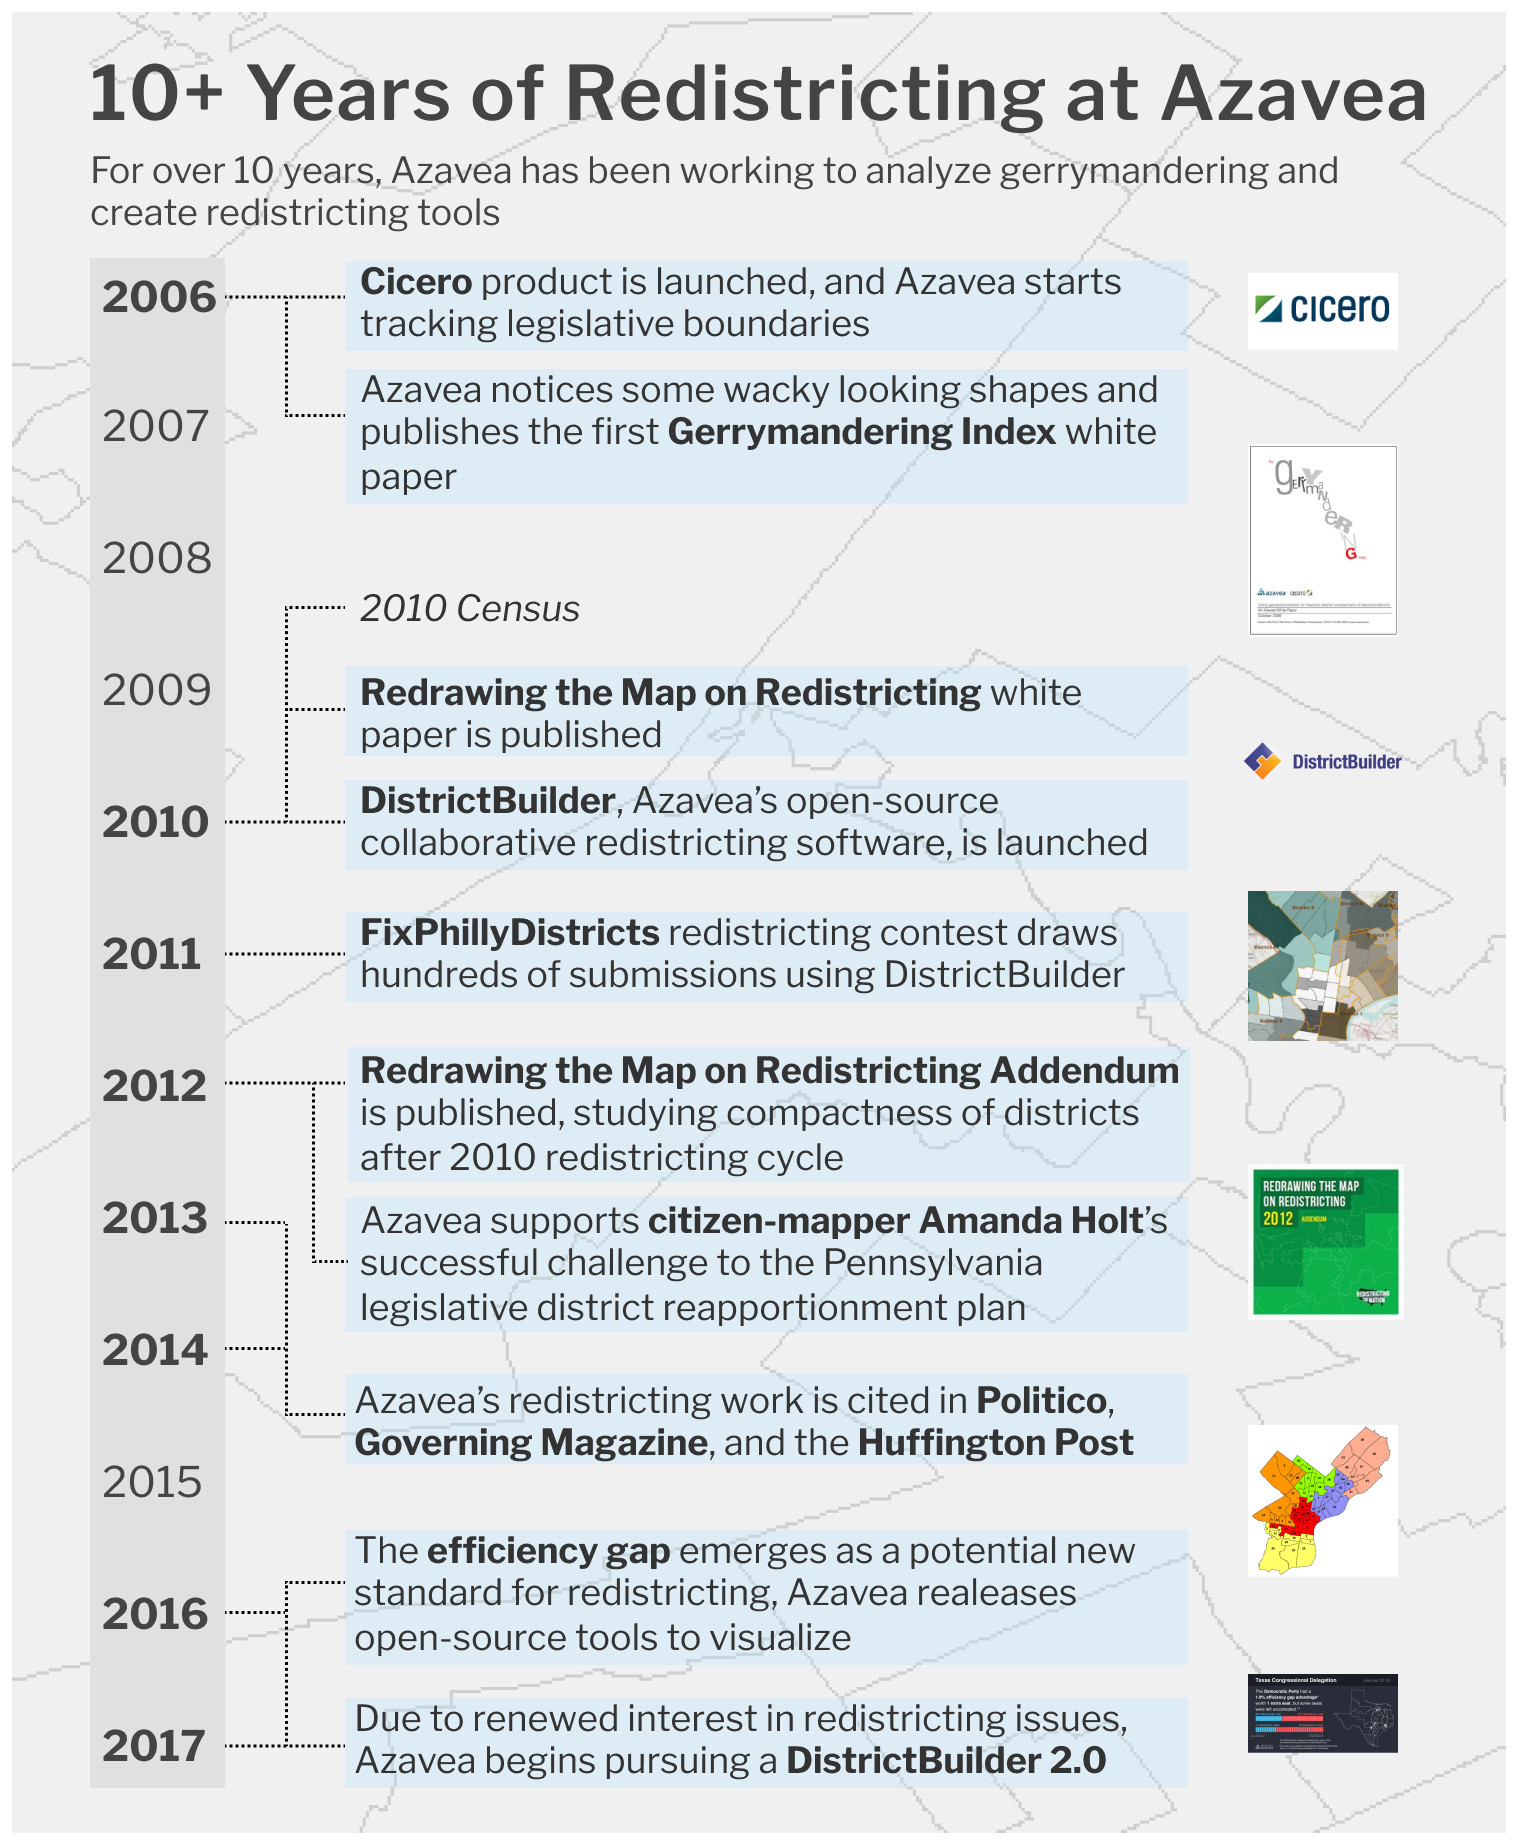
Since its founding, Azavea has been involved with redistricting and gerrymandering. Starting with our Cicero product, first launched in 2006, we have been tracking legislative boundaries. We found some pretty wacky looking shapes and set out to quantify it with our Gerrymandering Index using some pretty standard compactness measures. We went a step further with our Redrawing the Map on Redistricting white paper series in 2010 and 2012, further refining and expanding the measures we used to analyze legislative districts. Furthermore, we supported citizen-mapper Amanda Holt’s successful challenge to Pennsylvania’s legislative districts.
We also built an open source collaborative redistricting application, DistrictBuilder, in collaboration with the Public Mapping Project. Our aim with DistrictBuilder is to help citizens engage with redistricting and make it a more public, collaborative process.
Redistricting after the 2010 Census resulted in some heavily-litigated districts. As of June 2017, there are ongoing court cases in 9 states. At Azavea, we’ve mostly focused on the compactness of districts, which is a quantifiable measurement we can calculate using GIS software. But we realize that incompact districts ≠ gerrymandered. It’s one of many factors that could, but does not always, define a district as being gerrymandered.
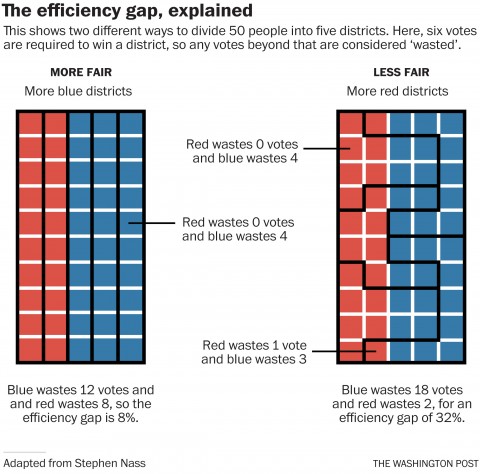
New measure of partisan gerrymandering: the efficiency gap
Recently, a new standard for measuring partisan gerrymandering has emerged, known as the efficiency gap. In 2015, two policy researchers named Stephanopoulos and McGhee published a paper to introduce this new metric. In a landmark case in Wisconsin, a panel of federal judges ruled that the Republican party intentionally derived a biased plan. This resulted in a map that gives them an advantage that goes well beyond the state’s natural political lean.
Essentially, the efficiency gap measures a political party’s wasted votes. This determines whether a party systematically engineered the map to disproportionately turn votes into seats and disadvantage the other party. The measurement is calculated using election results for each district and carries some important assumptions, which are noted in the paper. Now, it’s on its way to the Supreme Court, as the state has appealed the federal panel’s decision.
What could be emerging is a new standard to measure partisan gerrymandering. This could have very real and permanent effects on the existing district maps for many states. It’s groundbreaking because until now, the courts have been reluctant to settle on any one standard for gerrymandering. With this in mind, we calculated efficiency gap formula to calculate the partisan advantage in each state. By our calculations, at least three Congressional plans would not pass the legal threshold Stephanopoulos and McGhee set in their paper. We’ll be releasing in an upcoming blog on the topic.
What’s next for Azavea
In light of a renewed mid-decade interest in redistricting, we’re pursuing a DistrictBuilder 2.0. We hope to incorporate new types of gerrymandering measures into the platform.
We hope to continue the conversation around fair redistricting and measuring gerrymandering. We’re excited to attend the Geometry of Redistricting workshop this August at Tufts University. Our CEO, Robert Cheetham, will be presenting DistrictBuilder while our team helps to teach classes in spatial analysis. In addition, we’ll be working to build gerrymandering analysis tools during the two-day hackathon at the event.
If you can’t make the event, we encourage you to email us about your ideas for DistrictBuilder and gerrymandering research.
Check out the next blogs in this 3-part series:
The Most Gerrymandered States Ranked by Efficiency Gap and Seat Advantage
Learn about our methodology for ranking the efficiency gap for each Congressional delegation in all 50 states and visualize the results…
Leveraging Node.js, D3.js, and HTML Canvas for Scalable Infographics
We used JavaScript visual tools & Node.js as a scripting language in our production of 50 automatically-generated infographics about the efficiency gap…