
Our Data Analytics Team produced a webinar series on Data-Driven Advocacy for Nonprofits. The 3rd webinar, 5 questions you can answer with maps and data visualizations, is now split into 5 short videos, one on each question.
This post covers the first video, including details of a case study.
Where are my current clients and donors? Where can I find more?
A Case Study with the Greater Philadelphia Cultural Alliance (GPCA)

Question: Where are my current clients and donors? And where can I find more?
Organization: Greater Philadelphia Cultural Alliance (GPCA)
Their Data: Geocoded database of 1.5 million households, coded with genre and event
Other Data: Demographic and tapestry segmentation
Project/Process: Analyze spatial trends of organization’s patrons/donors, compare to demographic or tapestry segmentation
Result: Identified gaps in reach and areas of opportunity (where our current clients and prospective clients?)
Webinar Slides: Data-Driven Advocacy Webinar 3 Slides
Webinar Video Short: Webinar Short Case Study 1
Our Methodology: How did we do it?
Here is a summary of the spatial analysis methods that we used to show who GPCA’s patrons are and where they can be reached.
Tapestry/Lifestyle Segmentation
- Helps you understand customer’s lifestyle choices, what they buy, and how they spend their free time
- Classifies US residential neighborhoods into 67 unique segments based on demographic and socioeconomic characteristics
- Delivers insights so you can identify best customers and underserved markets
- Generates higher response rates because you avoid less profitable areas
Tapestry segmentation data can be purchased in spatial format from ESRI, an industry leader in GIS tools.
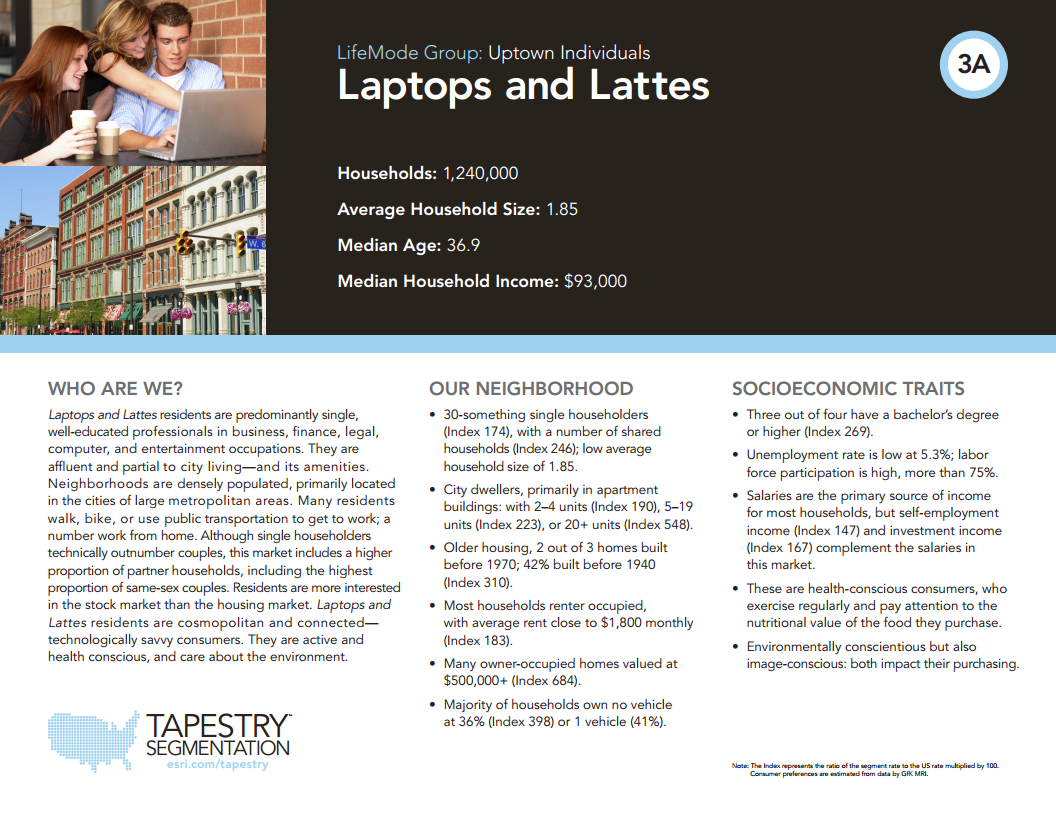
For example, one segment in Philadelphia is called Laptops and Lattes – single, urban professionals who live in apartments and work in business, finance, legal, computer, and entertainment occupations.
We mapped out household information for GPCA’s patrons and donors to identify spatial trends. We then compared these patrons to demographic and tapestry segmentation data.
By doing so, we were able to:
- Find gaps in reach: what areas are we not reaching?
- Identify areas of opportunity: where our current clients and prospective clients?
Tapestry Segments Mapping
Tapestry Segments Mapping Answers the Question:
Which census tracts have the most households from the tapestry segments I want to target?
For example, GPCA was interested in targeting these three tapestry profiles:
- City lights
- Laptops and lattes
- Enterprising professionals
We produced a map displaying where these 3 tapestry profiles are concentrated:
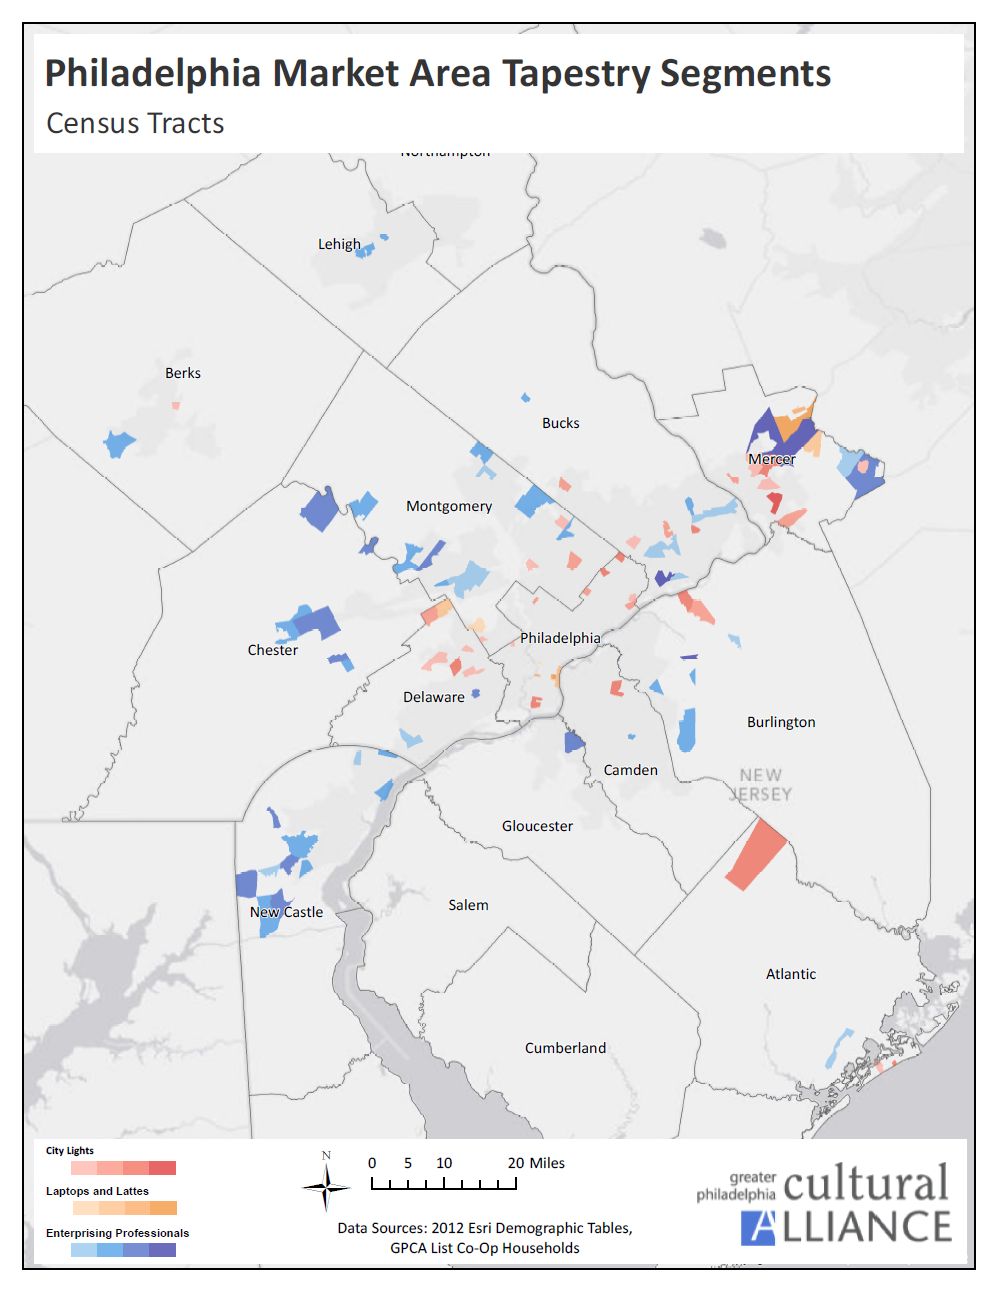
By knowing which census tracts have the most households of their target client profile, GPCA can focus their outreach efforts on specific neighborhoods.
But how do you know the right target profile for your outreach in the first place?
Penn Museum, for instance, was interested in learning the dominant tapestry segments for ZIP codes they’re already reaching.
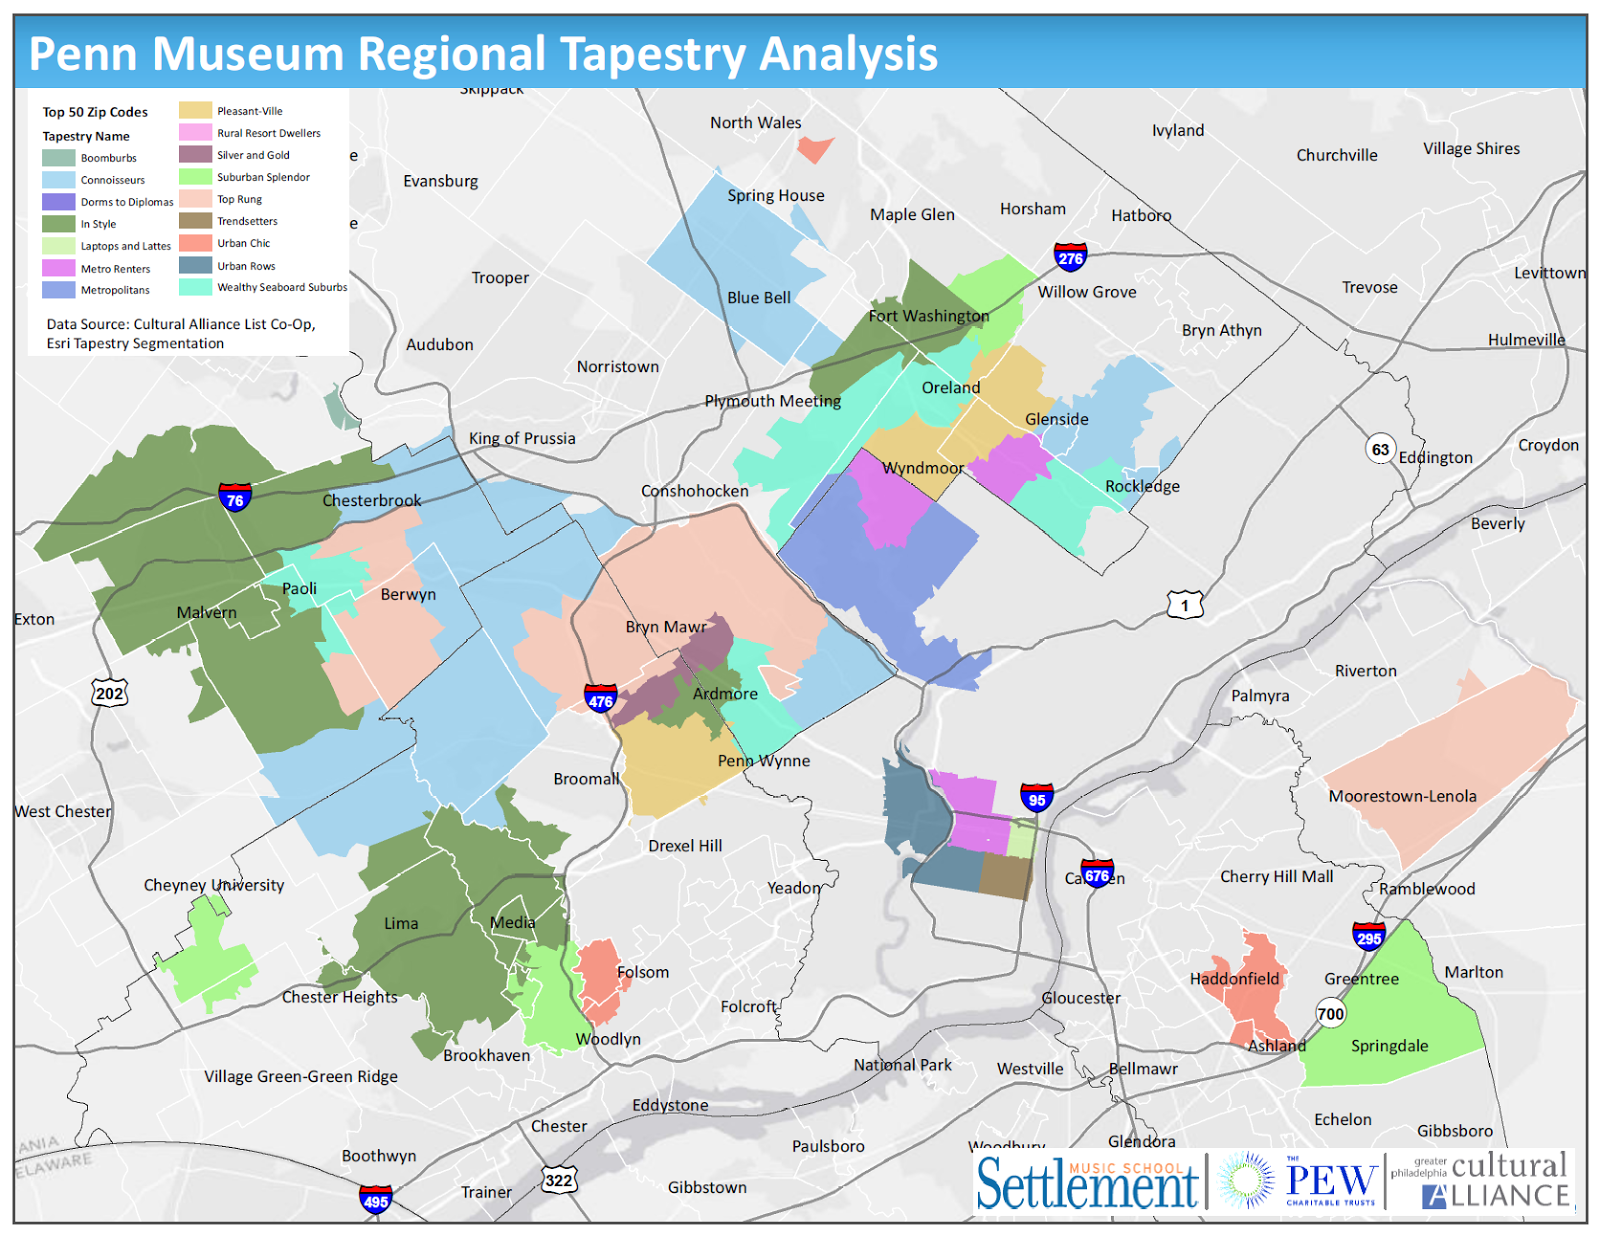
By matching where your current clients are to the dominant tapestry segments of those areas, you can begin to develop an ideal client profile. You can then use this persona to both target your marketing channels (i.e. where do most of your clients get their information about which museums to visit?) and tailor your messaging to this persona (i.e. what do your clients care about?).
Market Penetration Mapping
Market Penetration Mapping answers the question:
How many households that visited a museum visited my museum?
For example, we calculated the percent of all museum-going households in the Greater Philadelphia region who have visited the Philadelphia Museum of Art (PMA) and created a map of market penetration.
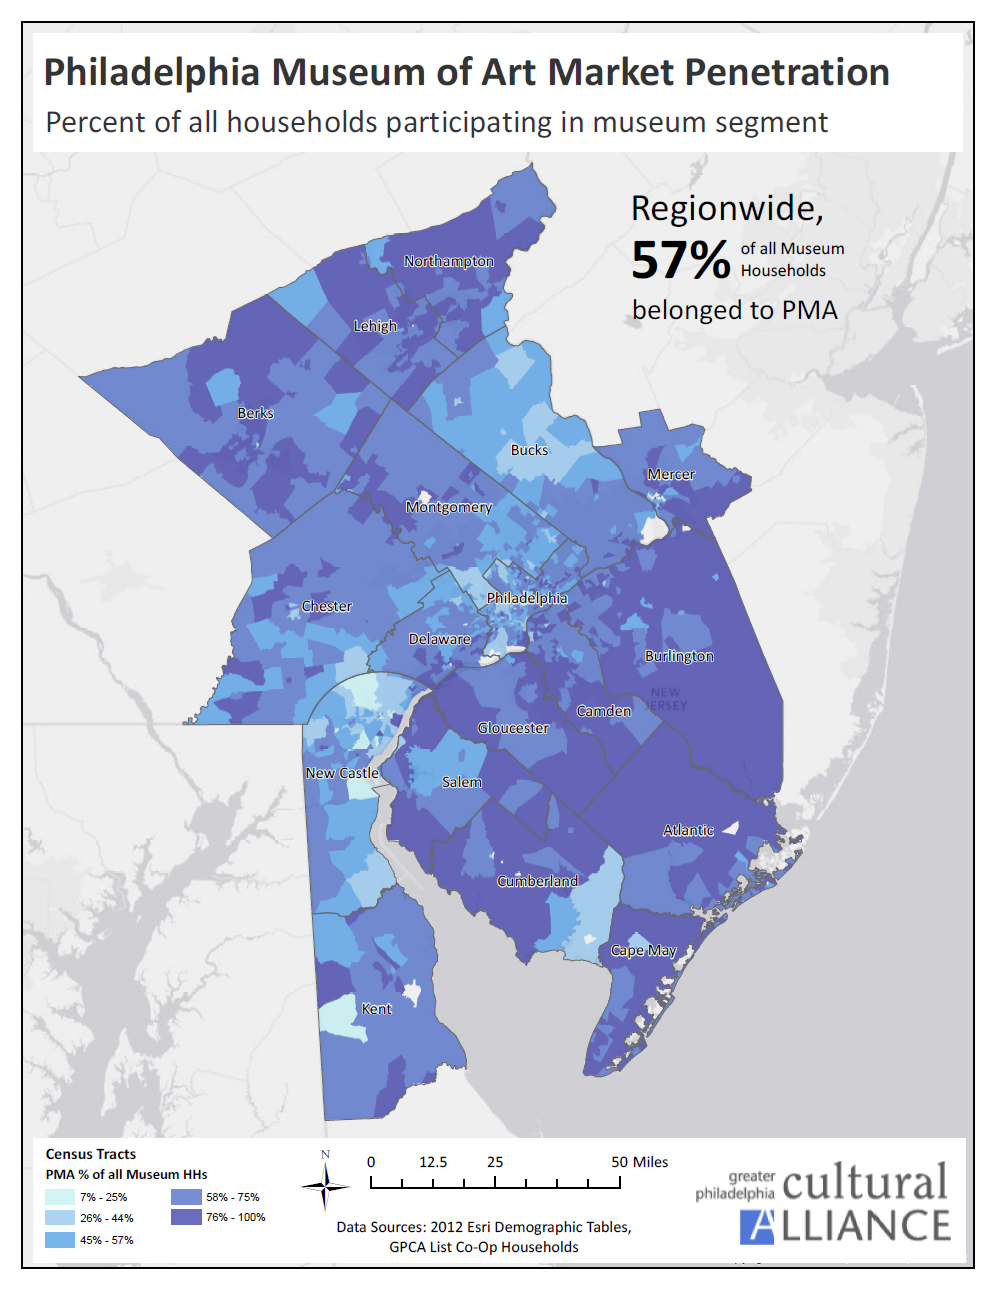
We found that PMA has a high market penetration rate of 57%, meaning 57% of all museum households in this region have visited PMA.
We also found that PMA showed a much lower penetration rate among museum-going households in Northern Delaware and Bucks County. With this insight, PMA can investigate why their reach is below average in these low-penetration areas and potentially target their outreach to these untapped areas.
On the flip side, we discovered that Southern Jersey had a very high-penetration rate. With this insight, PMA can focus on retention (i.e. increasing museum visits with existing patrons) in these high-penetration areas. In each case, PMA can tailor their outreach messaging based on whether they are communicating with low-penetration or high-penetration areas.
Single Ticket Buyers
We also produced a map of “Single Ticket Buyers” for Opera Philadelphia.
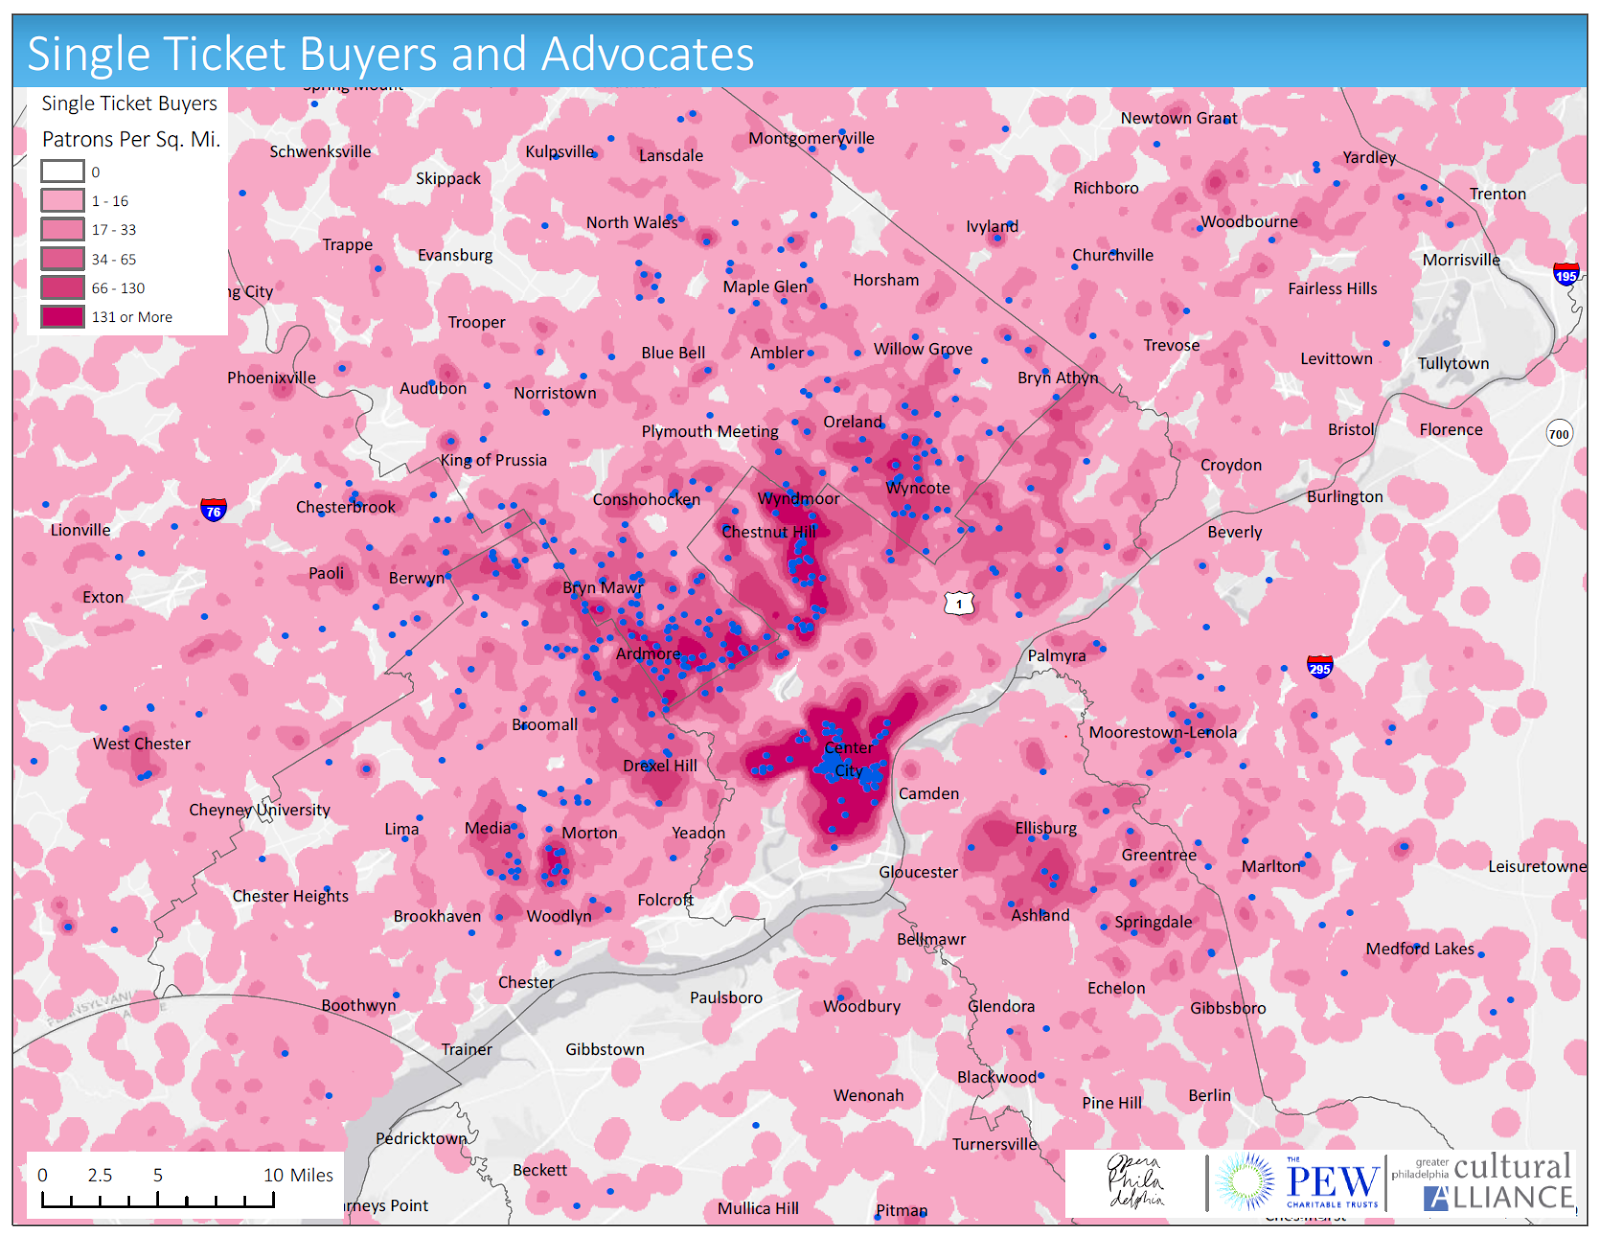
The map also marks “Advocates,” patrons who bought a whole program (multiple shows) or donate to the opera, in blue.
As you can see, Single Ticket Buyers and Advocates in the Greater Philadelphia Region are most concentrated in Center City.
Consumer Expenditure
Using tapestry segmentation data, we also produced a map of consumer expenditure data for the Opera of Philadelphia, who wanted to understand where people are spending more money on movies, theater, and opera compared to the national average.
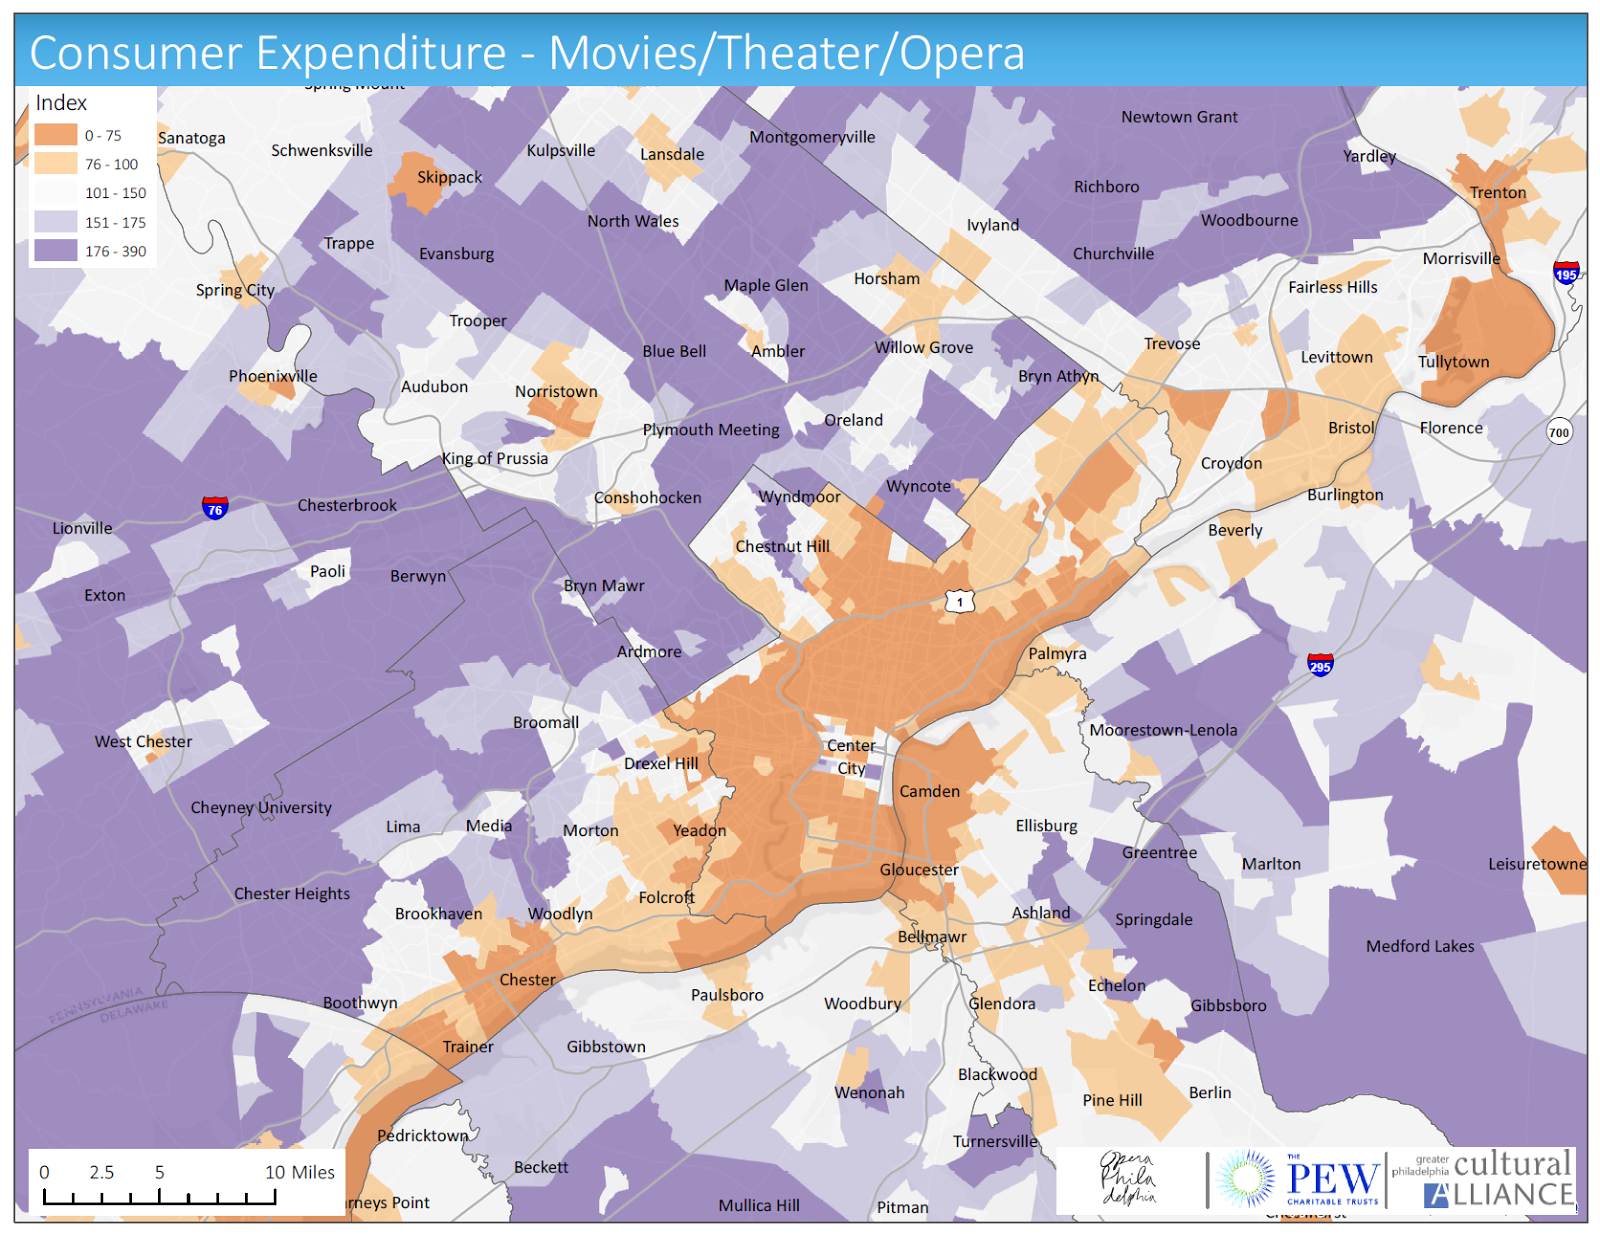
With this information on consumer behavior, the Opera can identify where to target their outreach.
Takeaways: Mapping Clients
By mapping your clients and donors, you can:
- Tailor your outreach campaigns to a specific client profile (using tapestries)
- Identify the location of your highest-value clients
- Identify where to target your outreach to acquire new clients and donors
Thanks so much for reading this post! We’ll see you for our next webinar short, where we cover accessibility mapping. Using our case study on Delaware DNREC (Department of Natural Resources and Environmental Control), we’ll help you answer the question:
“Who has access to our services and facilities, and how do we measure that?”
Action Checklist
- Want to learn more about how to become a data-driven nonprofit?
- Sign up to receive email notifications about things like future webinars and tutorials.
- Don’t know where to start? Check out Map Readiness
- Talk to us at analytics@azavea.com and we’ll help you develop or scope out some project ideas to make your organization more data-driven.
- Want to watch this case study video short on youtube?
- Access our webinar slides here: Data-Driven Advocacy Webinar 3 Slides
- Watch our webinar short here: Webinar Short Case Study 1
https://www.youtube.com/playlist?list=PL0avZRN-1JNlJNrkVwOS09KdIc8rXvxnG