
The COVID-19 pandemic has disrupted the lives of millions of people around the world. For many, public health policies intended to curb the spread of the virus have meant a lot more time at home. Those with internet access, digital devices, and flexible work and school options are spending more time online than ever before. While the past several decades have shown an increase of women in the workplace and equity among parental responsibilities, the COVID-19 pandemic has shed a light on the fact that women still carry the brunt of caretaking responsibilities as they have left the workplace disproportionately during the pandemic.
In service of its commitment to help organizations accelerate gender equality across the UN Sustainable Development Goal (SDG’s), Facebook conducted a survey in July 2020 to get a better understanding of how the pandemic has affected progress toward gender equality and to capture household gender dynamics around the world. The survey was designed in collaboration with the World Bank, UN Women, Equal Measures 2030, and Ladysmith, a feminist research consultancy.
The data collected from approximately half a million survey respondents has the potential to help researchers, nonprofits, development organizations, and advocates make progress toward gender equality around the world. But as we have learned, datasets are rarely actionable unless they are made easy to access through engaging visualizations.
Enter Azavea. We partnered with Facebook and Ladysmith to make an engaging platform that would do just that. You can view the platform now at www.equalityathome.org.
We talked to our partners at Facebook and Ladysmith to understand their motivations for creating this platform and its intended impact.
Why did we visualize the data in a custom platform?
Data sets, like the ones created from this behemoth of a survey, are not inherently useful for gender equality research or policy advocacy (source). A custom platform would make important data about gender equality more accessible to more people. Making these data and insights accessible and user-friendly means that nonprofits, researchers, and policy advocates do not need in-house expertise, nor do they need to hire data scientists that they cannot afford.
Facebook’s Project 17 initiative adopts a partnerships-first approach to accelerating progress on the SDGs, and so when the survey was complete, they went looking for a partner to create a custom platform for consuming the data. Azavea’s custom web application capabilities and commitment to advancing civic and social impact made us a good fit for this project.
Is the data easily accessible?
For Facebook and Ladysmith, it was particularly important that the survey results be displayed in a way that was easy for users to interact with. Our designer, Alex Lash, worked hard on this:
“A key challenge was accommodating newcomers to the site by making it easy for them to see chart data while ensuring that return visitors could easily access and customize what appears in their chart collections. We also made sure to consider different chart visualizations to best display the different results, which varied from parts-to-a-whole to Likert measurements.”
See for yourself in this walkthrough of the tool. The first screen of the application asks you to select a country or region. There are checkboxes for every country represented in the survey. Selecting multiple countries will result in comparative charts.

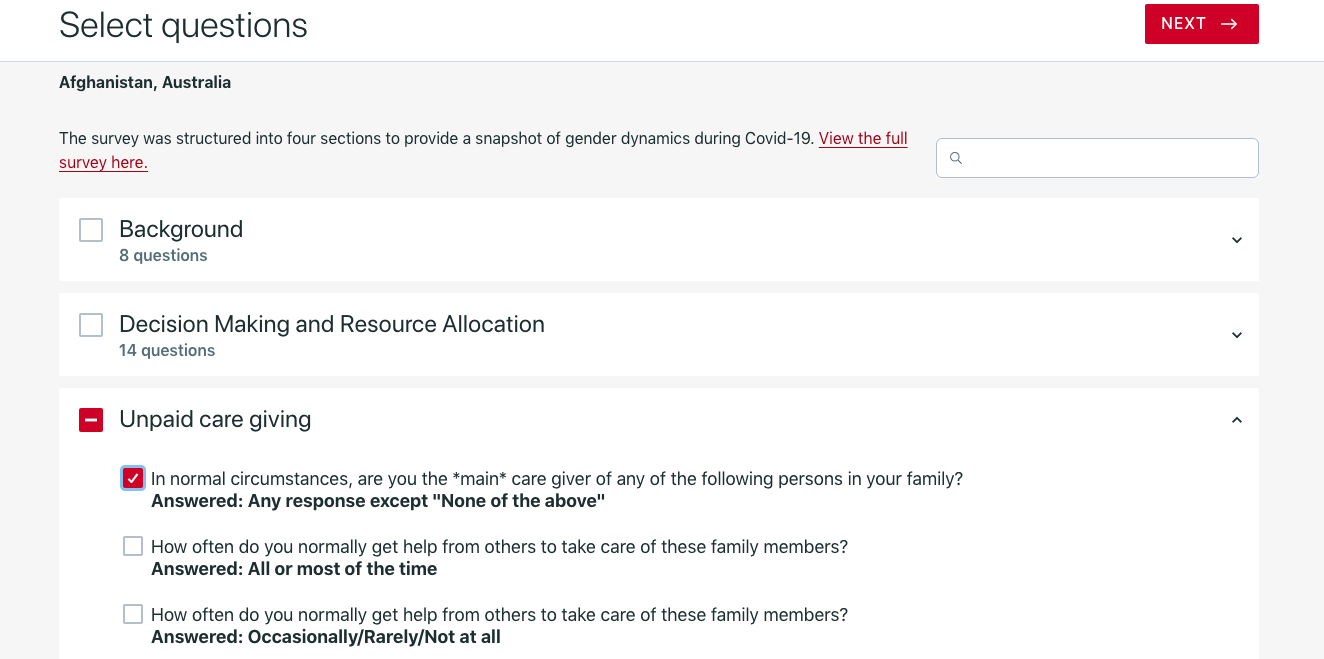
The second screen breaks out all of the survey questions into four categories: Background, Decision Making and Resource Allocation, Unpaid Caregiving, and Demographic Information. You can select any question individually or entire categories.
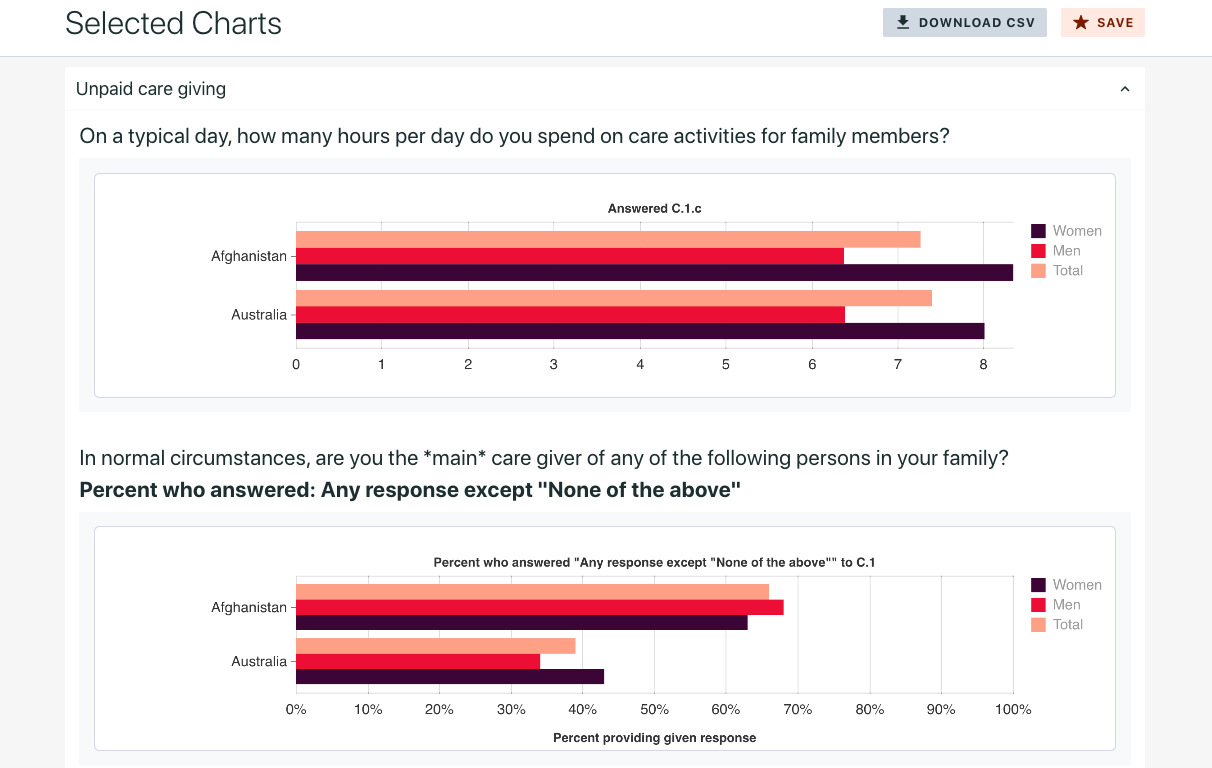
The final screen displays the selected data in colorful charts. Users can save these charts to a dashboard or download the data as CSVs.
Combining this non-traditional dataset with existing traditional gender data into a user-friendly platform makes this data actionable. By making this data accessible through a platform, it is easy for users to identify pathways for action on gender equality.
Who will use it?
Anyone and everyone who is interested in gender equality can glean insights from this platform. Ladysmith has particular hopes for researchers and practitioners:
“We hope that researchers and practitioners are able to explore and triangulate the data on the dashboard in ways that generate interesting and actionable insights for their own gender equality efforts. The platform is an exciting opportunity to explore a novel dataset which sheds light on the perspectives of almost half a million people in the online population several months into the Covid-19 pandemic.”
Tara Cookson, Co-Founder
What impact does this open source platform have?
The dashboard is live now and we hope to hear stories of impact as it gets used by researchers and informs policy decision makers around the world. But Tara at Ladysmith believes its impact is already felt:
“This platform is a great experiment in making gender data projects actionable. We know that tech companies are thinking about how to share their novel data sets in the service of the SDGs, and here we’re seeing an example of that intention being put into practice.”
Additionally, the code for the dashboard is open source. Collaboration is key to success for achieving all 17 SDG’s by 2030. And by open-sourcing the code for this dashboard, we’re making it easier for others to repurpose and improve on this custom tool. Check out the GitHub to start contributing: https://github.com/azavea/fb-gender-survey-dashboard
What future work is planned?
Even though the initial survey was conducted while everyone was at home during the COVID-19 pandemic potentially causing unusually high participation rates, these groups are hoping to conduct this survey annually, refreshing the data on the platform and continuing to make it available to any who finds it useful to their work.
Future development on the platform could include things like:
- Video tutorials
- Features to assess time series data
- Guiding questions for what a user might ask of the data
- User suggested features as we learn more about their needs and interests
As more people use the platform, we hope to learn more about how they’re engaging with it and using it to support their work. In the future, we’ll look to feature examples of research and insights produced by users of the tool. As Bronwen Raff, Partner and Program Manager at Facebook’s Project 17, says:
“This could help a casual user see concrete examples of how this data can be useful to understand and advance gender equality while providing researchers with a platform to share their research and insights.”
Check out the Gender Equality at Home platform to begin your own exploration of the data. And if you have large datasets you’re looking to visualize in a custom web application, contact us!