

Headwaters Economics has been working to reduce the impact of wildfires with the USDA Forest Service and other organizations for the last decade. In this time, they have collected tons of data about the causes, locations, and impacts of fires. In implementing successful mitigation plans, however, Headwaters notes that a key ingredient is stakeholder engagement with the data. “If you don’t have a way to make this data engaging and accessible, you are doing a disservice to society”, notes Patty Hernandez, Associate Director at Headwaters.
As a civilization, we have never had more data. Businesses, nonprofits, and governments collect inordinate amounts of data with the intention to spark progress. But as Hernandez notes, data needs to be accessible and understood by the audience to actually drive action. Good data visualization is the key to making information useful as “a good visualization tells a story, removing the noise from data and highlighting the useful information.” (“Data visualization beginner’s guide: a definition, examples, and learning resources”, Tableau, https://www.tableau.com/learn/articles/data-visualization.)
What practices lead to good data visualization? We’ll use the dashboard Azavea built for Headwaters Economics and the USDA Forest Service on Wildfire Risk to Communities to highlight best practices for nonprofit and government leaders when designing compelling data visualizations.
Get to know your users
At Azavea we believe that user research is key to designing both a product and a specific visualization that will speak to the intended audience. As a core part of our design process, we interview stakeholders to understand what information they are looking for and how they intend to use the data we will present. “Our visualizations that have had the biggest impact are the ones where we had a deep understanding of the users,” notes Jeff Frankl, a User Experience Designer at Azavea. “This research allows us to design an experience that is custom-fitted to the specific goals and priorities of the people who will use it.”
With Headwaters Economics, we had a partner who was equally committed to this user-centered design process. We worked with both their internal team as well as their external stakeholders (county land-use planners, state foresters, fire chiefs, USDA officials) to understand what data was most important to them in planning for wildfires. From these stakeholder interviews, the designers then designed the initial wireframes for the data visualizations.
Tell the story one page at a time
The beauty of data visualization is that it takes complex concepts, simplifies them, and lets the user focus on a manageable amount of content. This leads to effective storytelling. In the case of the Wildfire Risk application, there were many different factors to highlight. We wanted to show the likelihood of wildfires in an area, the risk to homes, exposure type, and statistics on the vulnerability of the population. Our early attempts (see below wireframe for Pittsburgh) tried to include all of this information. In user testing, we found that it was not effective, as it did not guide the user’s focus and it was not easy to digest.

We iterated on these designs, understanding the need to simplify the visual and just highlight one factor at a time. Instead of having a layered map where you could click on and off many factors, we decided on a simple tabular delineation at the top where you could click through the different factors in a linear fashion.

Prioritize visuals for your audience
Clients approach Azavea with large amounts of critical data that needs to be shared with their stakeholders in order to address complex issues such as reducing deforestation or tracking upstream threats to a county’s water source. At first glance the sheer amount of data is overwhelming. Another data visualization tactic we therefore employ is the prioritization of data visuals. By prioritizing the visuals you speak to the audience’s greatest interest first as a way to hook them in.
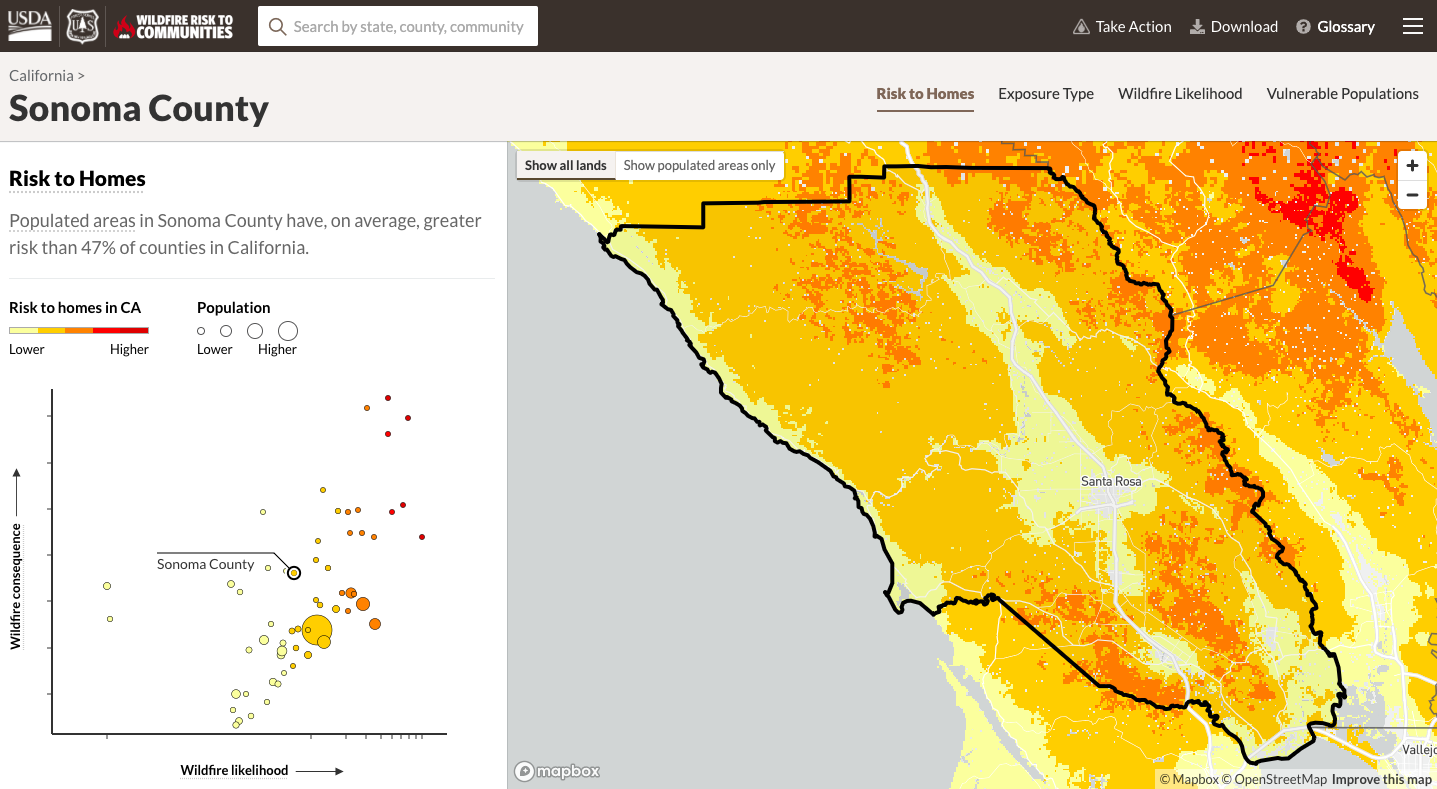
From the start, our partners at Headwaters Economics understood the need to prioritize the data they were sharing and joined us in stakeholder interviews to understand their audience’s interest. During the interviews, it became clear that the county officials were most interested in understanding the built environment and the risk that this built environment faced during wildfire season. This resulted in the first visualization on the Wildfire Risk platform, “Risk to Homes”. While this is not the only important visualization, it is first because it is what the audience cares most about.
Pick the right data visualization
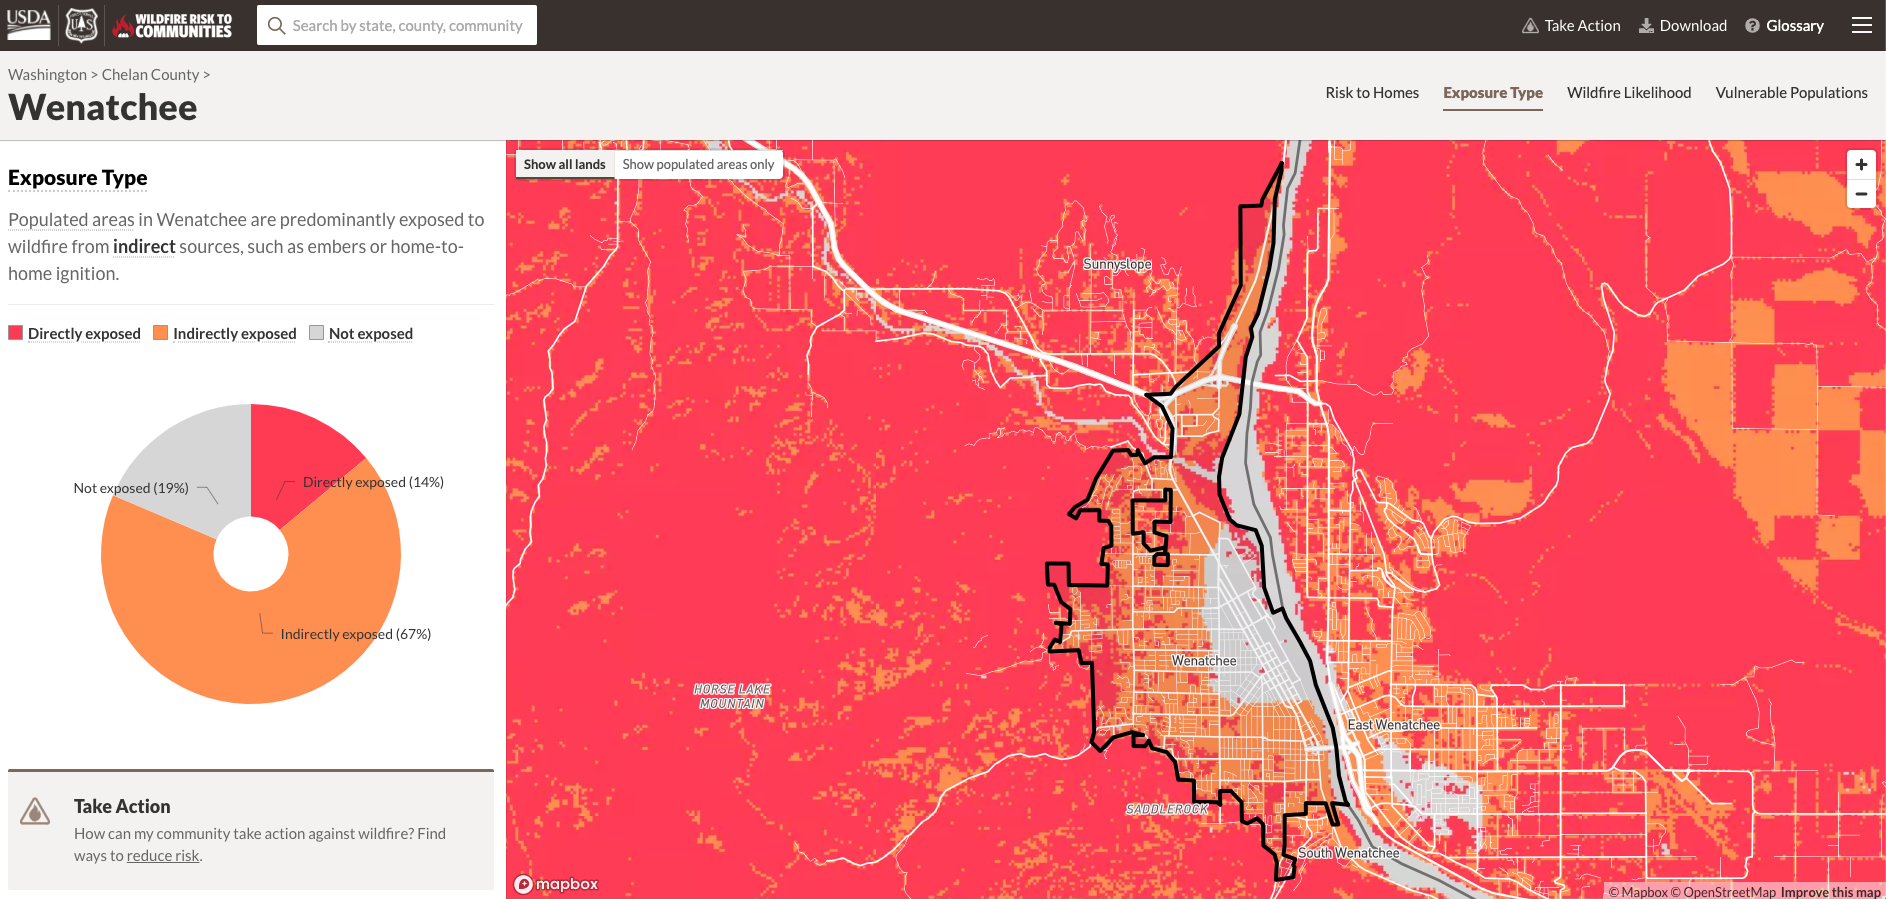
We love maps, don’t get us wrong, but maps are not always the best tool to depict the desired data. In the case of the Wildfire Risk dashboard, maps are used on the right side of the screen to show details while the left-hand side is used to convey a summary. For example in the Exposure Type tab (see below), a user could zoom in on their city to see the specific areas where the populated area is most exposed. While this might be most useful for the fire marshal, the government officials, on the other hand, can see the summary on the left side of the screen that compares the overall exposure types in the city. These different data visualizations are useful for different audiences using the platform.
Make the data personal
In the stakeholder interviews, the USDA Forest Service made it clear that their goal for the platform was to increase individual and communities’ understanding of wildfire risk in their own backyards. In designing the platform, we, therefore, wanted to make the visualizations personal. We could have started with a map of the US and allowed the user to zoom in from there, but that was going to make it difficult for the end-user to understand exactly what they were looking at. Instead, we chose to start with a search bar where the user could type in their own specific community. Wildfires are a deeply personal issue that affect homes, municipal buildings, community members, and local government decisions. By directly guiding the user to their specific locale, it allows the subsequent visualizations to be personalized to that person’s specific circumstances.

Data visualization best practices make a greater impact
By following these best practices and creating compelling visualizations for your data, you will effectively communicate this information to your intended audience. For organizations such as Headwaters Economics, the effective communication of important data is imperative to who they are as an organization, and the work they are aiming to accomplish.
“We have a moral responsibility to take what we have learned about wildfires and share it with the community so that we can be safer and live in communities that can survive wildfires. By working with Azavea we are able to bring in design and development skills that make this data engaging and understandable that otherwise wouldn’t be accessible.”
Patty Hernandez, Headwaters Economics
Looking to visualize your data in a custom dashboard? Let’s partner! Contact us to get started.