
With the 2018 U.S. midterm elections fast approaching, we thought we would share some interesting election related reading from around the web.
Building an election forecasting model
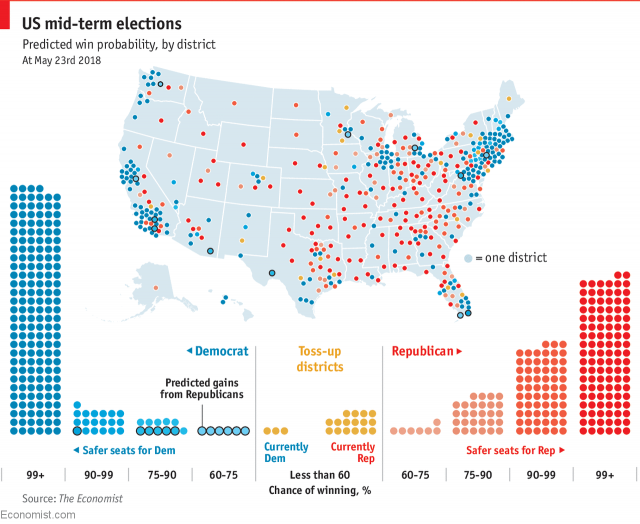
What factors go into building election forecasting models? For a given congressional race, how are local factors balanced against national political trends? This piece from The Economist explains how they built their forecasting model for the 2018 midterms and will have you happily dusting off your college stats textbook.
Viewing targeted campaign advertisements
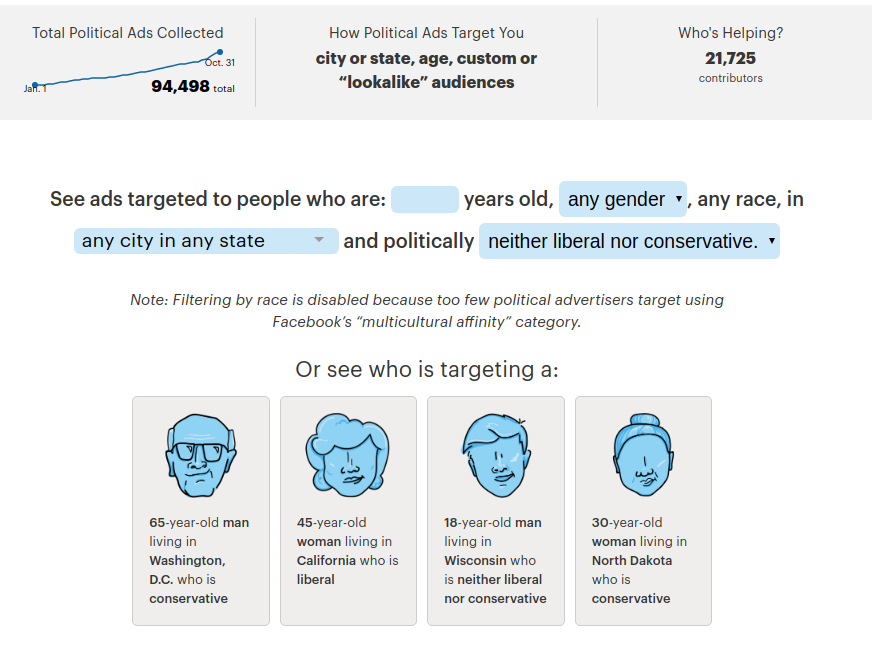
We know political ads on television try to target large audiences of likely voters during evening prime time programs and major sporting events, but how do advertisers target various groups of voters online where there is more flexibility? ProPublica, the nonprofit news organization, built a crowdsourced tool that lets you see which ads for the 2018 U.S. midterm elections are being shown to which Facebook users based on location and demographics:
Understanding why content is “Recommended for You”
Anybody who uses online platforms to consume news and topics of interest is accustomed to seeing recommendations from the platform about stories to read and other accounts to follow. This piece from Wired, the technology publication, details the common design principles of these features and what factors are used to determine which pages are suggested to you and why.
Thematic maps of the 2016 election
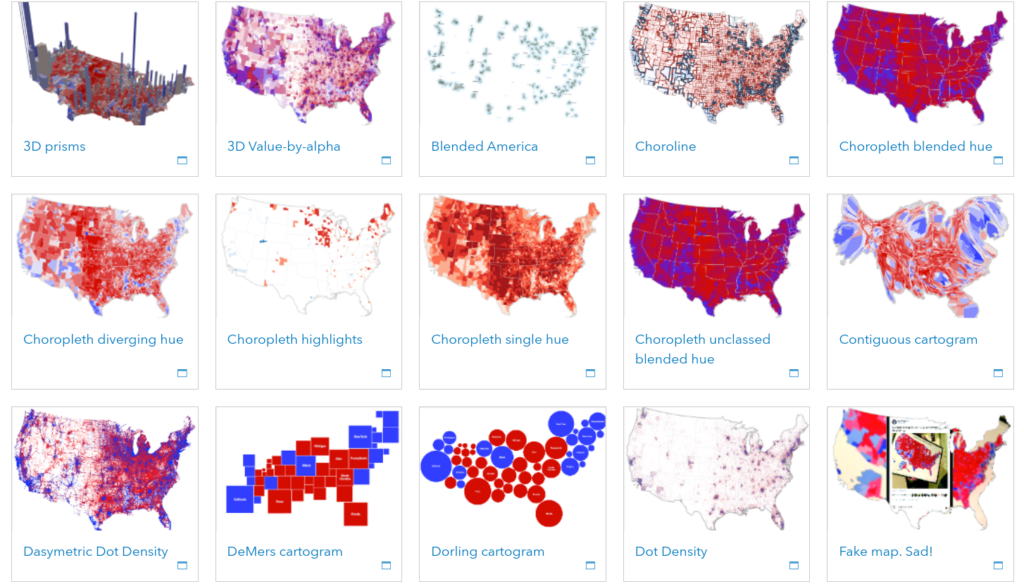
Here at Azavea, we love maps. Telling stories through maps is not always a bias-free process. Cartographers make many decisions when they present geographic information that influences how readers interpret a story. Here is a demonstration in 30 alternative presentations of the 2016 election results from Esri. Keep an eye out: you might see some similarly styled maps being released over the next few weeks.
Money in politics
Money in Politics has been a frequently discussed topic leading up to elections. Purchasing Power, a blog by the the Brennan Center for Justice at NYU Law School, continues the conversation with a collection of posts related to the influence money creates in the electoral process and public policy.

Some Azavea resources
Our mission at Azavea is to build geospatial products with a civic and social impact. We maintain a few election related apps and resources that you can learn more about below.
Get updated elected official information following the 2018 midterms
Azavea’s Cicero database will be updated to reflect new officials and their contact information following the closing of the polls and over the subsequent weeks as new officials take office. Get information here about how to access elected official and legislative district information.
Preview redistricted districts
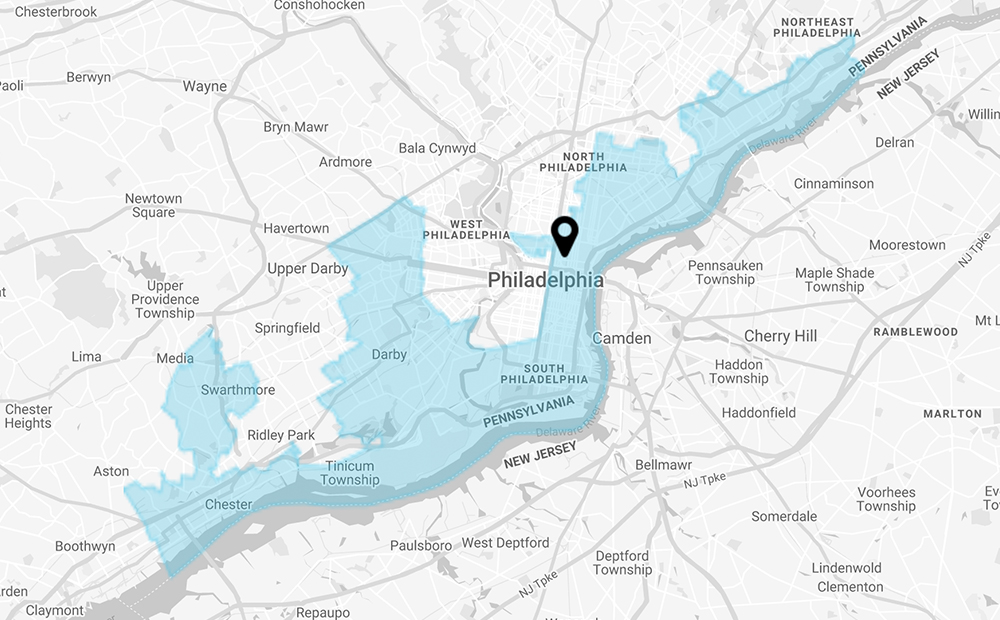
We have updated our free Officials & Districts tool to show future districts in areas where there is redistricting. For the 2018 midterm elections, this includes the US Congressional districts in Pennsylvania, state legislative districts in Alabama and North Carolina, and a slew of local city councils.
Engaging citizens in the redistricting process
As part of Azavea’s long history of building tools to make redistricting a more fair and democratic process, we recently released an updated edition of our open source software DistrictBuilder. Our friends at Draw the Lines PA are using this updated version to power a contest where the public is invited to redraw Pennsylvania’s Congressional districts. The contest runs now through December 14th. Click here to learn more about our research on redistricting.