The last 4 years have been a turbulent period in government in the United States at the local, state and federal levels. Recent trends such as highly contested primaries that displace incumbents, a wave of officials taking posts in the administration of President Donald Trump following the 2016 Election, and the #MeToo Movement have resulted in many officials leaving office before they have served their full term.
Several sources have documented this trend in Congress. FiveThirtyEight produced this infographic of resignations from Congress by term going back to 1901 using Congressional records, including canvassing each resignation to identify the reason. CNN produced this analysis of officials leaving Congress by term since 2006 by aggregating news sources, and showed that Republicans in the current Congress are leaving office early the most frequently of any subset in their analysis.
The Cicero team maintains a comprehensive database that tracks elected officials, legislative districts and contact/social media information for officials in all 50 states. In addition to US Congress, we also track state officials going back several elections cycles (and recently expanded to include officials in 300+ local jurisdictions representing over 84 million Americans). We decided to dig into state-by-state data to attempt to perform a deeper analysis of –roughly– how turbulent politics have been in recent years.
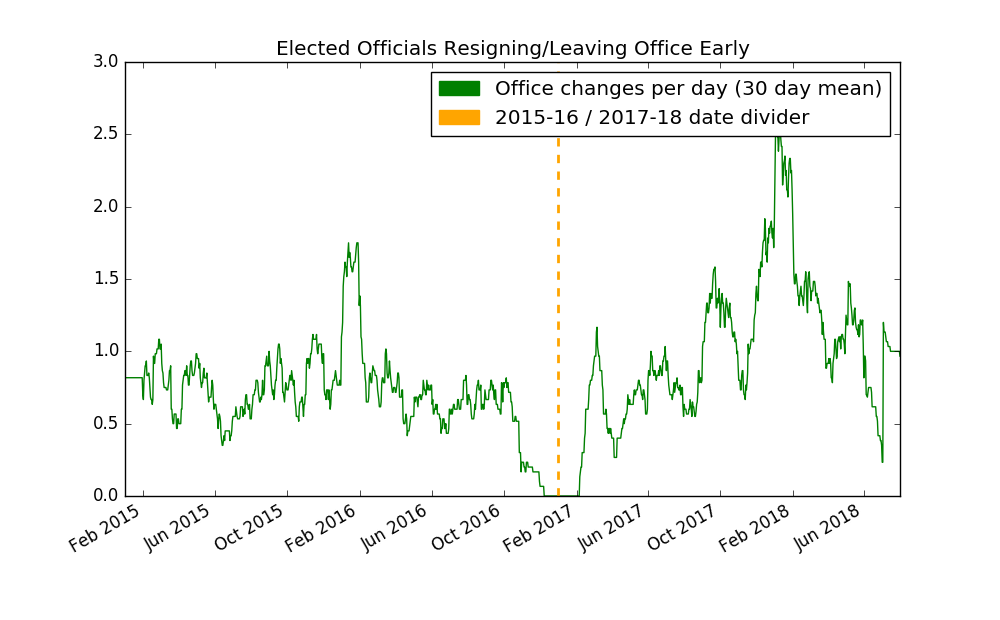
We compared 2015-2016 to 2017-2018 for officials in both houses of Congress, state governors and lieutenant governors, and members of upper and lower houses of state legislatures. We counted any instance where the officeholder changed outside of a normal transition after an election. This included both the beginning and end of a vacant period for a transitioning office. It’s important to note that we did not canvass records to determine the reason the officials left office early, and we did not include officials who retired or announced they will retire at the end of their elected term rather than seek reelection. We also did not include the transition period around the 2016 Election from November 1, 2016 to January 31, 2017.
Turbulence Over Time

From the time series plot above measuring officials leaving office per day (represented as the 30 day average on that day) we see more turnover in the later period following the 2016 Election. In particular we see a pronounced spike in February 2018. While the Cicero database does not track the reason each official left office early, this plot supports that the high-volatility trends observed in Congress are also occurring at the state level.
Officials Resigning or Leaving Office Before and After the 2016 Election
We performed a further breakdown of Cicero data for officials leaving office outside the normal election cycle to display changes in turbulence from 2015-2016 to 2017-2018 by state. You may click on column headings in the table below to sort the data in ascending and descending order.
Visualizing Flow in Politics
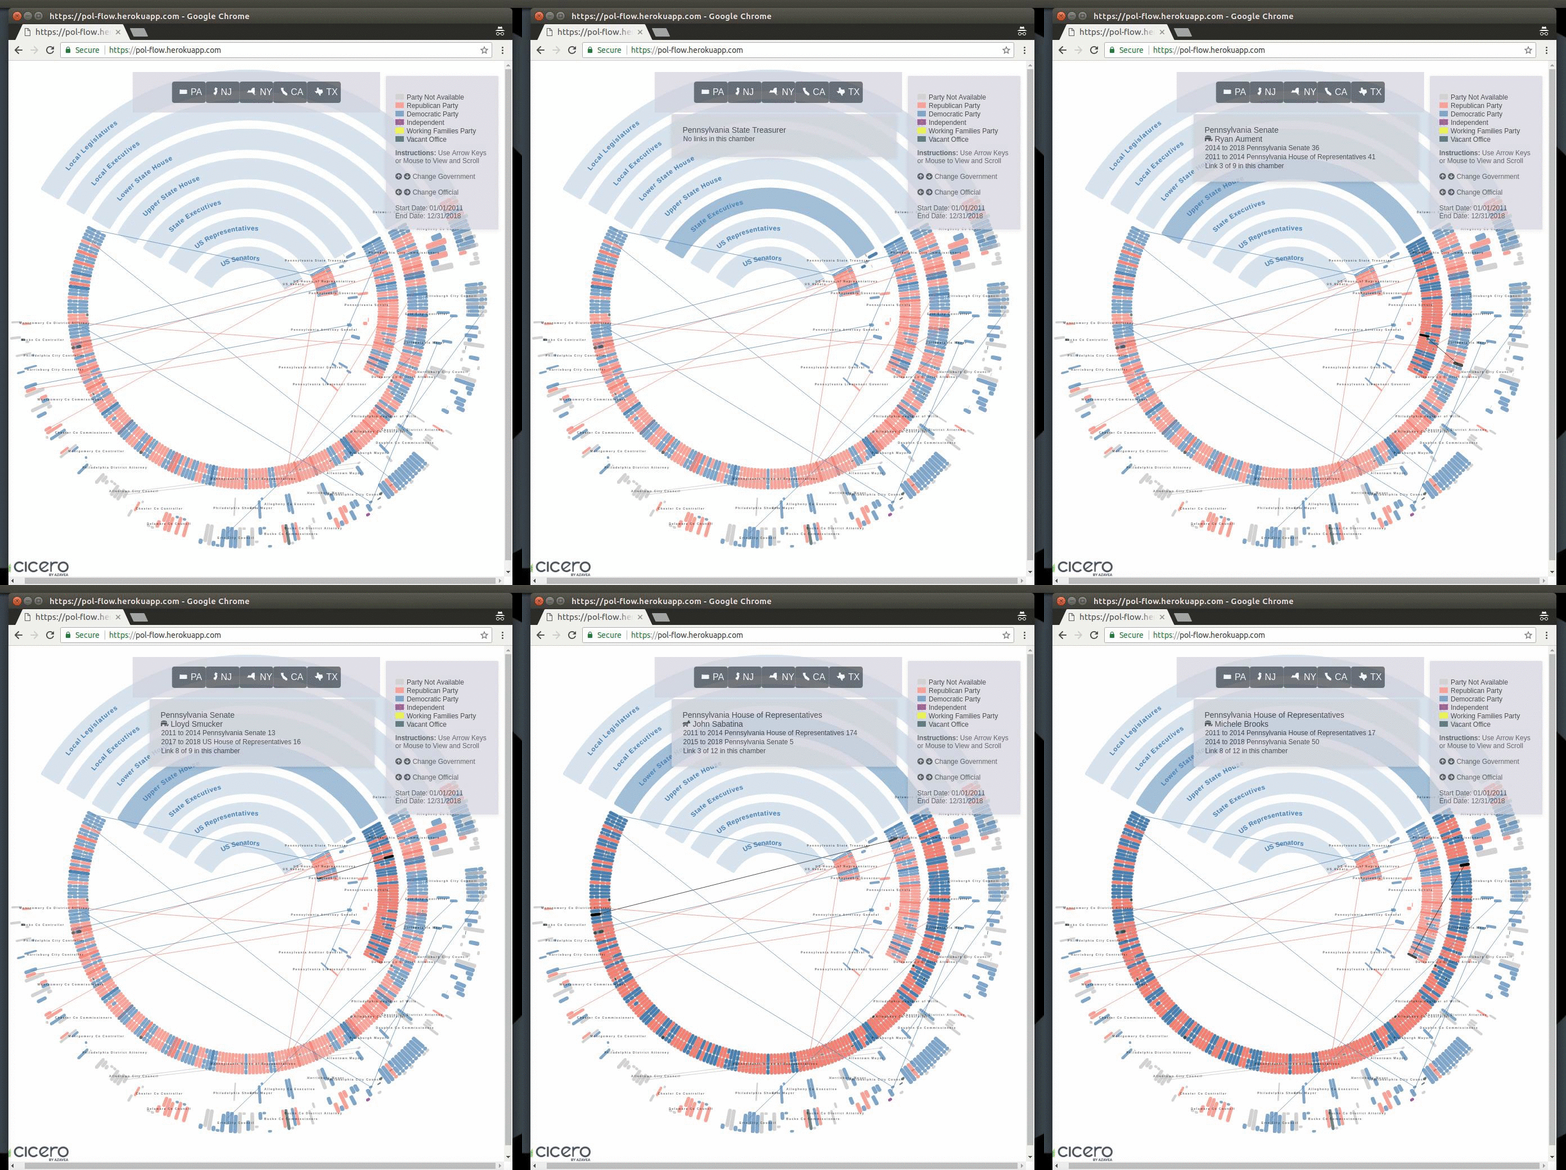
We also decided to use Cicero data to look at how politicians move from one elected office to another over the course of their career. Many officials first serve in local government before running for office at the state or national scale, which is represented by a link drawn between chambers and levels of government in the graphic below. Click here for the interactive version of this graphic, which is drawn from a small slice of Cicero data from January 1, 2011 to the present in five example states: Pennsylvania, New Jersey, New York, California and Texas.

Click Here to View Interactive Graphic
How to Get More Information
Interested in using this data to do your own analysis or create a visualization? Contact Azavea’s Cicero team to learn more and get started, or explore the database here.
Are you looking for Data Analytics or Software Engineering? Click to learn more about Azavea’s professional services.
