
This post is part of a series of articles written by 2017 Summer of Maps Fellows. Azavea’s Summer of Maps Fellowship Program is run by the Data Analytics team and provides impactful Data Analysis Services Grants for nonprofits and mentoring expertise to fellows. To see more blog posts about Summer of Maps, click here …
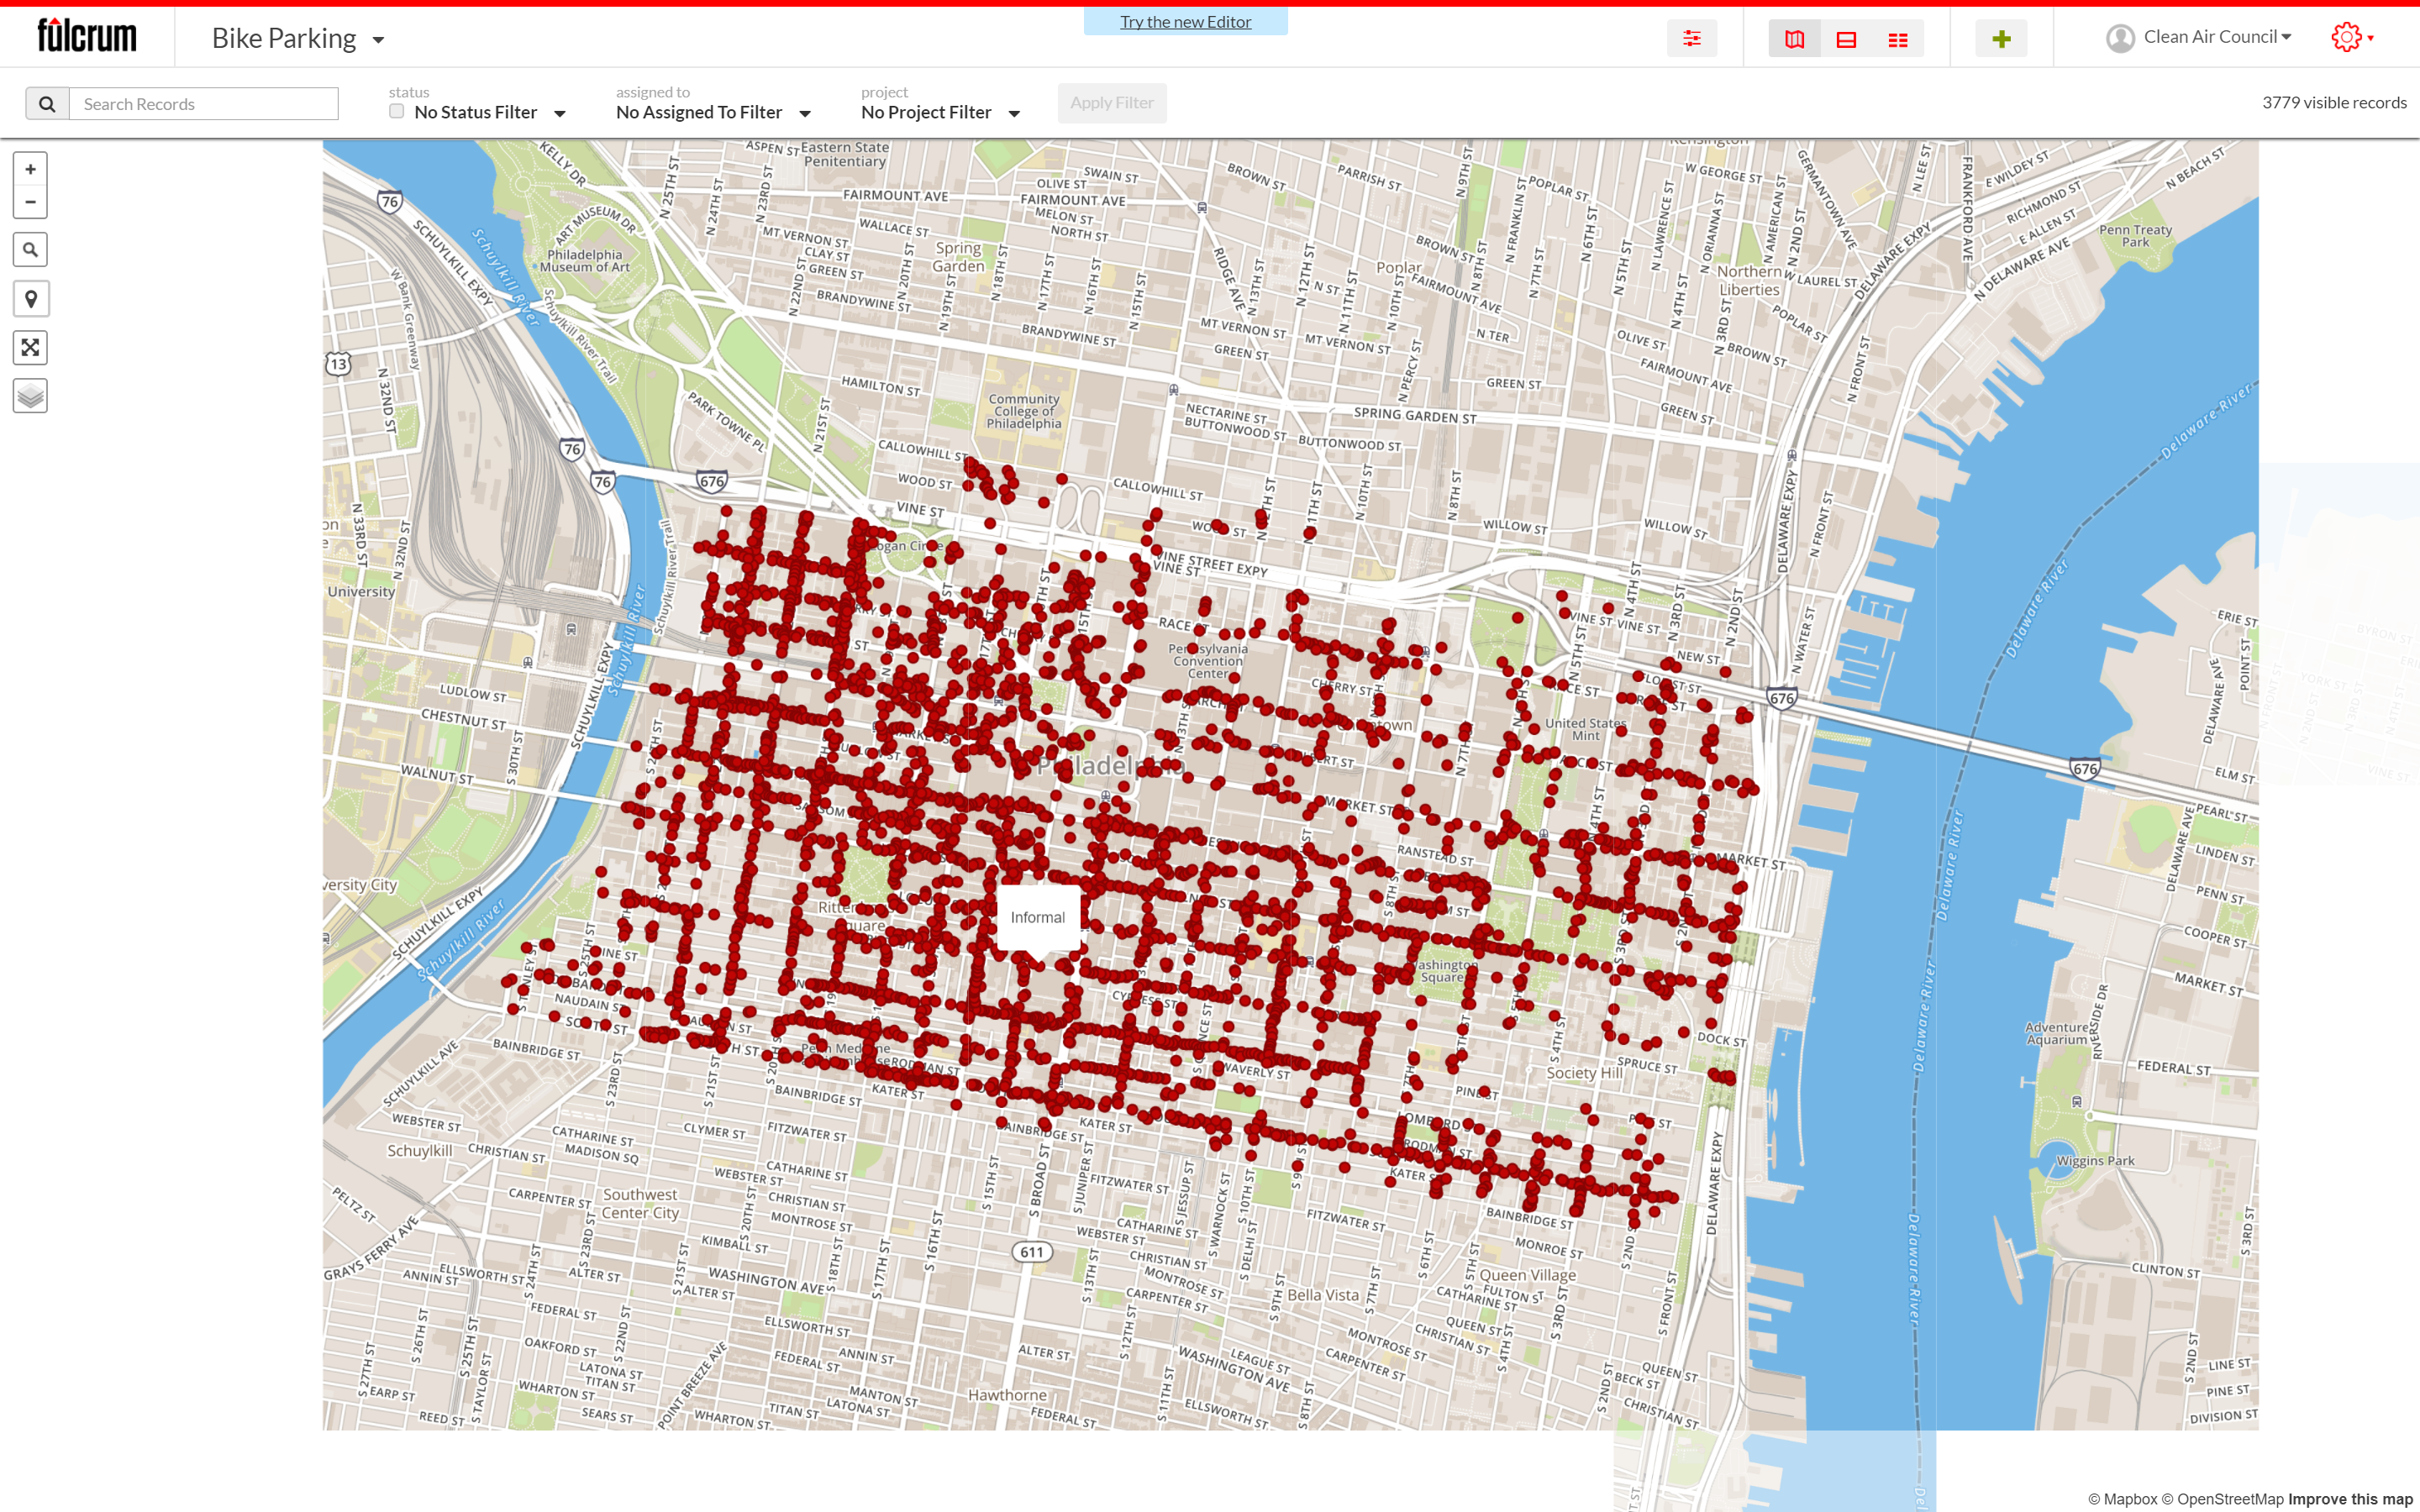
One of the Summer of Maps projects I’ve been working on is The Prediction of Bike Parking Demand in Center City Philadelphia. To predict for bike parking, we first need to know the current parking demand. Since there is no up-to-date bike parking data online, our client, Clean Air Council initiated a crowdsourcing effort to collect bike parking data through a data collection app called Fulcrum.
Using Fulcrum for Data Collection
Fulcrum App is a web and mobile application for onsite data collection. It is very fast and user friendly. In just 3 days, 12 volunteers were able to collect nearly 4000 records.
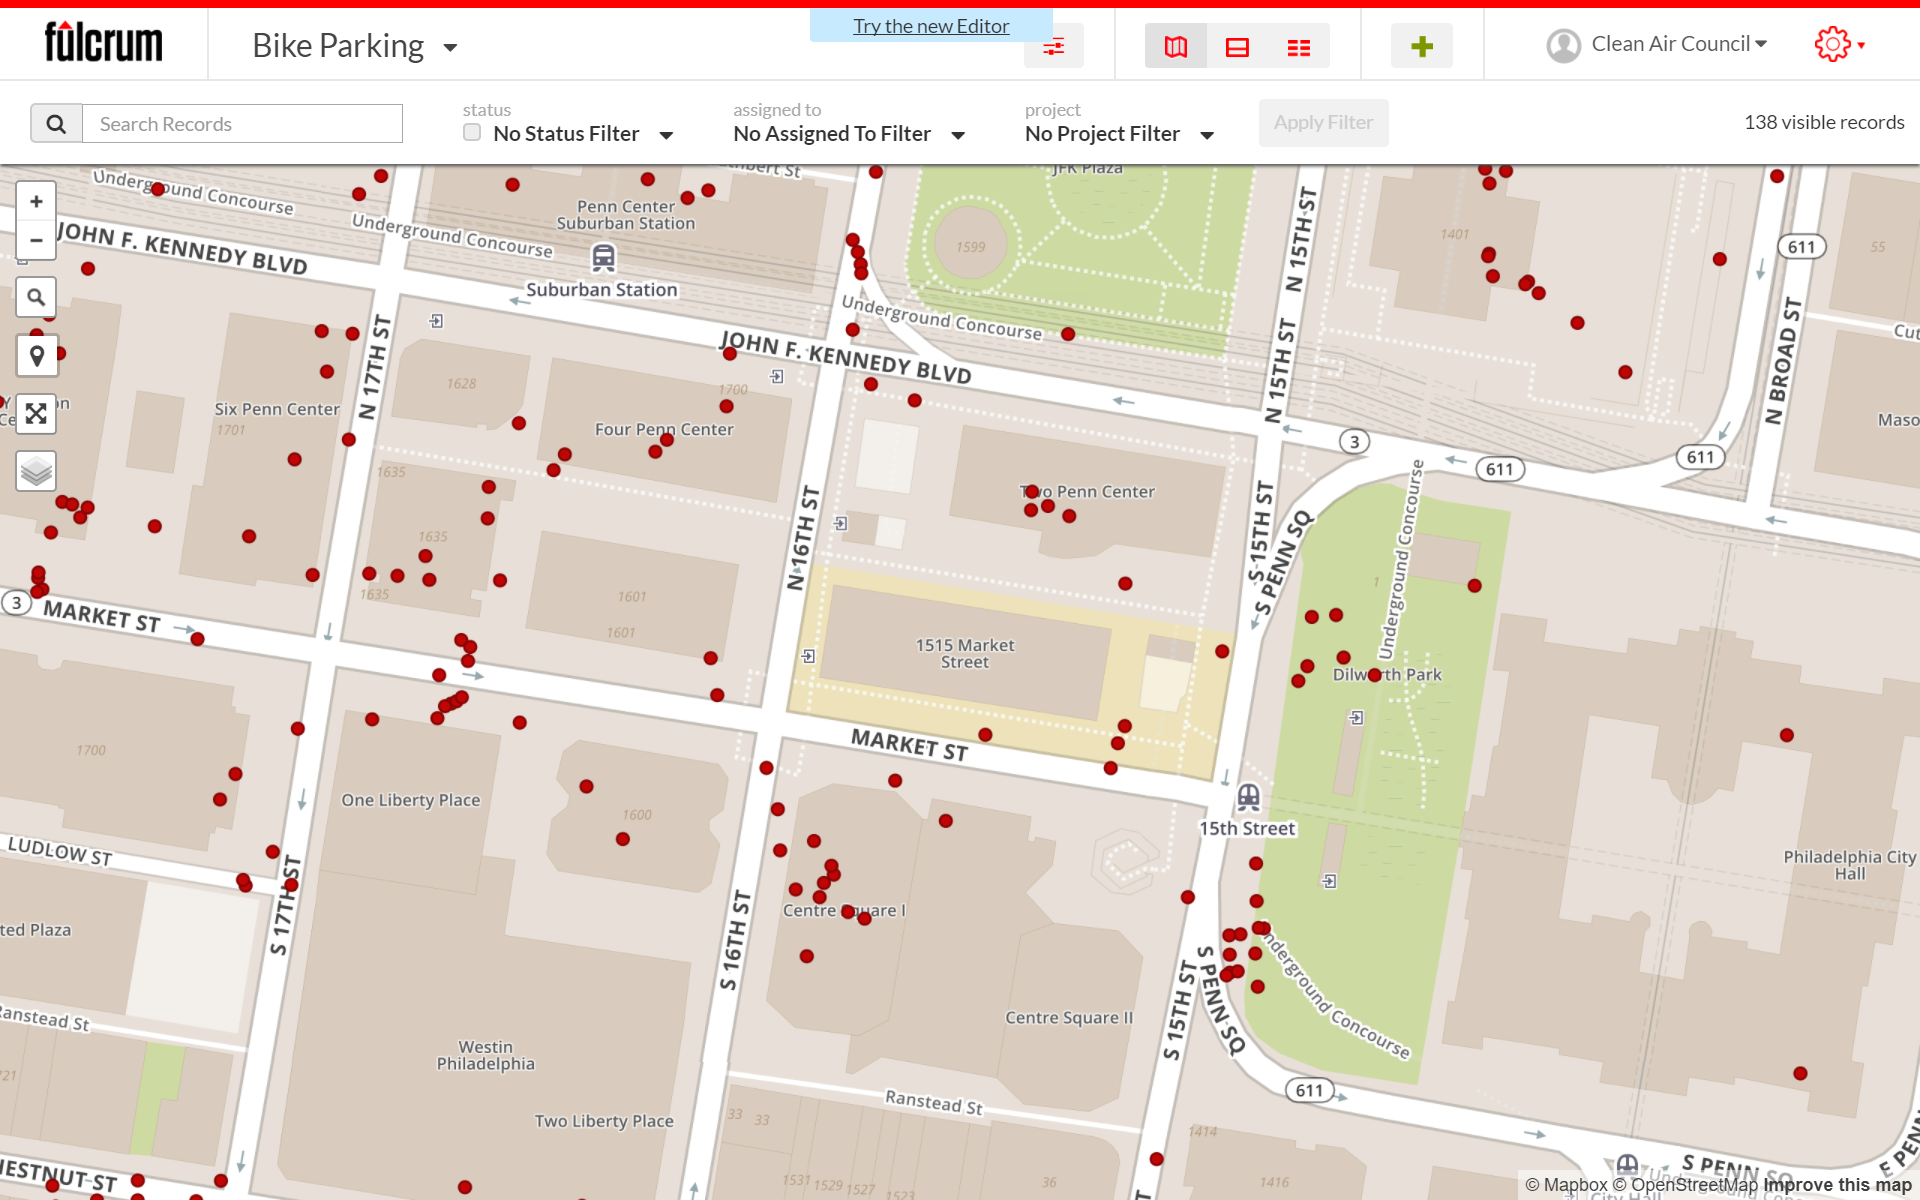
Despite its ease of use, Fulcrum’s major limitation for collecting spatial data is that different mobile devices capture GPS differently. This causes location inaccuracy, as demonstrated by Figure 2. How can bike racks be located on top of buildings? This inaccuracy made it difficult for me as a geospatial analyst to work with the data.
Different Approaches to Aggregate Data
The raw coordinate point data had too much noise. Therefore, I needed to aggregate them in some way such that I can bind each point with a unit of analysis. There are many ways to aggregate point data, and these can depend on what the goal of your project is. I considered four options to make sense of this bike parking dataset:
1. Aggregate to street segment
The points will be aggregated to their nearest street segment. In this way, the bike parking demand prediction will be as precise as street segments.
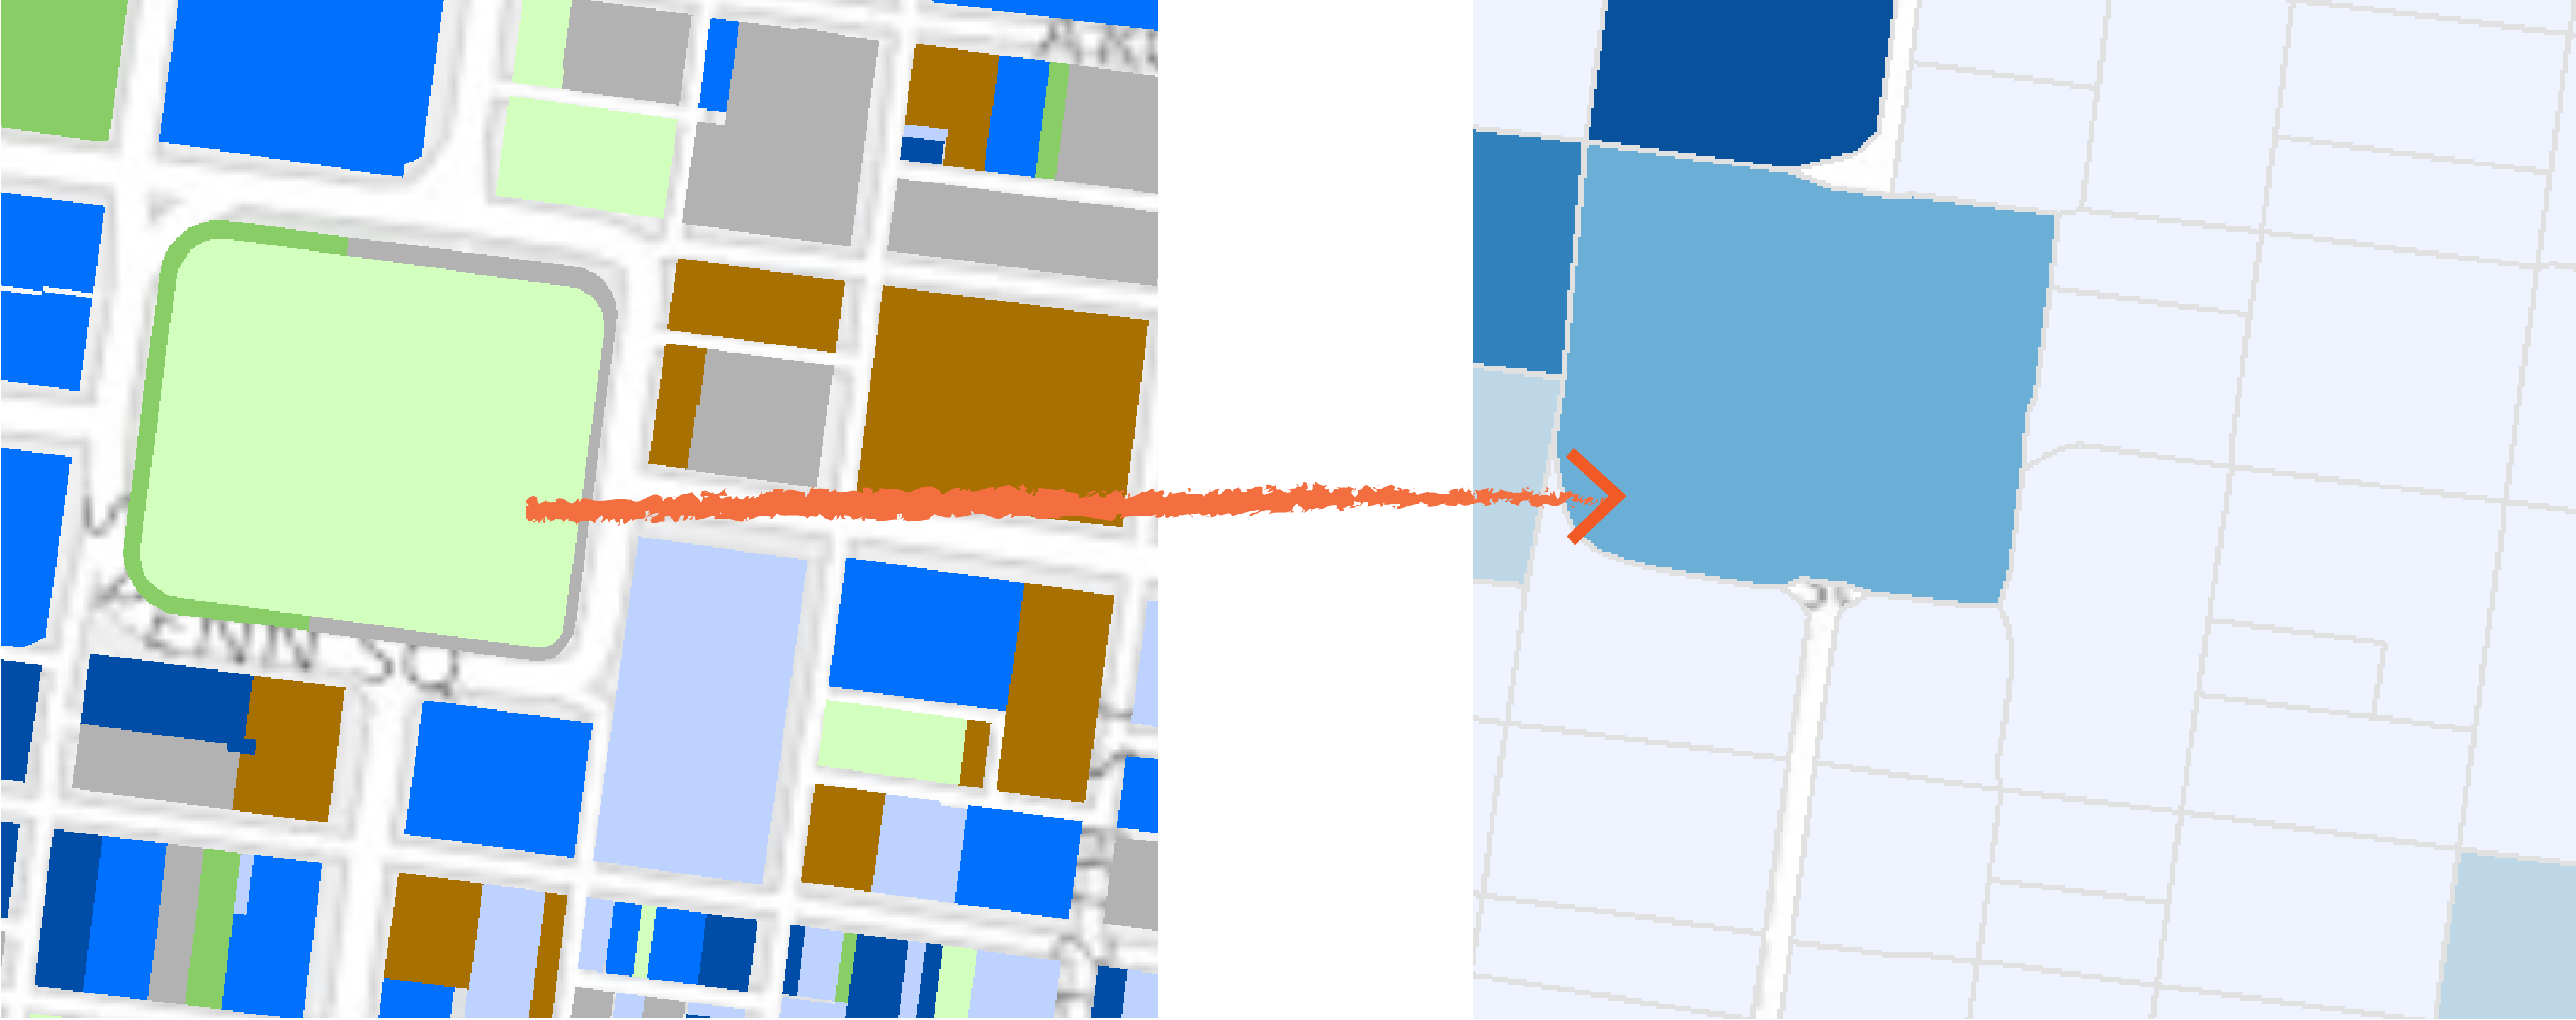
2. Aggregate to block
The points will be aggregated to the blocks they locate within. In this way, the bike parking demand prediction will be as precise as blocks.
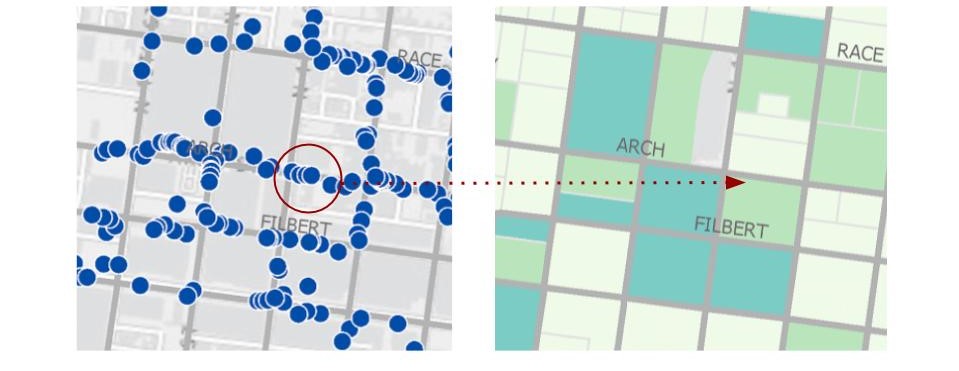
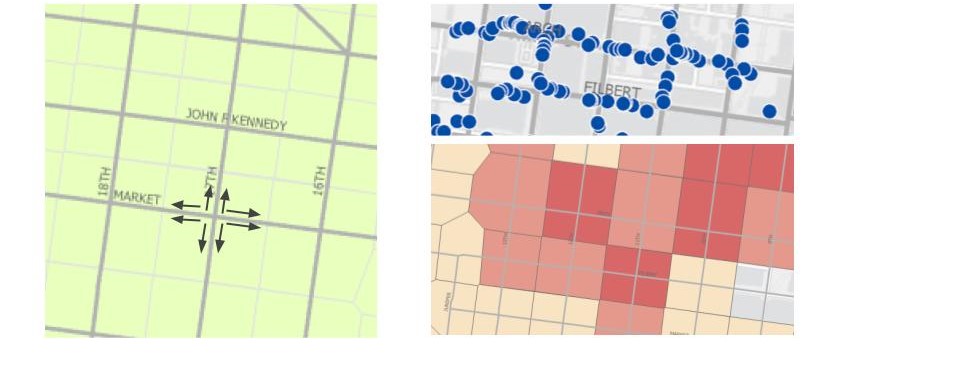
3. Aggregate to Thiessen (Voronoi) polygon
Thiessen polygons are created such that each polygon center is at a street intersection. This matches people’s bike rack searching method – looking at all four directions to find parking. In Thiessen (Voronoi) polygon aggregation, the bike parking demand prediction will be a prediction for each block, but centered at each intersection.
4. Aggregate to fishnet polygon
In the fishnet polygon aggregation, the block is divided evenly to small squares. The bike parking demand prediction will be a prediction for each of them. The gif (figure 3) shows a comparison among all four aggregation approaches.
Comparison between four aggregation approaches
1. Points to Street Segments
Pros:
- Since most of the points are along the streets, it makes sense to aggregate them to streets.
- Since each street has a unique identifier, it is easy to make reference and connect with other datasets.
- The street segments, which are no more than one block long, are around the appropriate precision for this study.
Cons:
- Creates aggregation inaccuracy when working with points in the middle of a block.
- Since this project is to study how employment and land use affect bike parking demand, there needs to be aggregations of those data as well. However, it is difficult to aggregate them to streets. For example, the land use data, which contains lots of polygons, can be difficult to split and to evenly aggregate to each street segment.
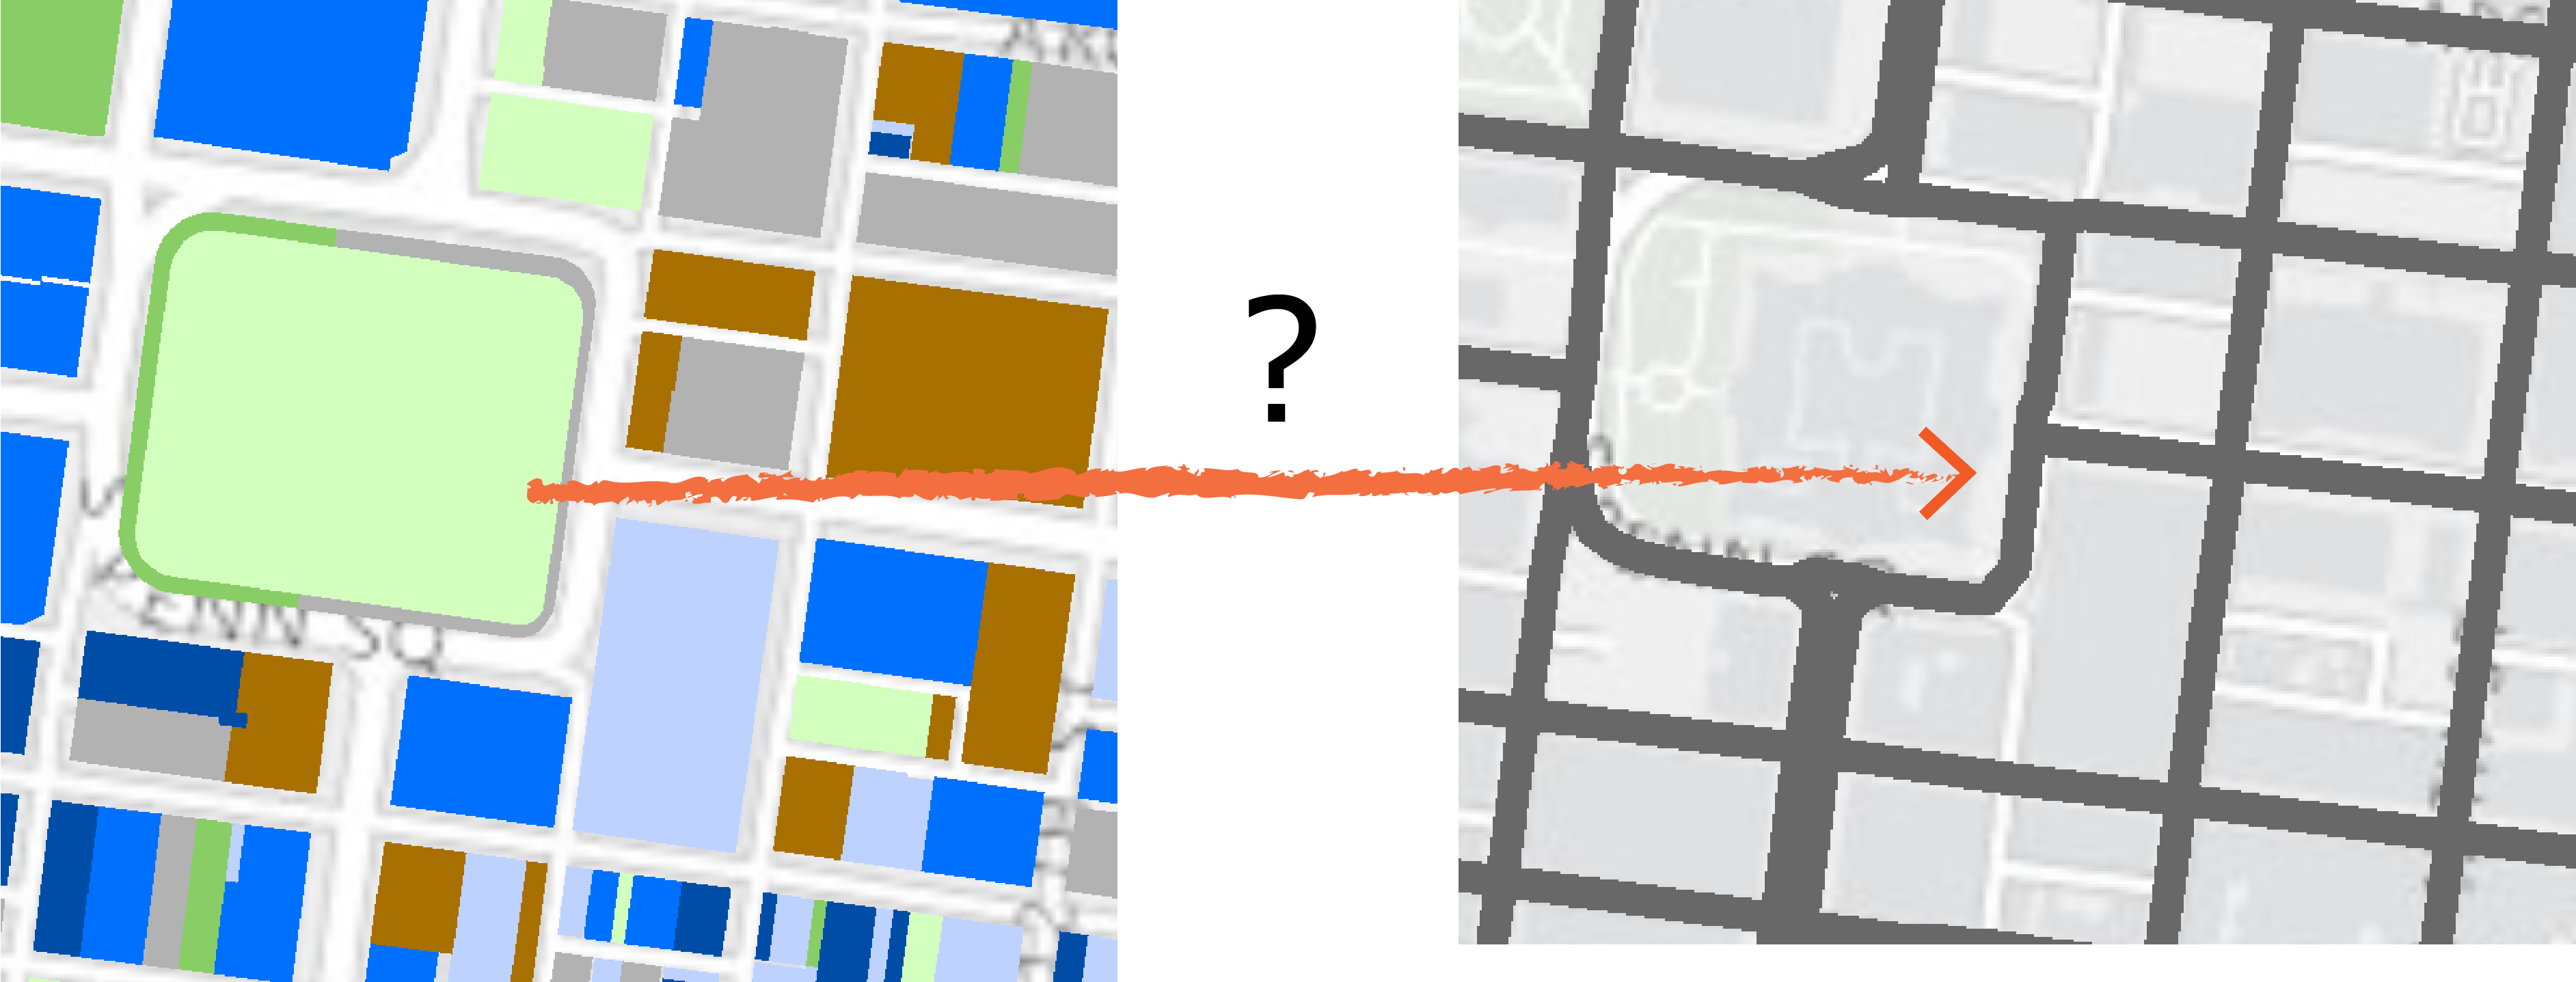
2. Points to Blocks
Pros:
- Similar to streets, blocks also have unique identifiers.
- Blocks can work with other data easily. (Figure 6)
Cons:
- Causes aggregation inaccuracy when points are along the edges between two blocks.
3. Points to Thiessen (Voronoi) Polygons
Pro:
- A unique way to aggregate bike racks based on intersection.
Con:
- Unlike streets or blocks, there is no unique identifier for the Thiessen polygons that can be easily translated into different datasets. Therefore, it would be hard to make reference to when linking with other datasets.
- The Thiessen polygon only works well with grid streets. When encountering organically shaped blocks, Thiessen polygons no longer work well.
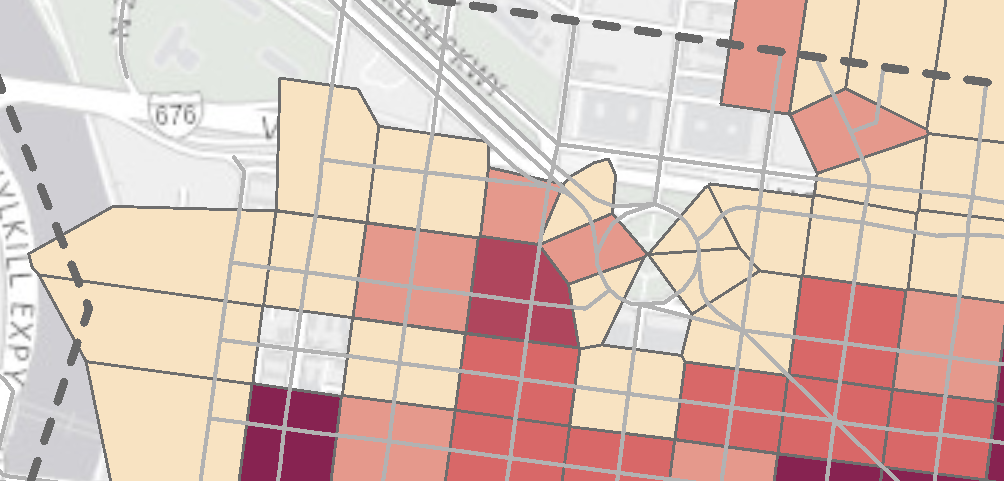
4. Points to Fishnet Polygons
Pro:
- Since you can adjust the fishnet polygon size, you can choose to make your analysis as precise as you need to.
Cons:
- Depending on the resolution you choose, the fishnet polygon will provide different results. In this example, I chose 100ft polygon size. This results in lots of zeros for areas that are not applicable for bike parking, such as area for buildings. The zero values may skew the prediction, unless you remove the polygons on top of buildings.
- Similar with Thiessen polygons, the fishnet polygons cannot be easily cross referenced by other datasets. However, since fishnet polygons can get very precise, people can treat it as raster data.
Conclusion
After comparing all aggregation approaches, I chose block aggregation for my project, because being able to work easily with other datasets is a crucial advantage. Comparing to other aggregation methods, aggregating to blocks ended up minimizing aggregation error and led to a more accurate model. However, the preference varies based on your need. I hope that this blog can give you a wide presentation of all the possible aggregation approaches.
Participate in Summer of Maps
Are you a student that’s looking to grow professionally in a GIS analytics career? Do you want to develop spatial analysis skills in a hands-on learning environment?
Keep an eye out for open application dates later this fall and reach out to us with questions about the program!