
This post is part of a series of articles written by 2017 Summer of Maps Fellows. Azavea’s Summer of Maps Fellowship Program is run by the Data Analytics team and provides impactful Data Analysis Services Grants for nonprofits and mentoring expertise to fellows. To see more blog posts about Summer of Maps, click here …
This summer I worked with the Fair Tech Collective to investigate petrochemical pollution in the San Francisco Bay Area. There are five major petrochemical refineries in this area, spread across the communities of Richmond, Rodeo, Martinez, and Benicia. Each year these refineries emit enormous amounts of air toxins. These toxins have adverse effects on air quality, the environment, and human health.
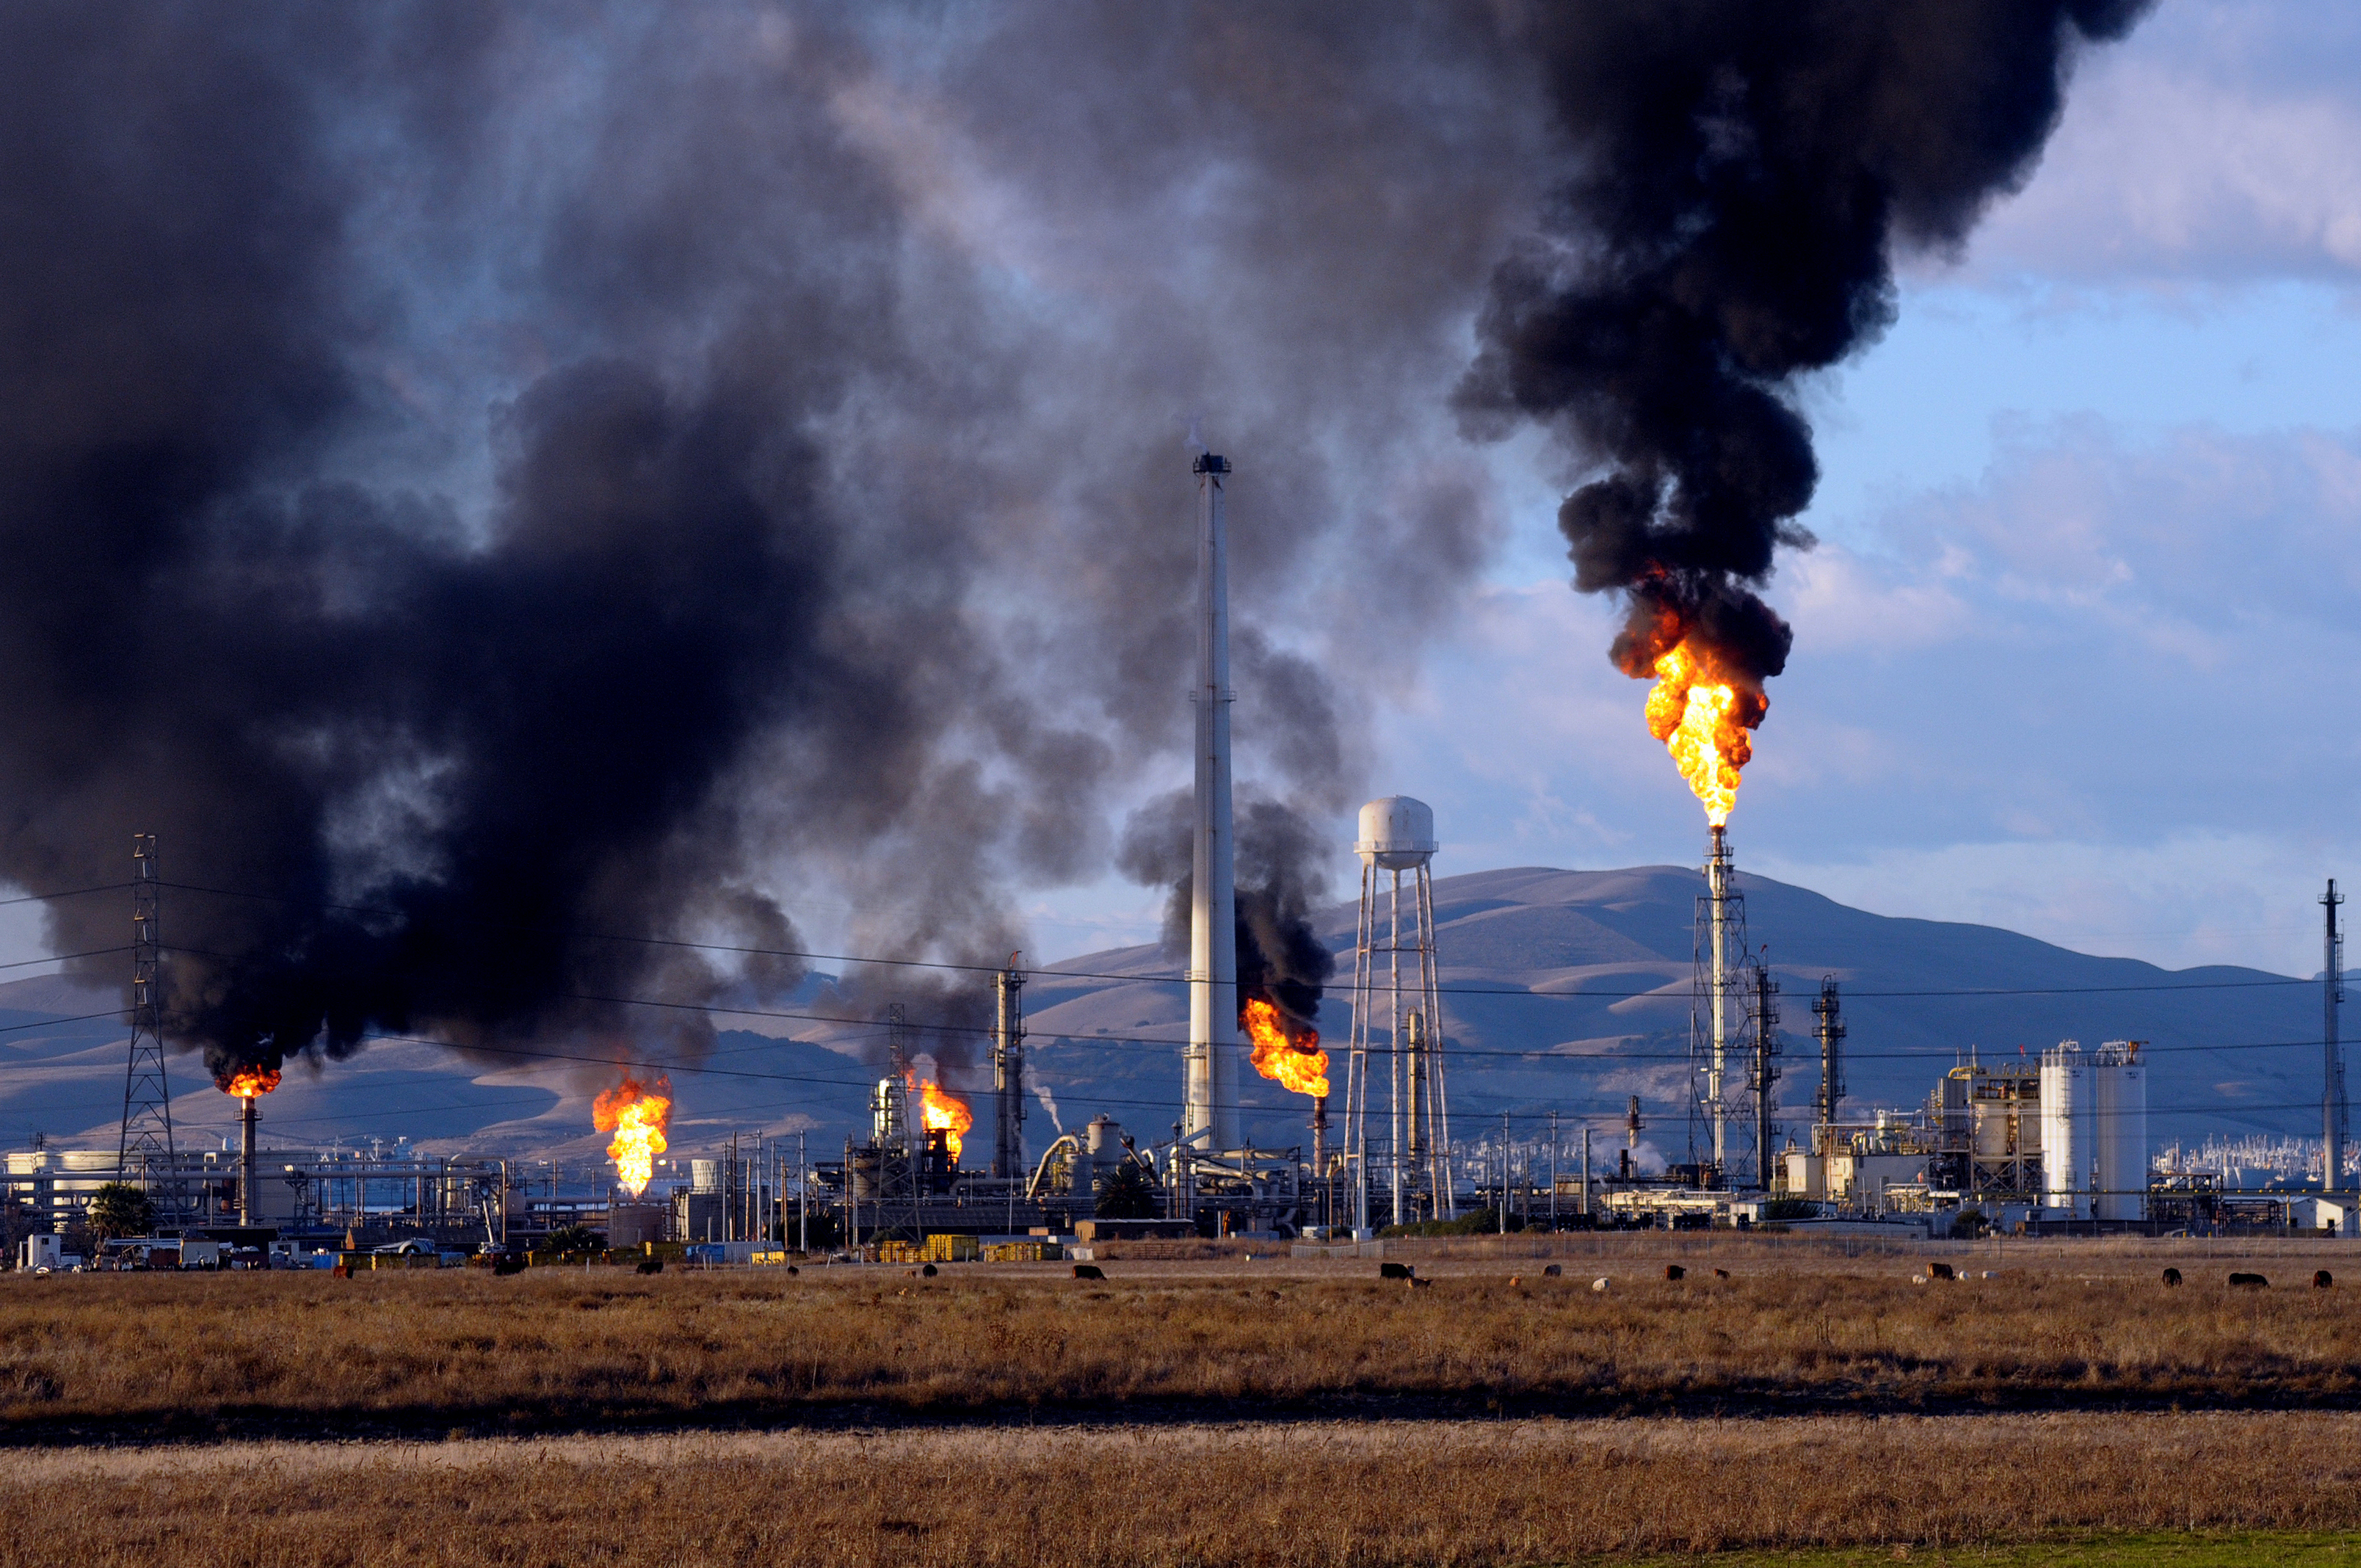 Figure 1. Flaring at Tesoro Refinery, Martinez, CA (Image Source: claycord.com)
Images of flaring at petrochemical refineries show dramatic flames with billowing smoke plumes. But to what extent is this pollution having an effect on nearby air quality? I had this question in mind when I began investigating data from the five refineries in the Bay Area..
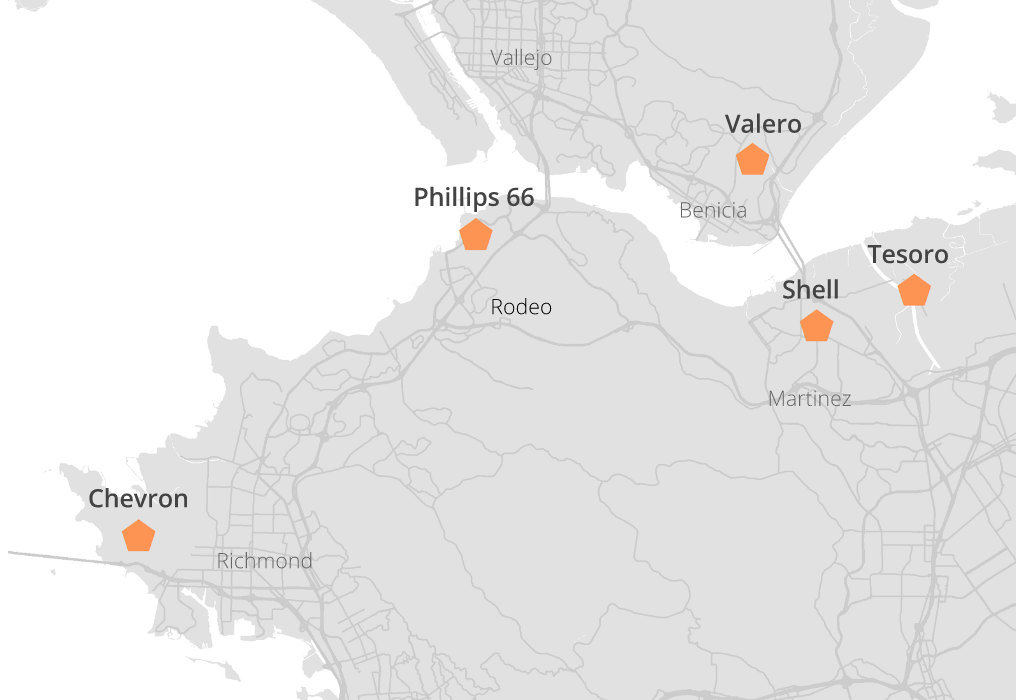 Figure 2. San Francisco Bay Area refinery locations
Flaring
Flaring happens at a refinery when flammable gas is released by a pressure relief valve and burned off at the top of a flare stack. A flaring event often occurs as the result of an emergency at the refinery that requires a shutdown. The flammable gas is unable to be stored and must be released by the process of flaring.
A recent flaring event at the Valero refinery in Benicia, CA was the result of a power outage at the refinery. The flaring activity prompted shelter-in-place and evacuation advisories from the local police station as dangerous chemicals were burned and released into the air.
Flaring Data
I worked with data on daily flaring activity during 2015 and 2016 at each of the five refineries. The data is reported by the refineries to the Bay Area Air Quality Management District (BAAQMD), and provides estimates of the amount of methane, non-methane hydrocarbon, and sulfur dioxide pollution released each day through flaring. Figure 2 visualizes the total amount of flaring pollution emitted by each refinery in 2015 and 2016.
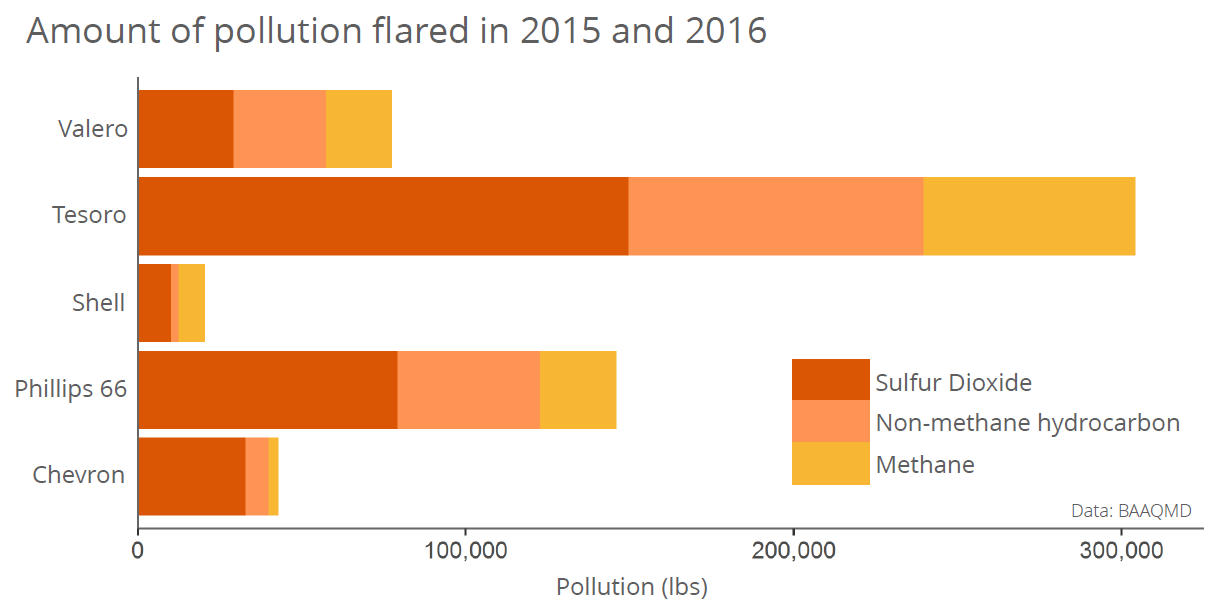
Figure 3. Total pollution from flaring activity in 2015 and 2016
Fenceline Monitoring
Chevron and Phillips 66 have both installed monitors along their fencelines to track concentrations of air pollutants they release. These fenceline monitors measure the concentrations of a variety of air toxins as often as every minute. They publicly report the data in real time. New regulations will require the other refineries in the San Francisco Bay Area to install fenceline monitors as well and start releasing real time data within the next couple of years.
A fenceline monitor is a device that monitors chemical concentrations in the air along the fenceline of a refinery or other polluter to determine the level of pollutants like benzene, hydrogen sulfide, and sulfur dioxide. They also measure concentrations of particulate matter like black carbon. In addition to the fenceline monitors located at two of the refineries, Chevron and Phillips 66, there are additional monitors located in Richmond and Rodeo that were installed by the BAAQMD or by the communities themselves. I worked with data collected throughout 2016 at each of these fenceline monitors.
Real-time data reporting on air pollutant concentrations at each fenceline monitor is available through the Air Watch Bay Area website and app.
Comparing Flaring and Fenceline Monitoring Data
I wanted to explore the flaring and fenceline monitoring data together to determine if there was any relationship between large refinery flaring events and nearby concentrations of air toxins.
My analysis focused on a time period of high flaring activity. This flaring occurred at the Phillips 66 refinery in Rodeo, from January 17 to January 23 of 2016. I created a graph comparing the sulfur dioxide pollution released through flaring with the concentrations at two nearby fenceline monitors. I chose one monitor located on the refinery fenceline and one located in the community of Rodeo to investigate whether proximity to the refinery affected concentrations.
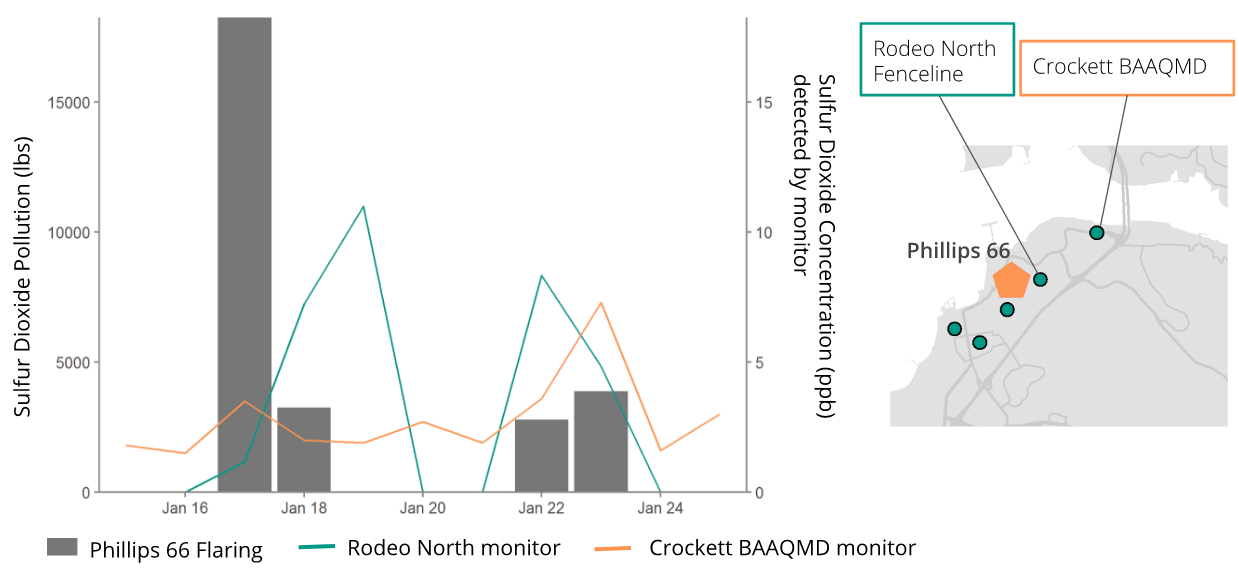 Figure 4. Comparison of flaring pollution and fenceline monitor concentrations
Interpreting the Graph
My comparison of the flaring and fenceline monitoring data revealed some interesting results. This was particularly the case for flaring events on the 17th, 22nd, and 23rd of January. During these events, the Crockett monitor reported higher maximum hourly average concentrations than on days with no flaring activity. The Rodeo North monitor also detected higher concentrations of sulfur dioxide on January 22 and 23. Overall, there is not a perfect relationship between the flaring and fenceline data. However, it seems likely that the monitors are picking up on increased concentrations of sulfur dioxide in the air.
Interestingly, the Rodeo North monitor, located along the fenceline of Phillips 66, reported a high concentration two days after a major flaring event on January 17. It is important to note here that the flaring pollution is not the only pollution output at the refinery. Perhaps another source of pollution increase the sulfur dioxide concentrations in that area on that particular day.
Additionally, there are complex local wind patterns that affect the spread of pollution and likely have a strong impact on the concentration of air pollutants detected at each fenceline monitor. Flare stacks can range from 100 to 350 feet tall, and their height influences the spread of pollution that is released. The combination of changing wind patterns and varying stack heights adds to the complexity of determining where air pollution concentrates.
Conclusions
I cannot determine a direct relationship between flaring pollution and fenceline monitoring concentrations without further investigation into the spread of pollution from flaring and consideration of additional pollution sources. However, my analysis indicates that it may be possible to detect impacts of refinery flaring on local air pollution concentrations. You can see this visualized in Figure 4.
Real-time data from fenceline monitors empowers individuals in communities near refineries. These data enable people to monitor concentrations of air toxins when they spot flaring and smoke from the refinery. Additionally, the Air Watch Bay Area app has a crowdsourced “smell report” feature that allows individuals to report signs of pollution as they observe them. Fenceline monitor data combined with crowdsourced pollution reporting will allow for greater community awareness of environmental conditions and health hazards.
Participate in Summer of Maps
Are you a student that’s looking to grow professionally in a GIS analytics career? Do you want to develop spatial analysis skills in a hands-on learning environment?
Keep an eye out for open application dates later this fall and reach out to us with questions about the program!