
This post is part of a series of articles written by 2017 Summer of Maps Fellows. Azavea’s Summer of Maps Fellowship Program is run by the Data Analytics team and provides impactful Data Analysis Services Grants for nonprofits and mentoring expertise to fellows. To see more blog posts about Summer of Maps, click here …
The Speak to Your Health! Community Survey is a bi-annual, participatory survey that includes questions regarding community and individual health for residents in Genesee County, MI. At the heart of Genesee County lies the City of Flint. In between the 2013 and 2015 iterations of the survey, the municipal water source for Flint was switched from Lake Huron to the Flint River. This occurred without the proper anti-corrosion measures. As we now know, this event was the catalyst for what would be known as the Flint Water Crisis. Soon after the change in the municipal water supply, some of the city’s residents began to see their tap water become poorer in quality. In the fall of 2015, reports of elevated blood lead levels in children and lead levels in tap water were released. Flint’s mayor finally declared a state of emergency in December 2015, nearly two years after the municipal water supply switch.

After the reports on elevated lead levels in children and tap water, the Speak to Your Health! Community Survey found it imperative to see how residents in Genesee County viewed the quality of their tap water. So, just before the 2015 survey was sent out, the committee included a set of questions on the survey regarding perceptions on tap water, where residents sourced their water, and the degree of difficulty residents had paying their water bill. The results of the 2015 survey were utilized in one of my Summer of Maps projects to assess the impact of the Flint Water Crisis on community health.
Mapping lead levels in tap water samples
One of the outcomes of the Flint Water Crisis that I wanted to highlight in this project was the elevated lead levels in residential tap water. I gathered data on tap water samples taken by residents of the Flint area. This crowdsourced dataset was openly available through the Flint Water webpage from the State of Michigan.
The data included information on the date the sample was taken, address attributes, and copper and lead levels found in each of the tap water samples. After geocoding the addresses from this dataset, I visualized the distribution of these sample points across the City of Flint.
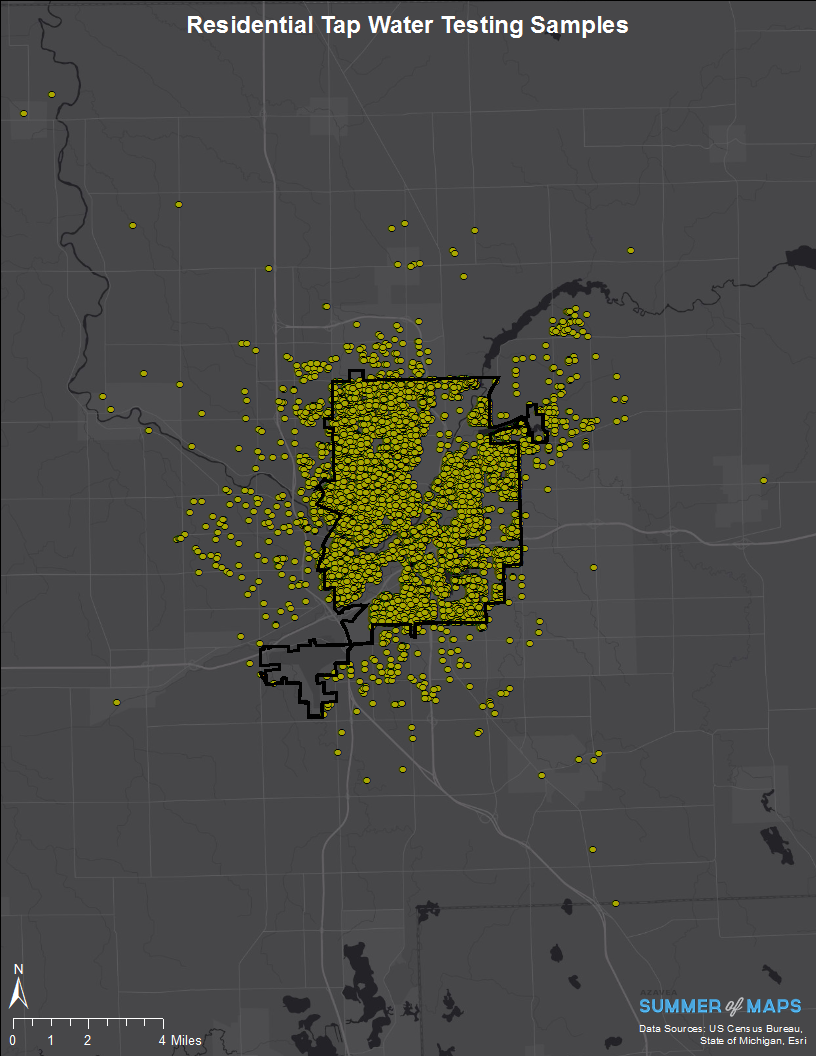
All geocoded tap water sample points for the Flint, MI area
The map above shows the geocoded results from the tap water sample datasets. Note that while most of the samples were taken within the city’s boundary, there are some that fall just outside the city as well as some outliers even further away. The map below shows sample points from the same dataset; however, each of these points were found to have lead levels in tap water samples at or above 15 parts per billion (ppb). Lead concentrations in water exceeding 15 ppb is what the Environmental Protection Agency (EPA) considers an action level – the point at which where if more than 10% of water samples are tested at that level, the state or public water system must take measures to control the corrosion. It is interesting to note that most of the water samples that tested at 15 ppb of lead were relegated within Flint’s boundary – an outcome of the geographic extent of the Flint Water Crisis.
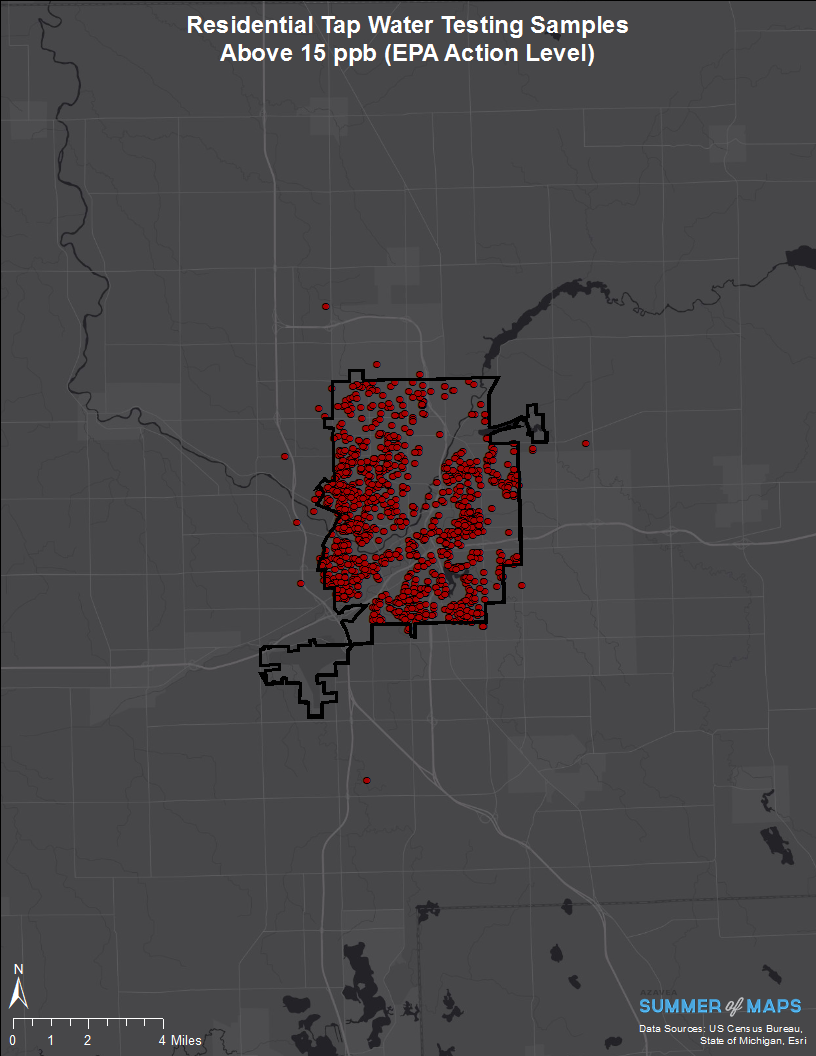
Geocoded tap water sample points that tested for lead above 15 ppb
Interpolating lead levels from sample data
Using these geocoded data points, I estimated the lead levels of residential tap water for the whole study area through interpolation. One condition to perform a proper interpolation, however, is to ensure that the data are normally distributed. The original dataset was not normally distributed because there were many samples that had no traces of lead (0 ppb) while some had very high amounts of lead. To normalize the data so the values were as evenly distributed as possibly, I needed to take the log10 (decadic logarithm) of each of sample values. More information on transforming data for interpolation can be found here. After transforming the data, I also needed to sample one point per unique address so each address was only accounted for once. However, even after sampling just one point per address, some addresses geocoded to the same point. This was due in part to some samples taken in apartment complexes, where different units in the same building sampled their tap water. In this case, the mean lead level value was taken for each of these instances. The results from the interpolation function are shown on the map below.
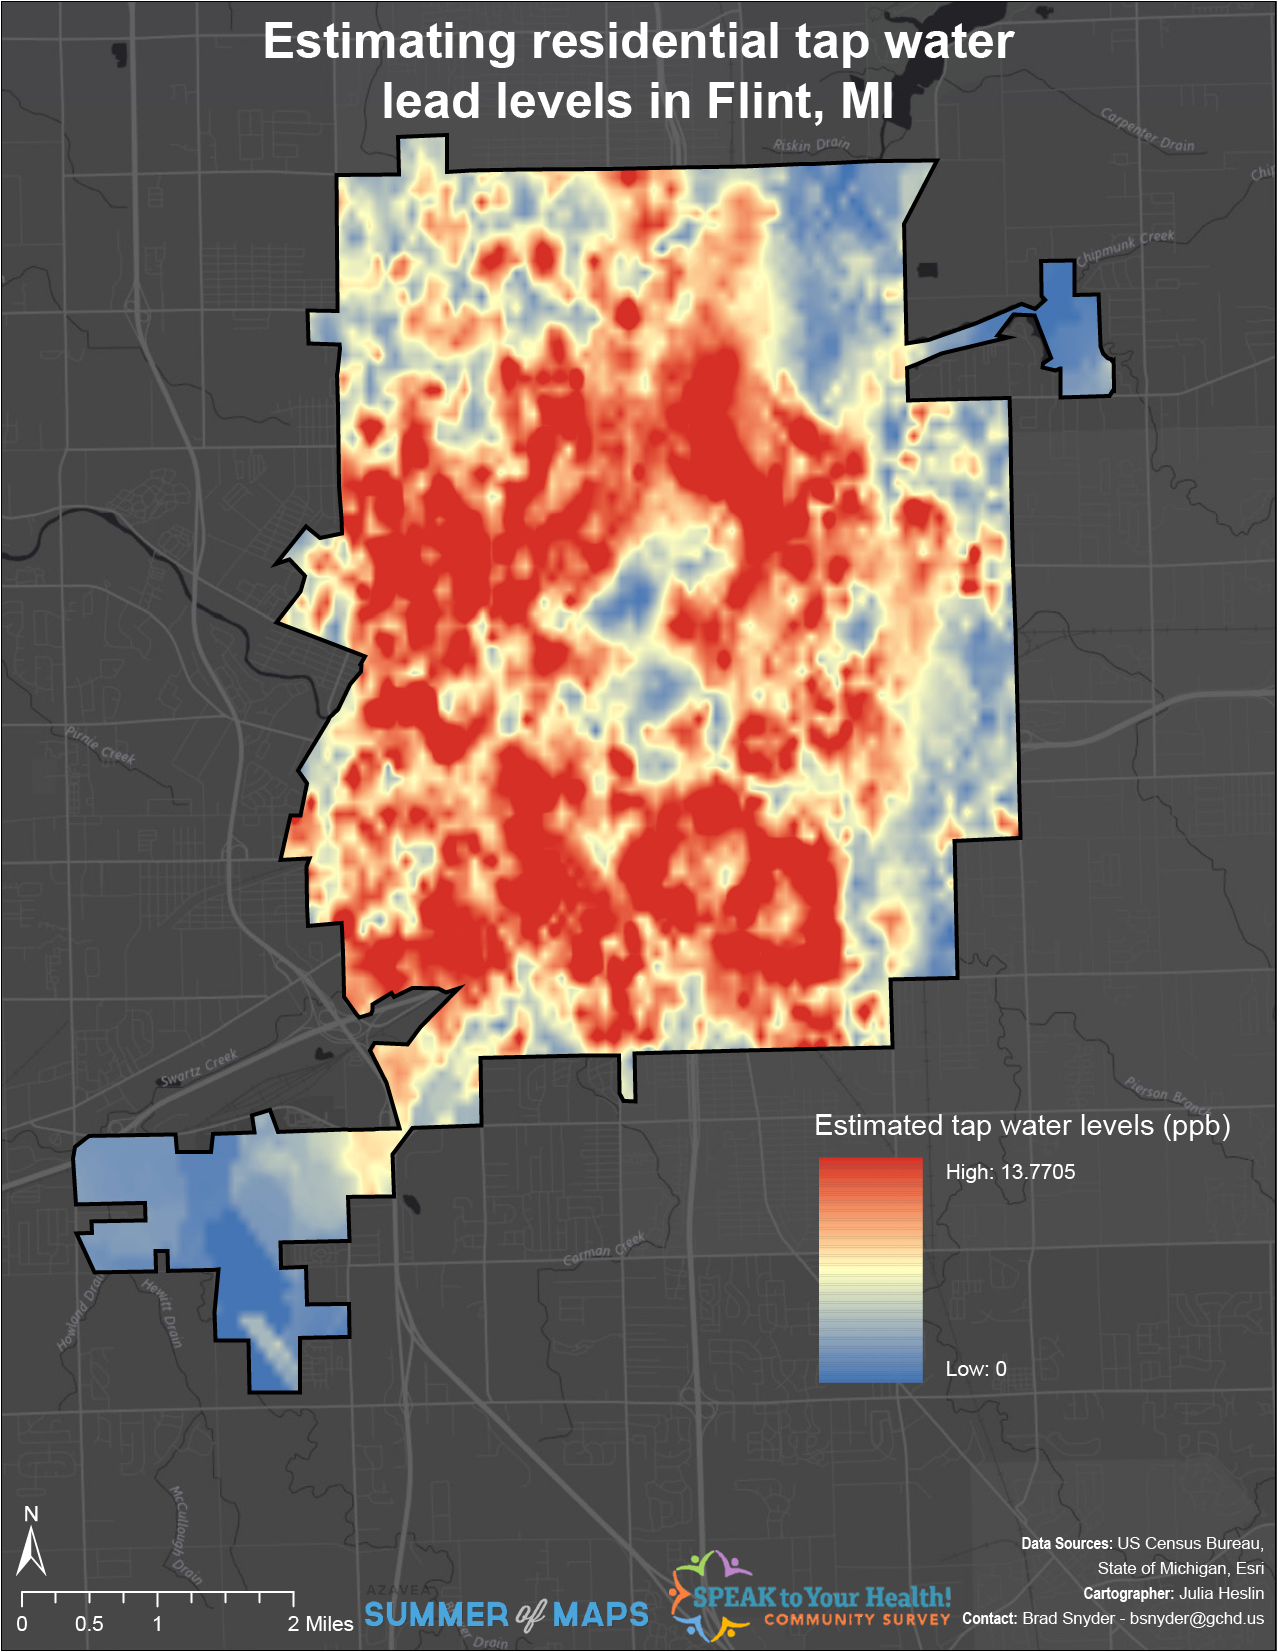
Residential tap water lead levels interpolation extracted to Flint boundary
There are a few things to note about the scale of estimated lead levels. While there were samples containing at least 15 ppb of lead, the scale does not exceed this threshold. There are a few reasons for this. One being that the average for samples taken at the same point could have decreased the value for the points tested at above 15 ppb of lead. The main factor contributing to this decrease in estimated ppb of lead was having to normalize the data using the logarithmic function then having to revert back to the original unit of measurement. Despite this underestimation in lead levels in the tap water, there could have been some errors within the dataset given that the samples were taken by the residents themselves.
Presenting at the survey committee meeting
I had the opportunity to share the results from this analysis along with the other analyses conducted for this project at the Speak to Your Health! Community Survey committee meeting in Genesee County. Just before attending the meeting, our point person requested that I estimate the lead levels in tap water based on respondents’ addresses.
While I did not have access to the individual-level survey results (due to privacy restrictions), I had the locations of survey respondents’ residences. I was able to extract the estimated lead level values by points from these individual addresses. Using the estimated lead levels for survey respondents, our point person was able to run a regression to see whether or not lead levels in residents’ tap water predicted survey results regarding tap water quality. He was able to share with the committee that these estimated lead levels significantly predicted survey respondents’ perception of their tap water quality. I was happy to hear that and all of the feedback the committee offered.
After the presentation, my mentor Daniel and I were able to stay for the rest of the meeting. The main item on this meeting’s agenda was revising questions on the 2017 iteration of the Speak to Your Health! Community Survey. Compared to the 2015 iteration, the 2017 survey will include more questions regarding tap water quality, but less questions overall. Understanding tap water quality perceptions over time will better aid researchers and community members in the aftermath of the water crisis.
Participate in Summer of Maps
Are you a student that’s looking to grow professionally in a GIS analytics career? Do you want to develop spatial analysis skills in a hands-on learning environment?
Keep an eye out for open application dates later this fall and reach out to us with questions about the program!