
This post is part of a series of articles written by 2017 Summer of Maps Fellows. Azavea’s Summer of Maps Fellowship Program is run by the Data Analytics Team and provides impactful Data Analysis Services Grants for nonprofits and mentorship to fellows. To see more blog posts about Summer of Maps, click here.
Mapping location accessibility may sound familiar to you. What tools would you use to do it? Network Analyst? Or Cost Surface? I found something even better: the AccessMod 5 tool, developed by the World Health Organization.
To get started using the tool, you’ll need 5 inputs:
- DEM, ESRI Grid Files (.adf)
- Land cover raster (.adf)
- Barrier vector(s), ESRI Shapefiles (.shp)
- Road vector(s) (.shp)
- Facilities location vector (.shp)
The output is an accessibility map based on travel time.
There are a few reasons why I recommend this tool. First, it is very fast – the computation just takes several minutes. Second, it is easy to use – all the buttons and functionalities are quite self-explanatory. Third, it is a scientifically sound method. It has been used in academic papers, for example, Munoz and Källestål’s research on modeling access to healthcare in Rwanda.
However, it can get tricky as there is not enough documentation about this application. I spent many hours debugging problems because they were not mentioned anywhere on the internet. Therefore, I hope that this blog can save some time when you’re using AccessMod 5.
Installation
AccessMod 5 is a standalone application that is run on a virtual machine. You will need to follow the installation instructions here to initialize it. *Don’t shy away!* The virtual machine may sound complicated, but it is actually quick and easy to set up.
There are two things you need to do before you get started. You need to have basic knowledge about ArcGIS desktop software or QGIS. You should also have a local coordinate system for your project location.
Start a New Project
Before you start, you will need to transform your DEM to a projection that is localized to your study area. Once you have the application and data ready, you can navigate to the “Project” panel and expand the “New” tab. Create a name for your project and upload the Digital Elevation Model (DEM) in Esri .adf format for the area of interest. In this case, my project is “maraAccess”, and the DEM is for Mara Region, Tanzania. Once the project is created, it will show up under the “Project Summary” section, and the map will indicate your project location (Figure 1).
 Figure 1. The front page of AccessMod 5.
Note:
- Ignore “Project maraAccess is not available” warning. It is because this project is already created and projects cannot have the same name.
- Failed to upload DEM? See the Troubleshooting Section at the end of this blog.
Customize the Coordinate System
Once you create a new project, it’s better for you to obtain the AccessMod’s custom projection and convert all your prepared data into its custom projection. The consequence of not using their custom projection is that the accessibility map will be calculated with an offset projection. Please see the Troubleshooting Section for detail.
Here is a step-by-step instruction to obtain custom projection and transform data:
- Select the DEM under the “Available Data” table
- Archive the dataset
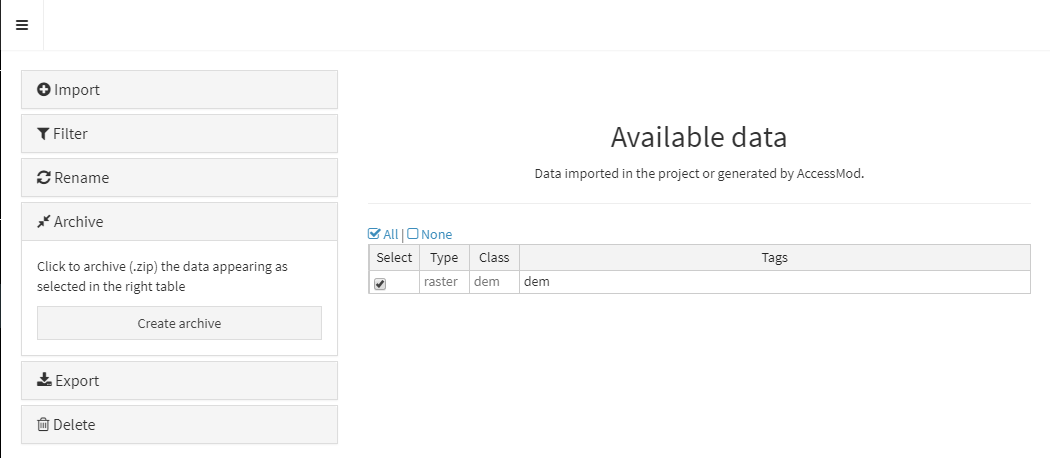 Figure 2. Archive Data
3. Export data
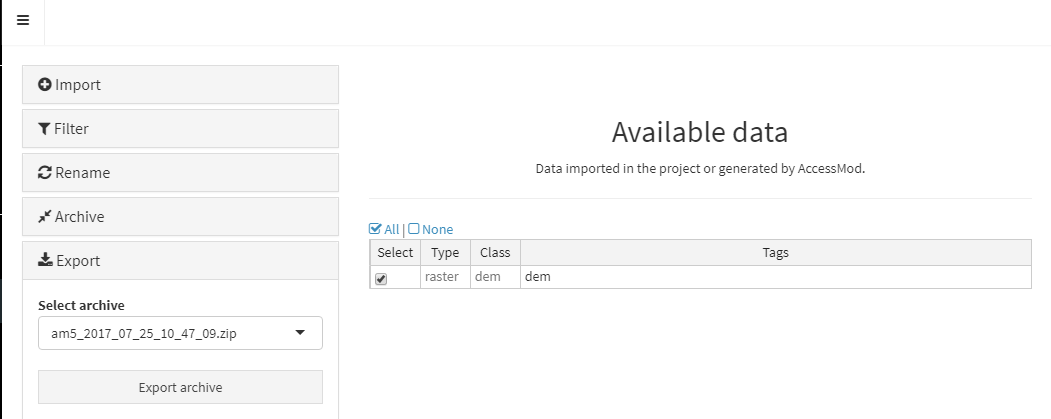
Figure 3. Export Data
The newly downloaded DEM will contain AccessMod’s custom projection which you can transform all other data into.
Upload Data
Now that you have all data in AccessMod’s custom projection, you can import them into the project by navigating to the “Data” panel and expanding the “Import” tab (Figure 4). Since you have already uploaded the DEM file when you created the project, there is no need to upload it again. Import the land cover raster, barrier, road, and facility vectors.
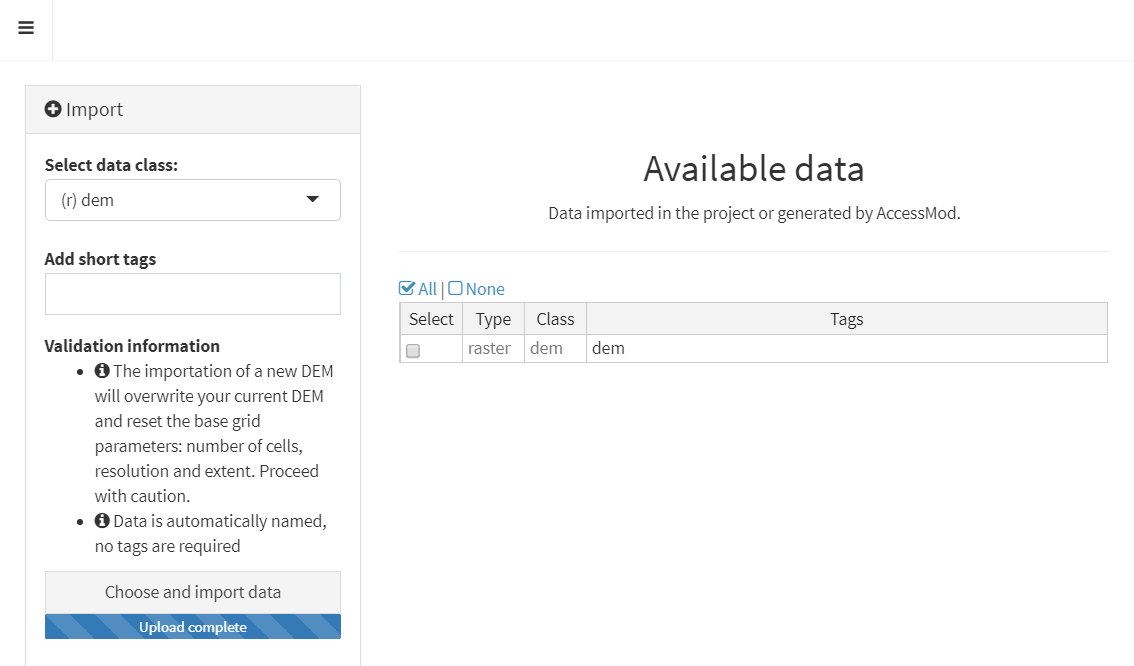
Figure 4. The interface for data upload
Merge Land Cover
The analysis part starts here! The “Merge land cover” tool is necessary to prepare for making the final “Accessibility analysis”. This tool creates a raster map with each pixel as an overlay of land cover, road and barrier parameters. A detailed explanation of this tool and layer order can be found on this Github page.
Navigate to the “Toolbox” panel and then the “Merge land cover” tab. Next, import the data you uploaded into each corresponding section, circled in purple (Figure 5).
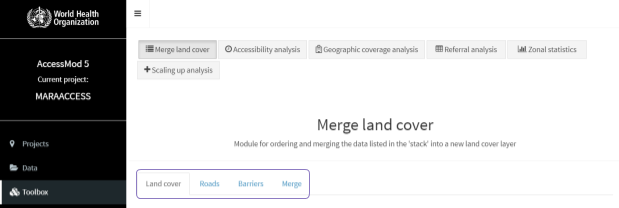
Figure 5. Merging land cover
Note: If you have trouble adding the land cover layer to the stack, please see the Troubleshooting Section.
After having all files in the stack, you can now manipulate the layer orders to get your most desired land cover merged file (Figure 6). In short, you put the most important layer on top and least important at the bottom. When you finish reordering, click “Merge the items in the stack”. The output will be a layer called “land cover merged” which will be used for the next step.
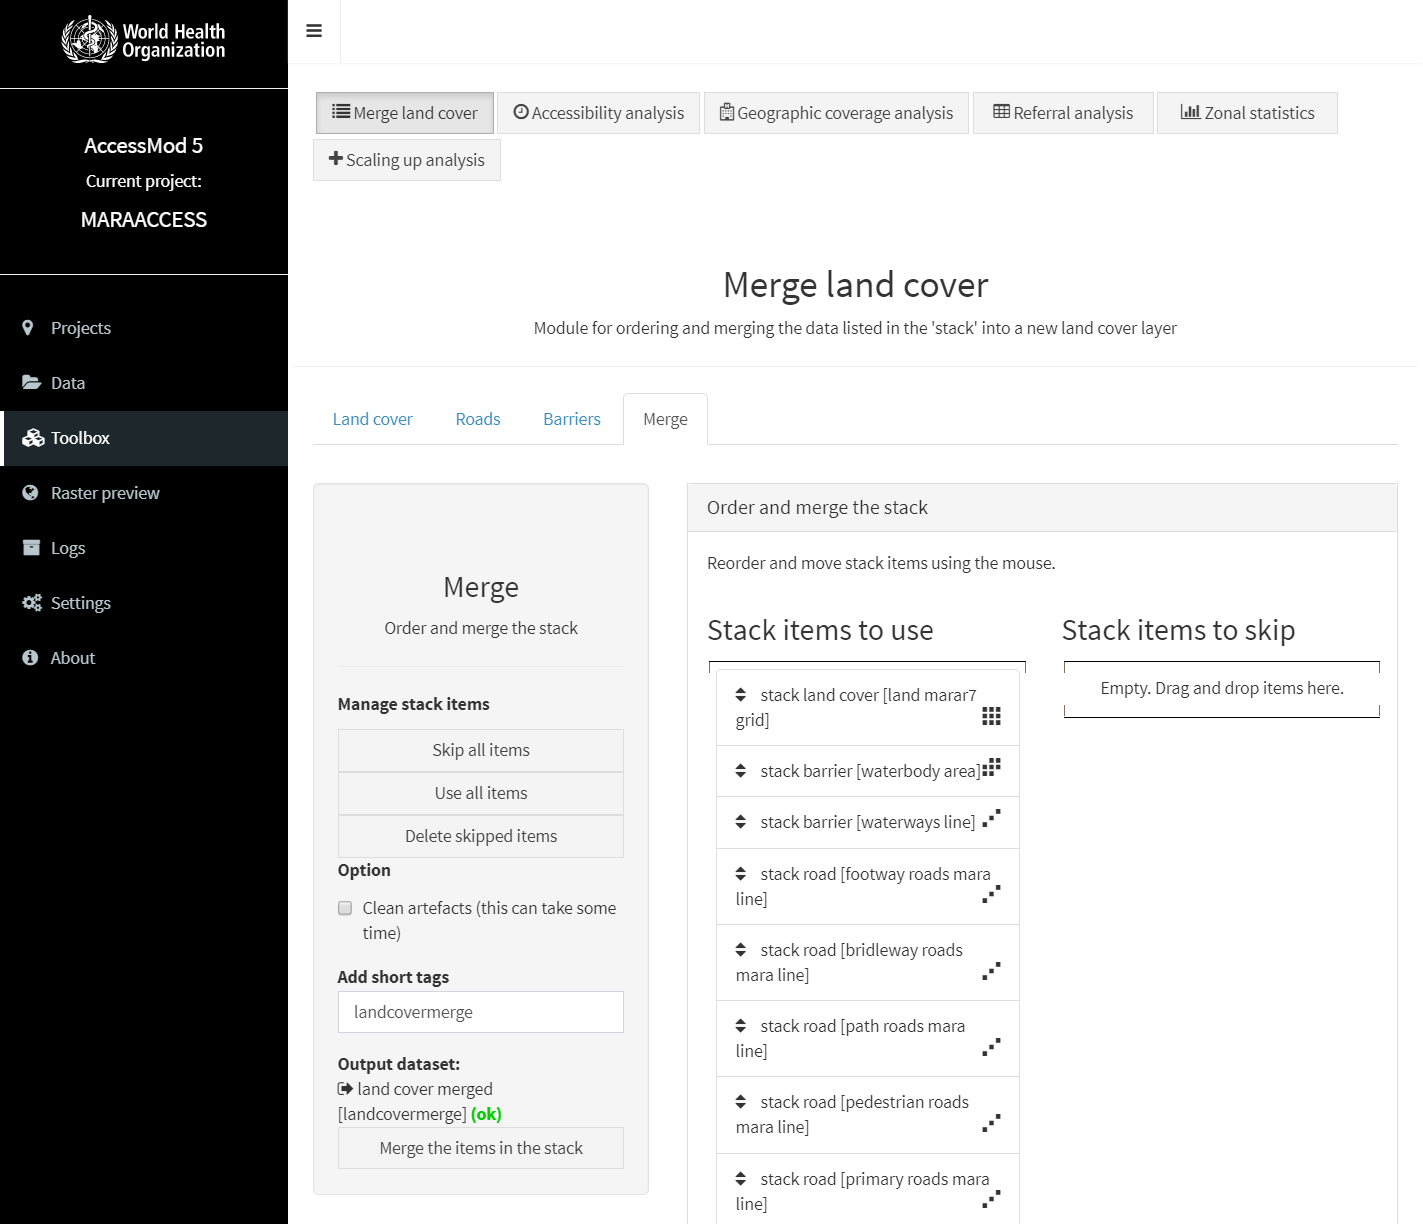
Figure 6. The stack of items
Run Accessibility Analysis
When the Merge land cover step is done, you can move on to Accessibility Analysis tab (Figure 7). The application will automatically populate some data for you. You just need to set a maximum travel time and the speed for the “Travel Scenario” table. Double check on default options, then hit “Compute”.
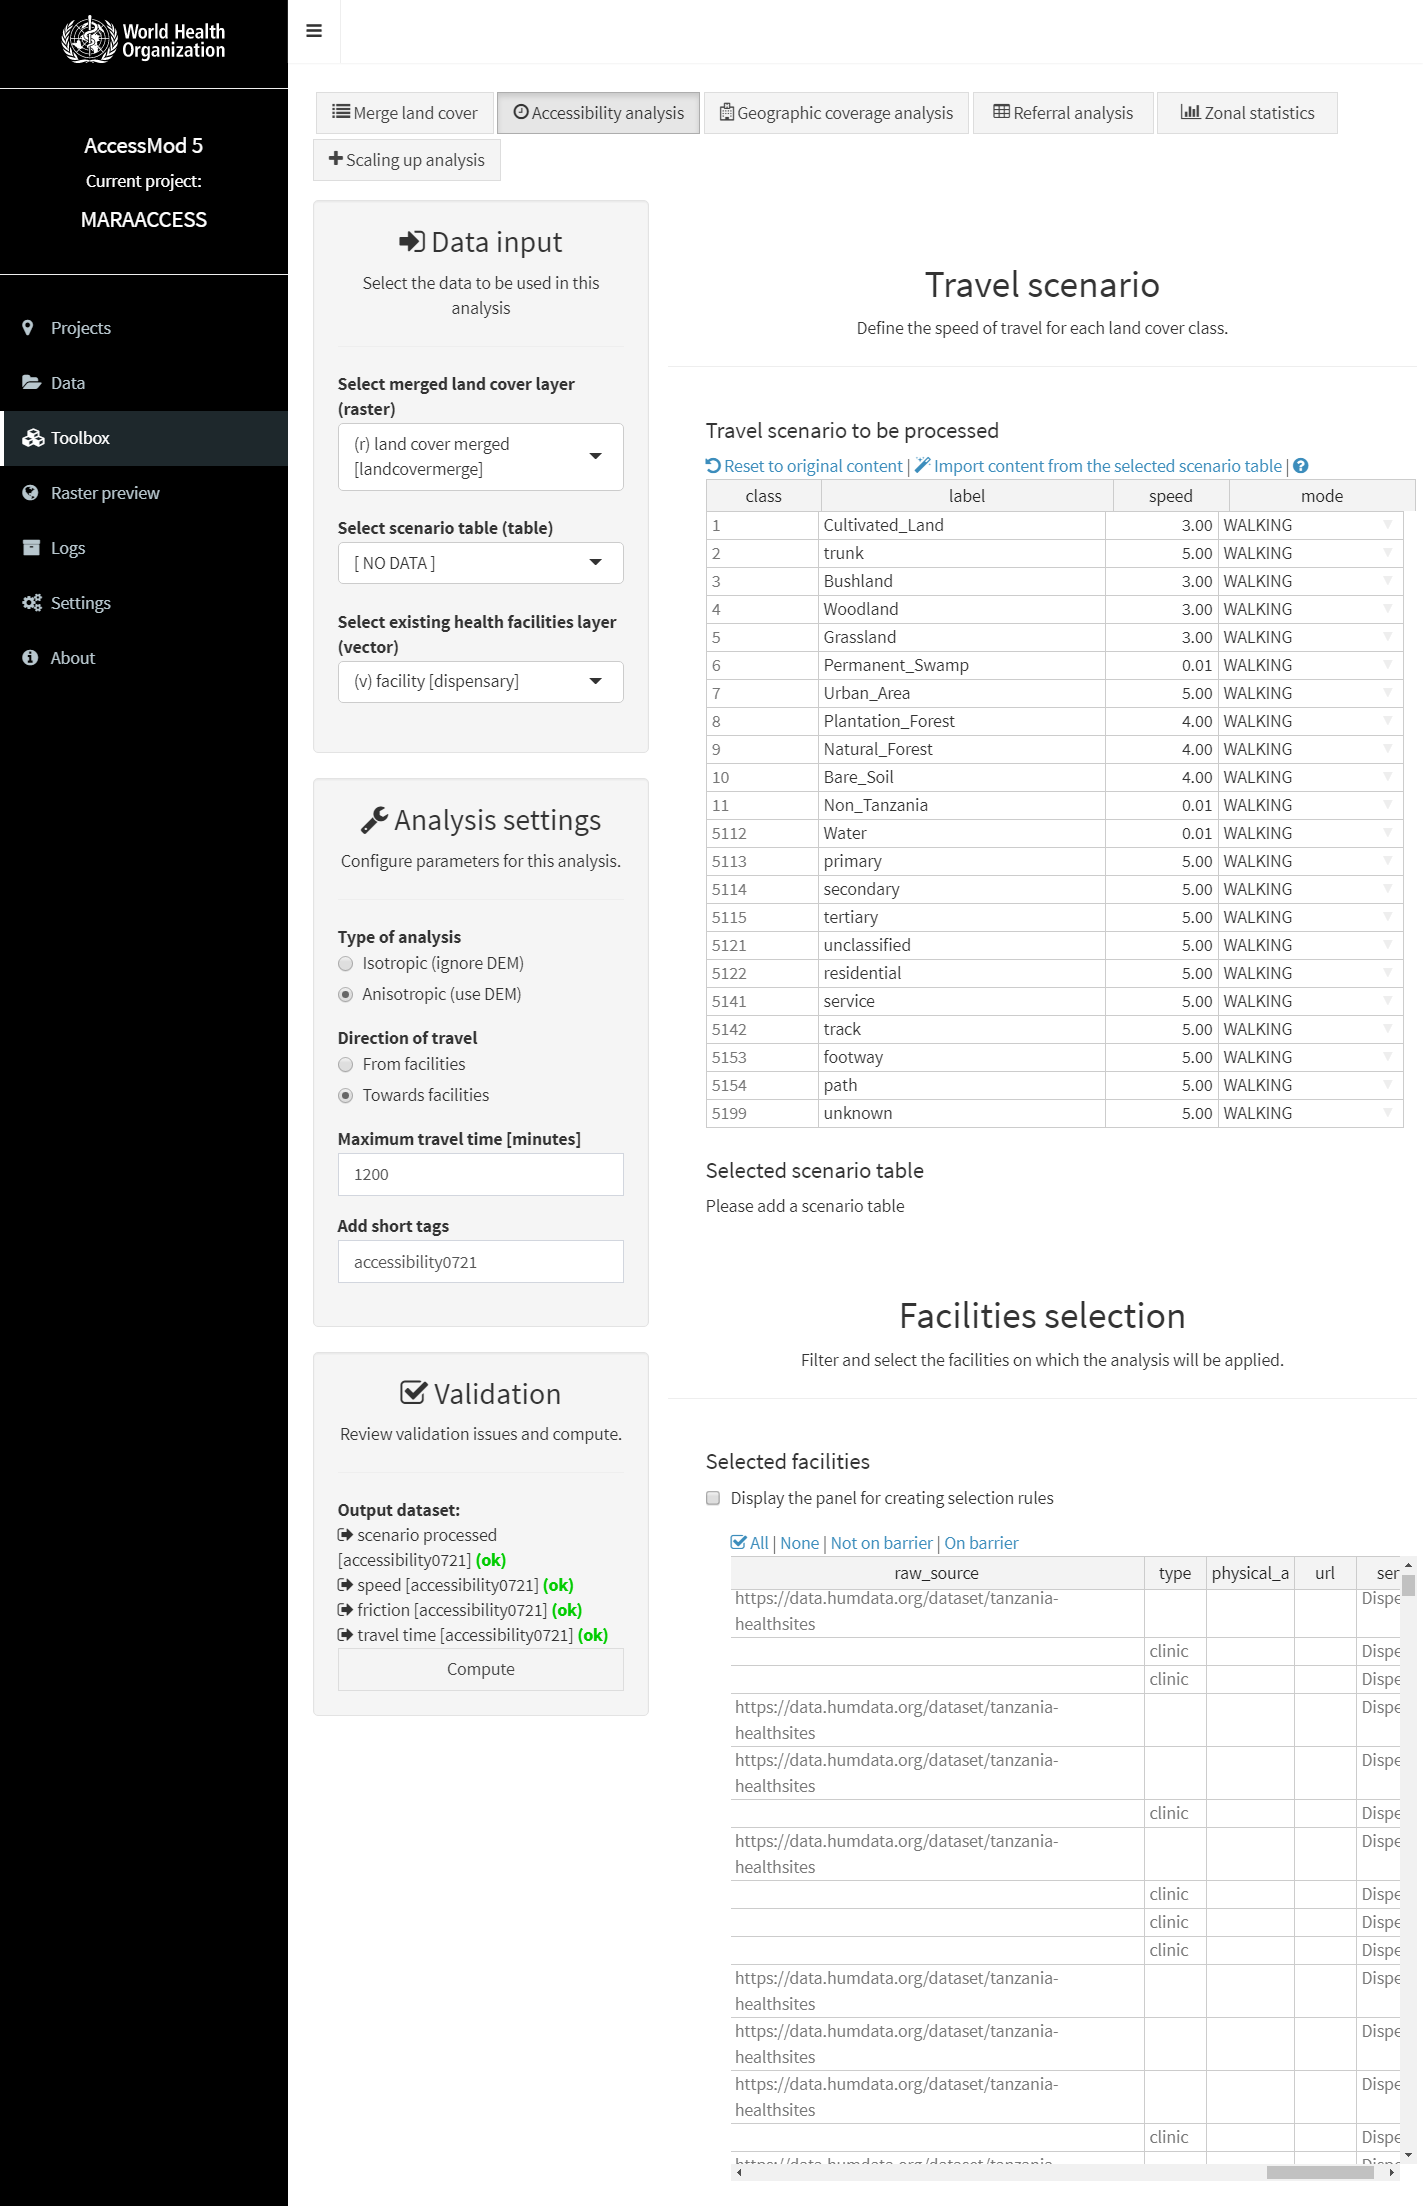
Figure 7. Accessibility analysis interface
For the speed, I set the basic walking speed for the flat surface to be 5km/h, based on Munoz, U.H. & Källestål, C’s recommendation. In the same article, they also provided a table with more speed assumptions, which is worth checking out.
Preview Map
After the tool processes, a map is produced! You can preview it under “Raster preview” panel. In fact, you can preview all raster files in this panel.
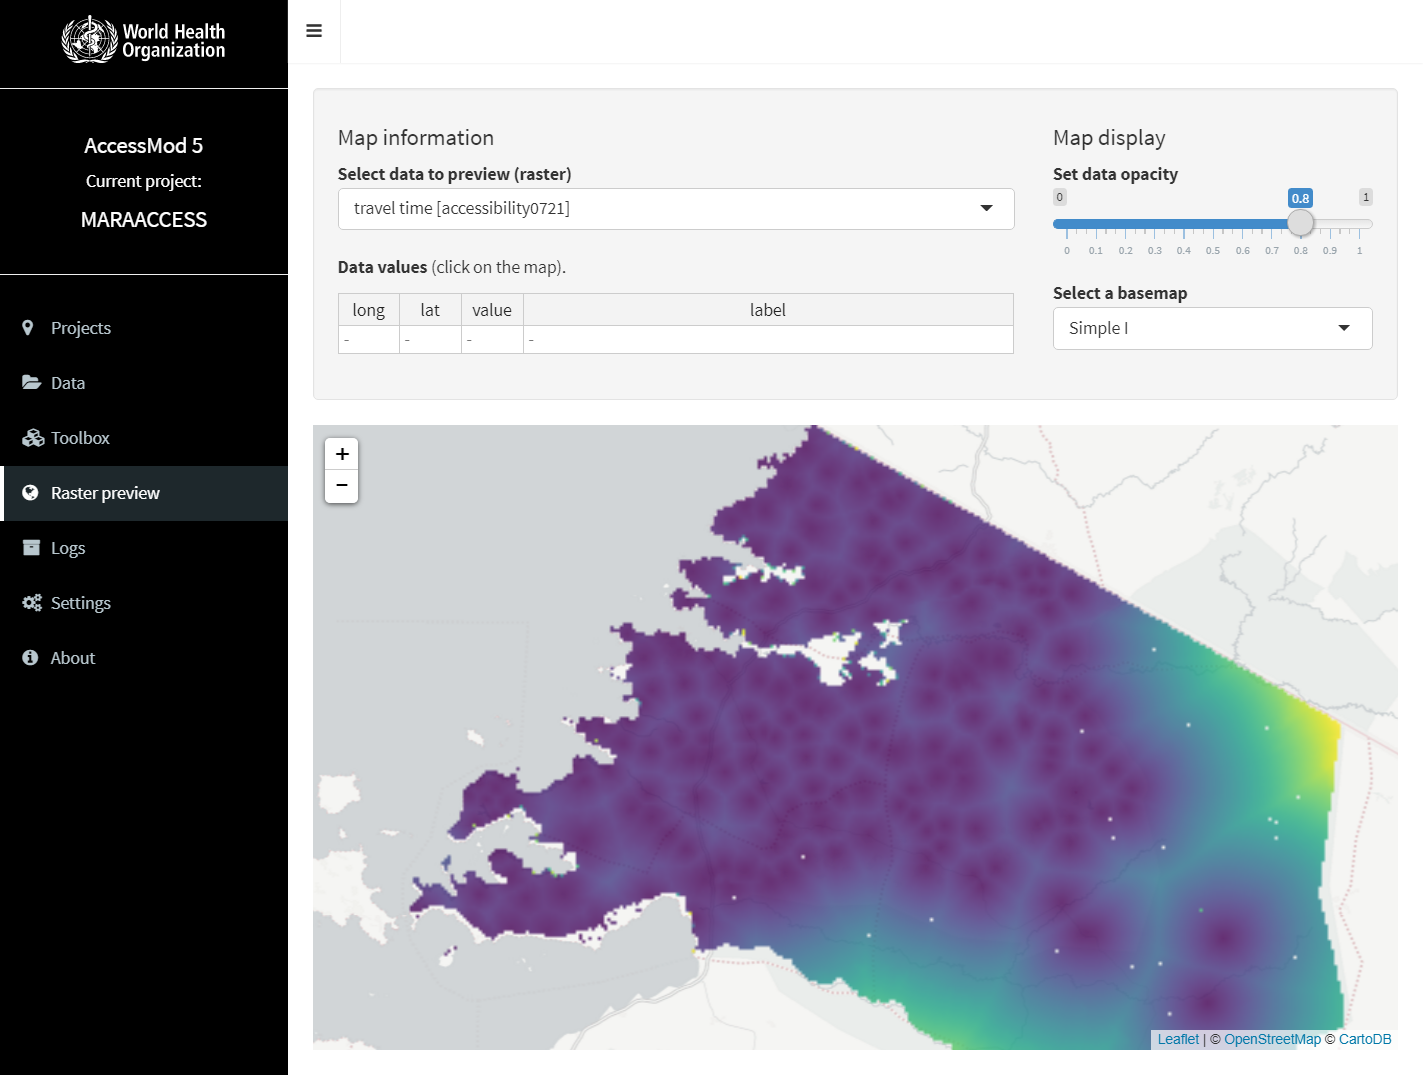
Figure 8. Preview of the accessibility map
Export Map
To export the accessibility map, you need to first create an archive and then export them, as shown in Figure 9 & 10.
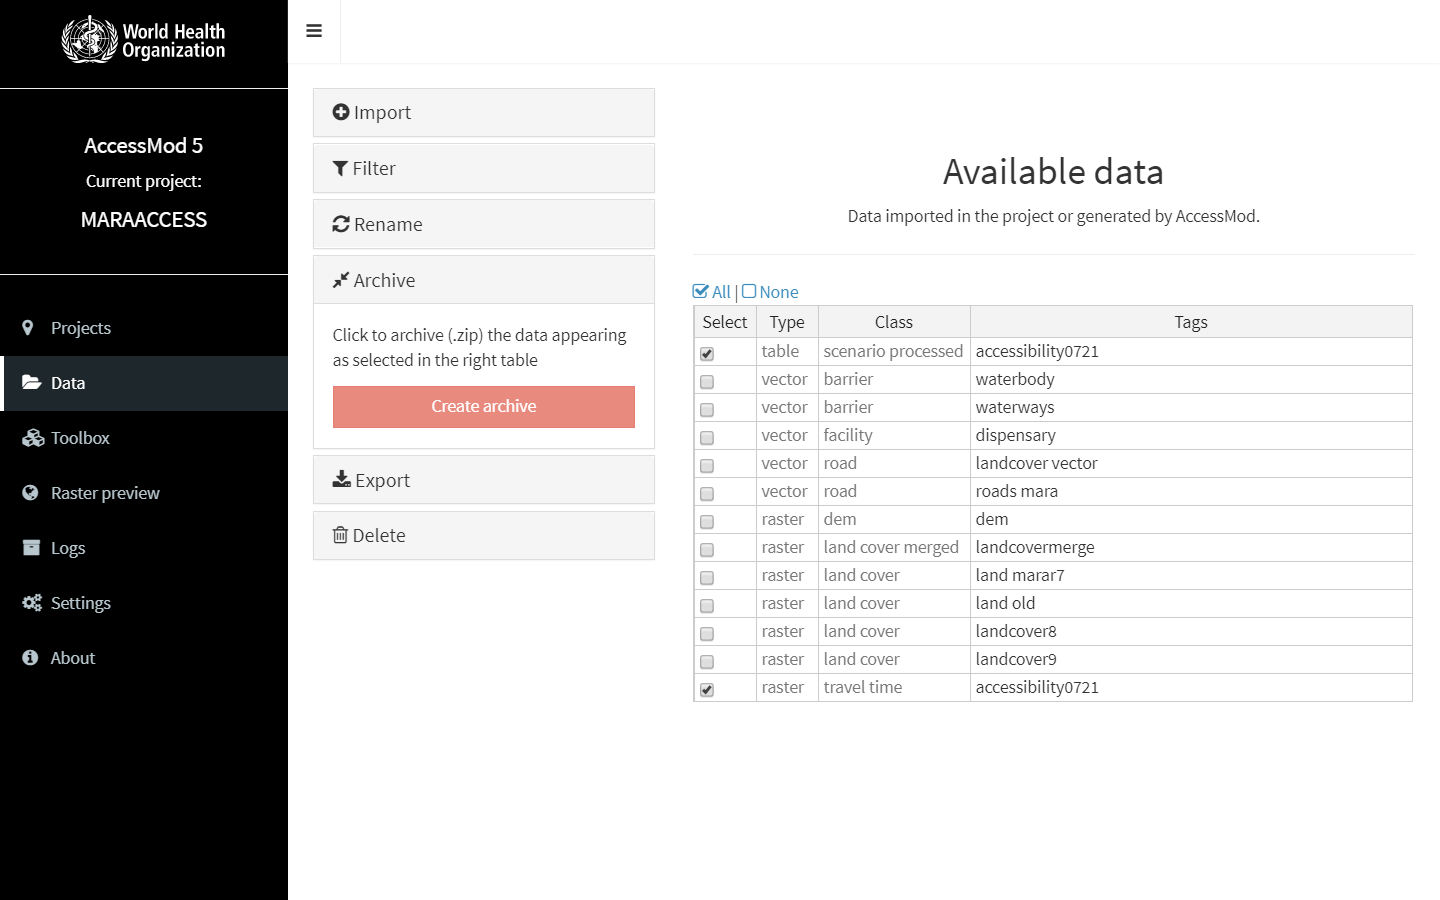
Figure 9. Create an archive for data to be saved
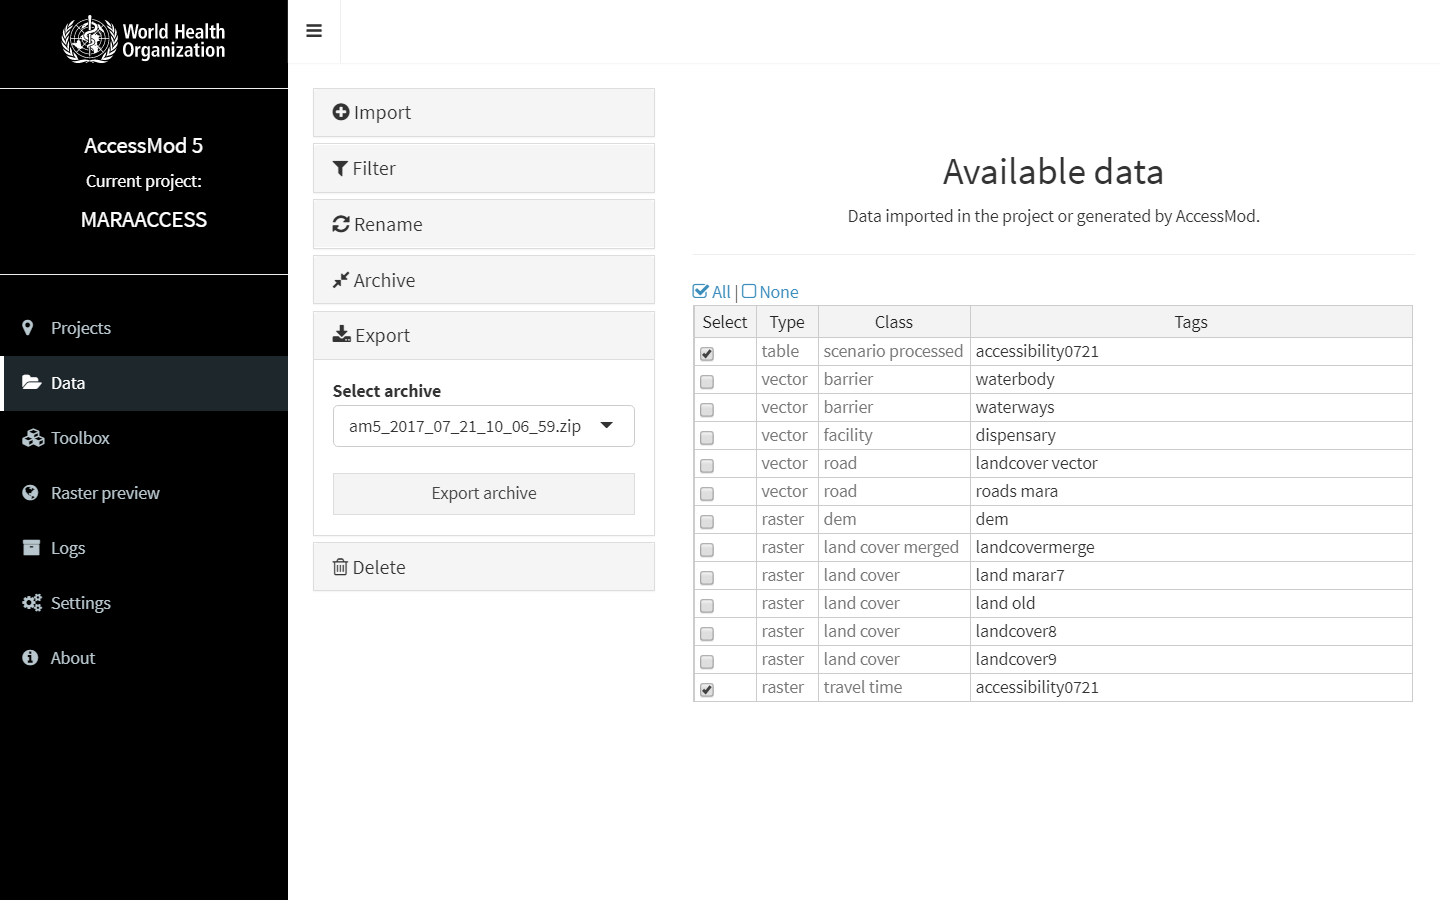
Figure 10. Export data
Final Map
When you finish exporting, import the raster to a GIS software and produce a map that is more visually appealing.

Figure 11. Map produced from ArcGIS Pro
Troubleshooting & FAQ
Problem 1: The DEM failed to upload.
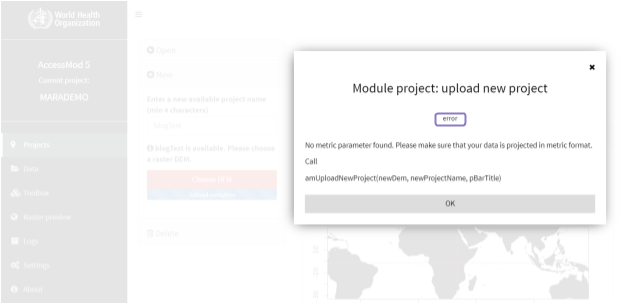
Figure 12. DEM uploading error
Solution:
- Check the DEM’s file format. It should be an .adf file, not .tif.
- Check the DEM’s projection. It should be either the projection your study area or the custom projection provided by AccessMod.
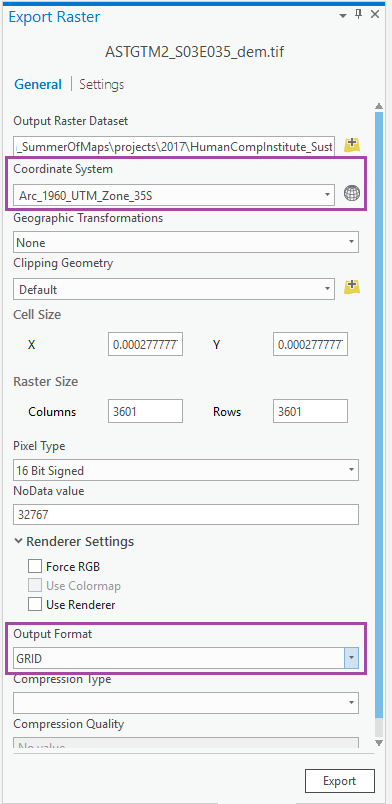
Figure 13. Export Raster Interface
- Make sure to select all files associated with the DEM when uploading. This also applies to all other vector and raster files. Jump back to “Start a New Project”.
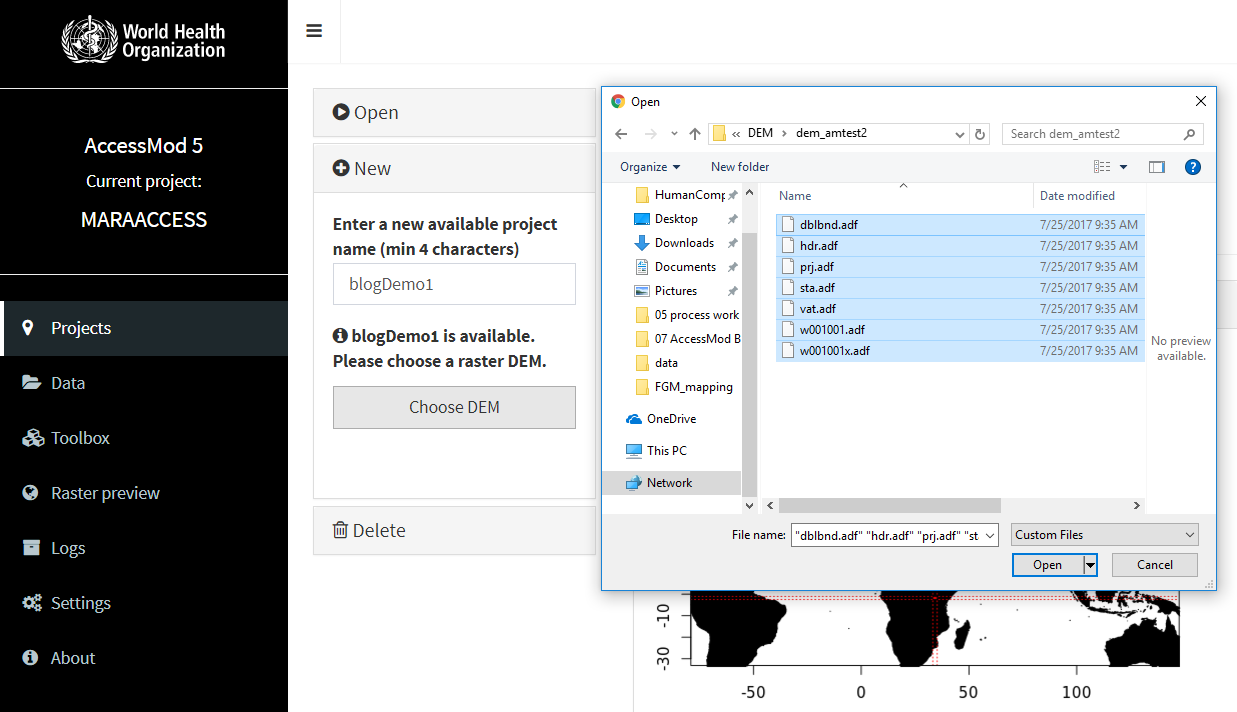
Figure 14. Upload interface
Problem 2: Accessibility map has layers that are misaligned.
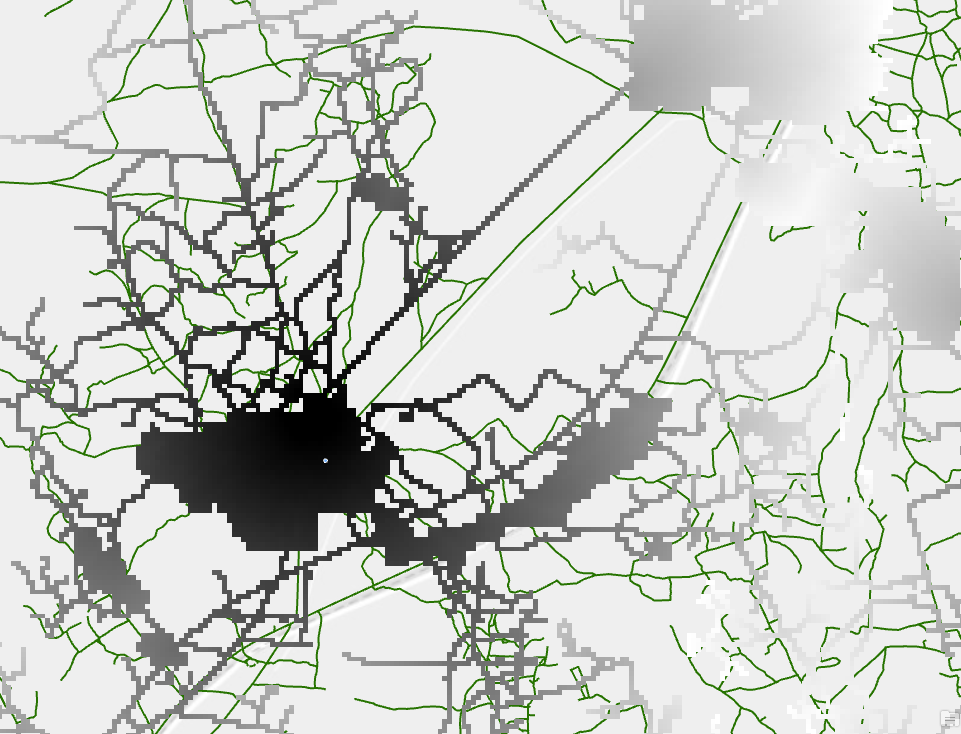
Figure 15. Accessibility map misaligns with road layer
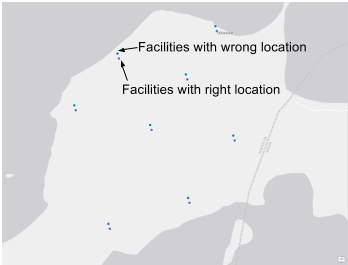
Figure 16. Facilities that are reprojected in AccessMod misalign with their original locations
Solution:
Transform line and point features to AccessMod custom projection before utilizing the data. Jump back to “Customize the Coordinate System”.
Problem 3: I can’t add land cover to stack in the “Merge land cover” tool.
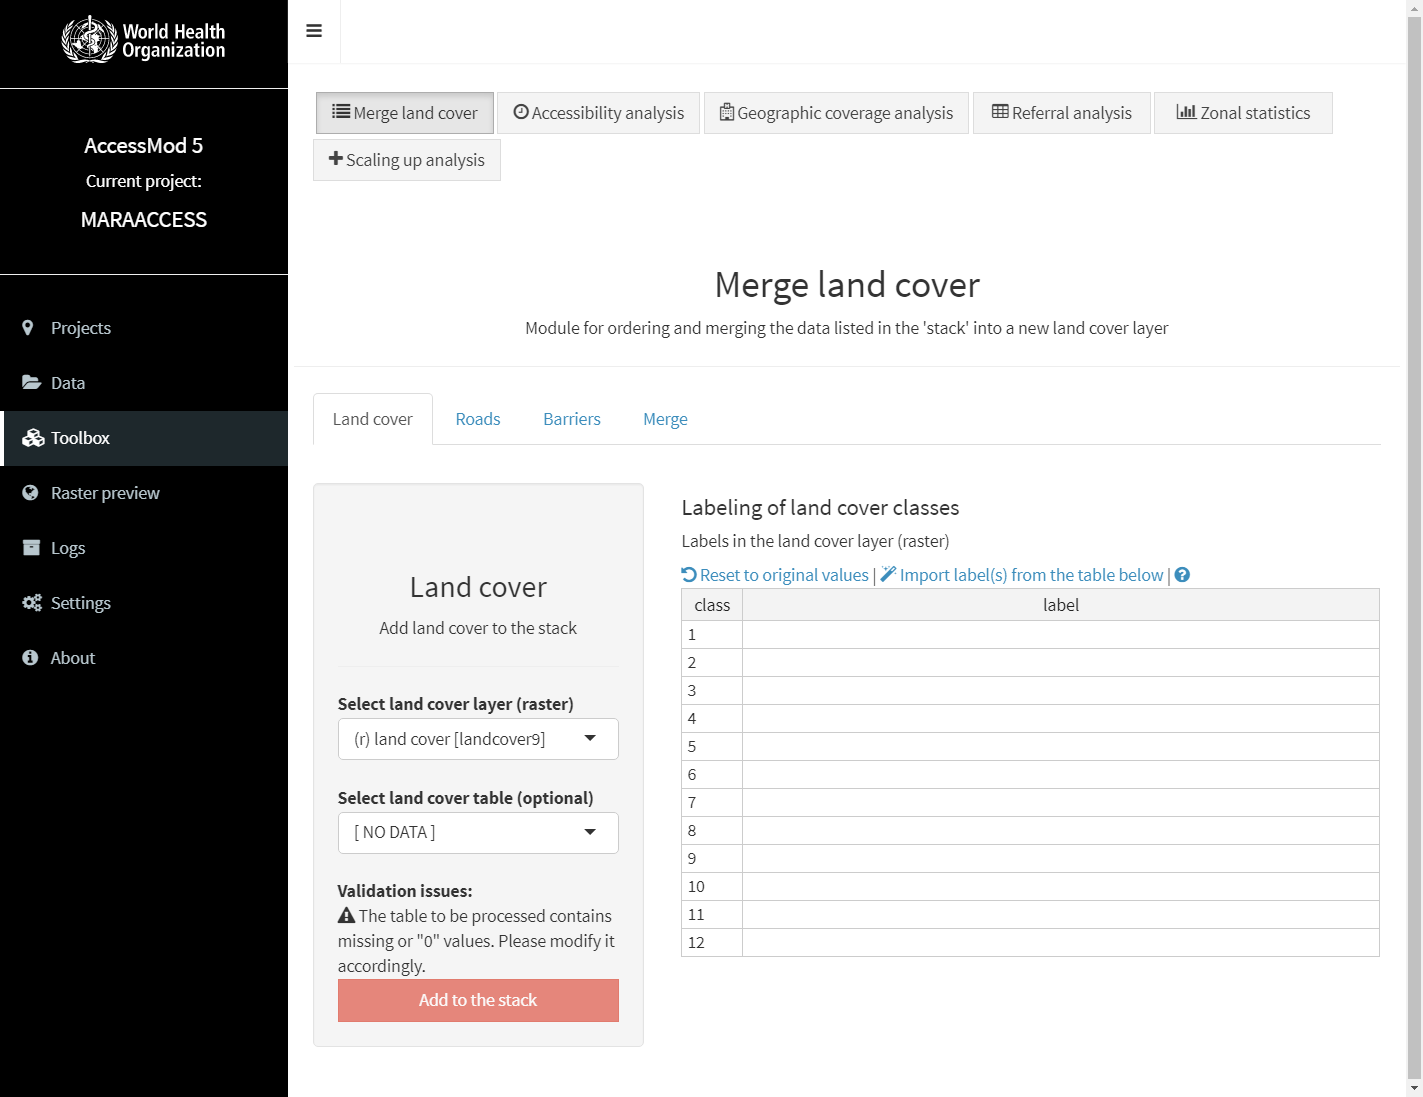
Figure 17. “Validation Issues” for land cover layer
Solution:
Don’t waste time to modifying your landcover raster, but simply manually enter the information in the “label” column, and the error will go away (Figure 18)! Jump back to “Merge Land Cover”.
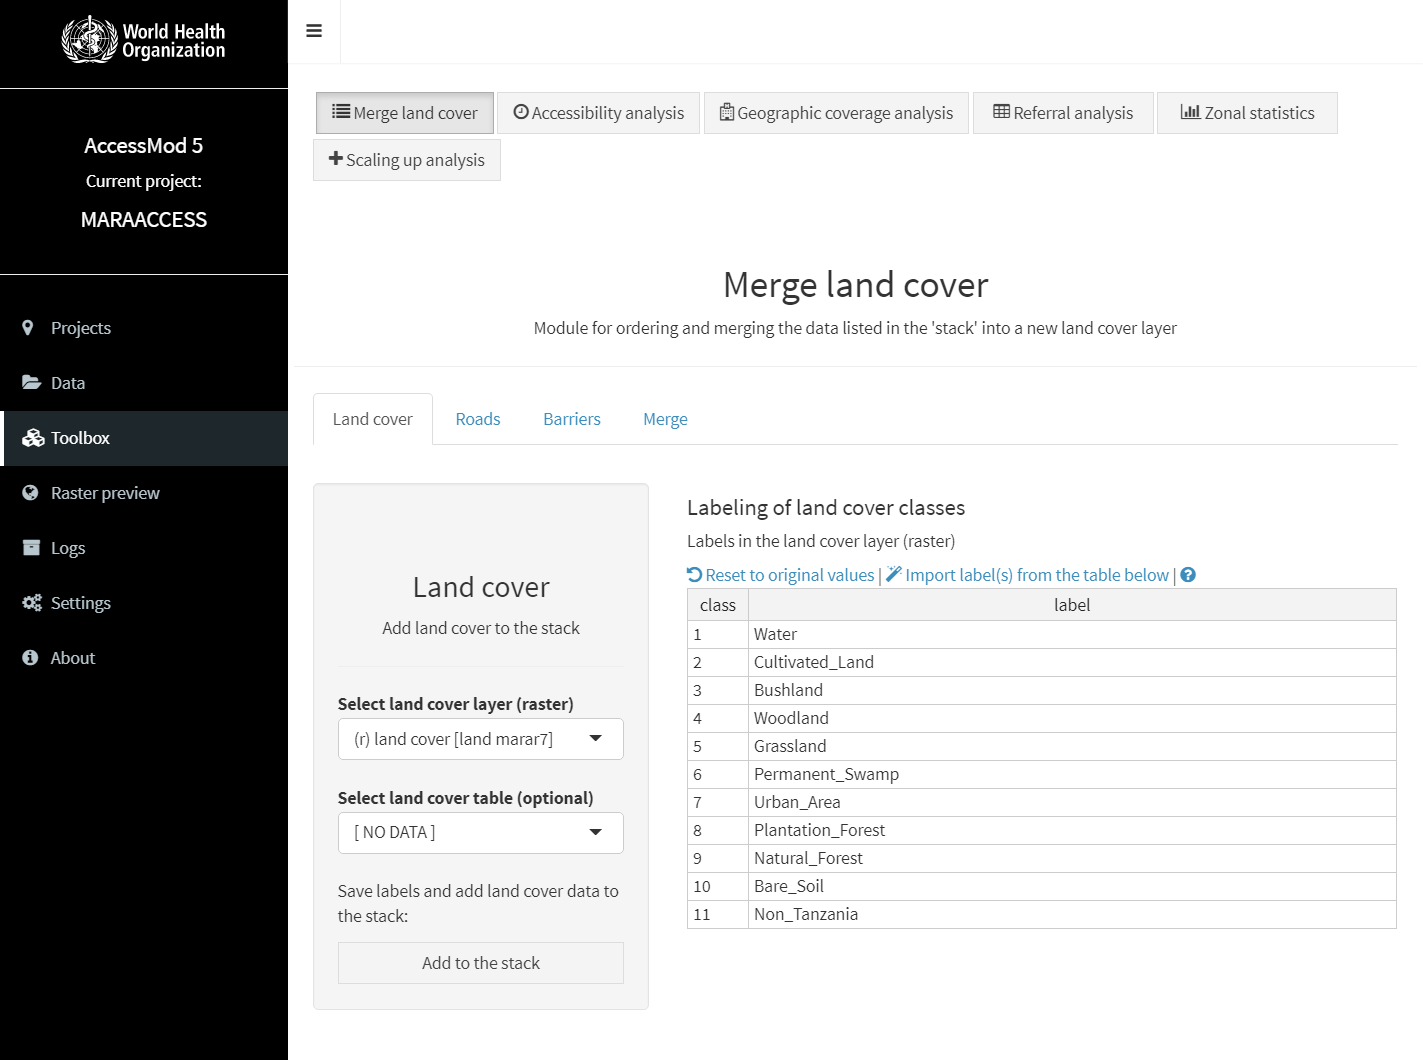
Figure 18. Land cover debug
Through learning AccessMod, I realized how important research is to GIS professionals. Even though I have already known two ways to conduct accessibility research, by reading Munoz and Källestål’s research on modeling access to health care in Rwanda, I learned a better and faster way. The technology world is changing so quickly. The only way to keep pace is to keep learning. In addition, it is very fulfilling to be able to fill in the gaps in documentation for AccessMod 5.
Participate in Summer of Maps
Are you a student that’s looking to grow professionally in a GIS analytics career? Do you want to develop spatial analysis skills in a hands-on learning environment?
Keep an eye out for open application dates later this fall and reach out to us with questions about the program!