
Introducing the Data-Informed Nonprofits Blog Series
“I know data is an important trend, but I just don’t know how to get started. Besides, I have more urgent things to do.” -Head of Programs at a Nonprofit
On the Azavea Data Analytics team, we work a lot with nonprofit leaders who are doing incredible work for their communities. But sometimes when we mention how data can help them achieve their mission, their eyes glaze over. In their mind, data is in that enormous bucket of things that’s a nice-to-have, not a must-have.
So our team sat down with Jessica Cahail, the new project manager of Azavea’s Urban Apps team, to pick her brain about why using data is mission-critical for nonprofit leaders. Jessica joined Azavea this past January after serving as the Director of Administration & Planning at DataArts, a Philadelphia nonprofit that aims to help arts nonprofits become more data-based decision-makers. Jessica’s job, in part, was to make sure that DataArts practices what it preaches, by making sure DataArts was itself data-driven.

So we thought, why not start a blog series on Data-Informed Nonprofits? In this series, we’ll talk to experts and leaders in the nonprofit sector about how they’ve used data to solve their problems and achieve their goals. We’ll cover:
- Case studies of nonprofit role model s you can learn from
- The latest best practices for data analytics and technology from the social/nonprofit sector
- Specific, actionable next steps you can start on today
And who better to start the blog series than Jessica, who helped her nonprofit (and others) become more data-driven? Without further ado, here’s a conversation between Patrick Han and Jessica Cahail.
Upcoming blogs
- Jim Macmillan, School of Media & Communication at Temple University — on his experience using data journalism to map gun violence in Philadelphia (guncrisis.org)
- Carlos Medina, Data Scientist at Charity: water — on the different ways charity: water uses data to optimize their programs
- Stephanie Zidek, Senior Analytics Manager at Feeding America — on how Feeding America using data analytics to identify areas of need and optimize services
Q&A with Jessica Cahail, Azavea – Low-hanging Fruit, Culture, Hiring, and Case Study
Introduction to DataArts
Patrick Han: Hi Jessica. Could you give us some background about your experience at DataArts? What were the goals of your organization, and how did you try to achieve those goals?
Jessica Cahail: Sure. The mission of DataArts is to empower the nonprofit arts and cultural organizations with high-quality data and resources in order to help them improve their vitality, performance, and impact. DataArts exists to help organizations excel at being data-informed decision-makers.
My goal as the Director of the Administration of Planning was actually to ensure that DataArts itself was acting as a data-informed decision-maker. One of the things that I spent the last year working on was formalizing program evaluation, so that we could take information from all the different facets of the organization and get a sense of the impact: what was going well, what wasn’t going well, and where there was room for improvement.
Different Ways to Use Data
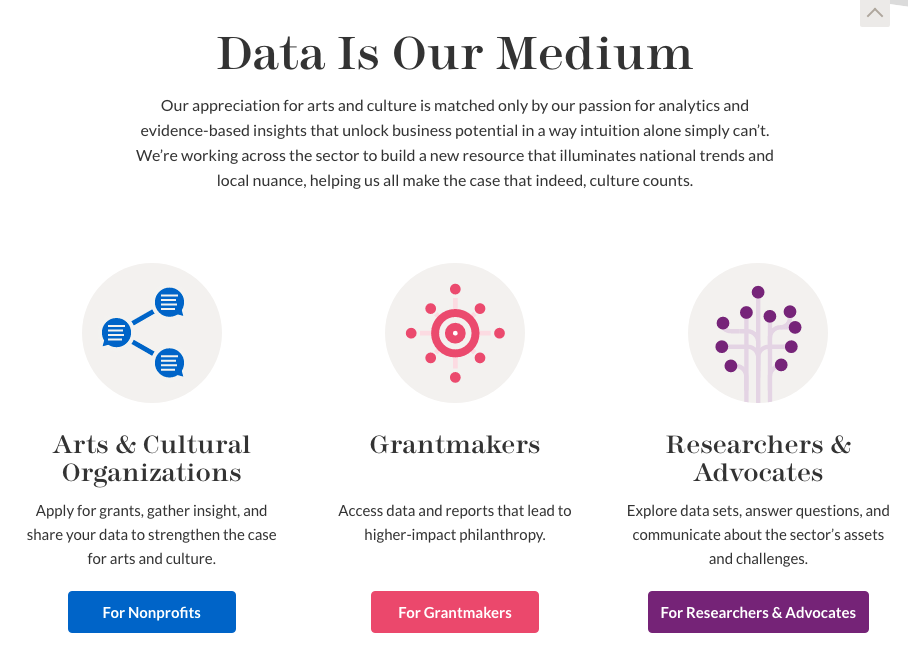
PH: To your point about helping nonprofits become more data-informed decision makers, I imagine a lot of it has to do with internal decision-making, strategy, and optimizing operations. Are there other opportunities for nonprofits to use data?
JC: Yes, there were at least 3 ways we used data.
Funding: One of the main underpinnings of the entire organization is to reduce the burden of applying for grant funding. The nonprofits that are most successful at securing grant funds weave their financial information into their organization’s overarching story and plan.
Board relations: We also really encourage organizations to use the application with their board members. Do your board members actually understand your financials, your capacity, and percentage of tickets being sold for every performance? How involved is your board in your revenue diversification strategy? Do they understand the restriction breakdown of your revenue? It was never a prescriptive thing, more of a suggested way of feeding them information. The DataArts platform actually allows board members to have their own logins so that they can go in and run the reports, and look at all kinds of metrics and ratios without changing the data.
Economic Impact: Information collected by DataArts has been used to create economic impact studies like this one, which illustrates the importance of the industry in Philadelphia. This report, for instance, found that arts and culture contribute $3.3 billion in total economic impact for Philadelphia and support 44,000 full-time equivalent jobs.
The point is to say for every $1 that was fused into the local economy, it created or supported x number of jobs, x number of tax-paying dollars, so on and so forth. One nonprofit alone may not be able to demonstrate such a significant financial impact on a region, but taken as a sector, it’s a huge economic engine.
What are the low-hanging fruit?

PH: Given this network of stakeholders, one concern I kept hearing over and over again at a recent nonprofit conference was, “we’re very constrained on time and budget.” In light of all these different ways to use data to engage with donors, grantmakers, your board, etc, are there certain data use cases that have a higher ROI in the short-term that they should prioritize? What’s the low-hanging fruit for these resource-constrained organizations?
JC: I think the first thing that I would say to an organization that asks me about the ROI of using data, is to get specific. The term data is broad and amorphous, but we–all of us–use a variety of data to make decisions everyday. Should I buy that espresso drink I love on my way into work or drink the mediocre but free coffee in the office? You base your decision on value, time constraints, preference, convenience, etc. (*For the record, Azavea has great coffee).
I would say the key is to making questioning whether or not you have the information you need or want in order to make any given decision as part of your entire organization’s modus operandi. Do you know what services or programs you provide are most valued? Do you know why, and by whom?
PH: If you could recommend only one next action for a nonprofit that is not analyzing the data they already have, what would it be?
JC: The first step is to start collecting the most essential data–who are you serving and how are they impacted? Of course, you need to collect names, addresses, and emails, and if you can, preferences and frequency (e.g., “how many times a year do you come to our events?”). But you also need to know how they feel about what you provide.
If you already have that data, I would encourage you to find patterns. For example, are there patterns in who your services are reaching? Are you primarily serving:
- Community members that live in and around your facility (if you have one), typically during the day?
- People that are coming in from center city, but only on weeknights?
- School-age children, but only during summer break?
What’s the market segmentation of your audience? Then, does that match who you built the program for? Did your assumptions in the beginning match the outcome? If not, were you involving the right people in the planning process? Are there further opportunities you can discover?
The low-hanging fruit is to do a retrospective every time you have a program, project, or event. Be curious as to how it went based on who came, what they got out of it, and which of your program and financial goals were met.
Creating a Data Culture

PH: I want to drill down on this idea that this is a culture issue, that you have to get people at your organization to buy in. I’m curious if you had any suggestions or recommendations around how to get people to buy in.
JC: Data-driven decision-making may be a trendy phrase at the moment, but the concept is not going away–you can’t make decisions without information. Nonprofits are staffed by passionate individuals. Find your passion persons – the people within your organization, or on your board, that are passionate about using data. Harness that power and enable each person on your staff to engage and help determine which data are most important to your organization, your constituents, and your mission. Identify your own data champions, enable them to track the data you’ve identified as important, and plan (and adapt) based on what you learn.
Remember that this is not a project with a start and end date. This is how successful organizations stay relevant to their communities.
PH: You mentioned the champion can often be a board member.
JC: It can. It can be anyone. It can be a volunteer. It does not have to come from the top, and quite honestly, some of the more successful efforts in this way don’t come from the top. The important part is that this person can reach out and build consensus, and keep momentum, and infuse, over the long-term, some of these ideas.
PH: From an organizational structure perspective, how do you approach budgeting for this kind of thing? Like you said, there’s no start and end date. How do you incorporate the cost of this process?
JC: Ideally, this idea is an organizational mindset that everyone embraces. You could do anything from identifying critical data to track to holding monthly retrospective meetings. This means asking questions at these meetings and doling out small assignments so that you can come back together and talk about your findings. Or if it’s a really big, hairy question that requires time, information, and analysis, maybe this is something that you need to get funding for, and you need to find either your donor, your funder, or your pro bono consultant to help you think through these things.
Budgeting for it is difficult when you don’t know the scope. Figure out the scope first, and just start. Ask questions, even if you have a really big question, break it down into a smaller question, and ask that one first.
The Talent Issue

PH: I suppose the alternative to using quantitative data is what they called HiPPO, the “highest-paid person’s opinion.” I think the mindset is often that’s probably good enough for a lot of the operations and programming.
What about quantitative data? I feel like that takes a little bit more hiring, and there’s worry about budget constraints. I’m just curious if there are low-hanging fruit or easy next steps for organizations that don’t have a data analyst.
JC: No one-size-fits-all approach is going to work for all nonprofits. Hiring a data analyst is not a reality for some nonprofits, but I don’t think perfect should be the enemy of the good–you don’t need to be an analyst to start collecting and interpreting data. There were some DataArts participants that tracked the number of volunteer hours they received, which can be critical for those with small or non-existent staffs. That could easily be remedied, using a simple piece of paper, a Google form, or any number of easy-to-use tools.
You should also measure what matters. What kinds of decisions do you need to make? What information do you need to make that decision? Measuring what matters will help you hone in on what kinds of data you should be collecting, or where to start. I think a lot of the organizations that I’ve talked to, they say “I’m so overwhelmed I don’t know where to start.” The answer is pick something small and just start; you’ll find the process of investigative inquiry is rewarding and contagious.
PH: Are there limits to how much data can help, or at least quantitative data?
JC: Yes, there are. When you use quantitative data in a vacuum (with no qualitative data), you’re not looking at the issue holistically. And vice versa.
You will know when you have struck the right chord when you can tell a story with your data that includes both subjective and objective information. For example, “we know our programs are valued because 85% of the 2,000 residents we interviewed felt the program was an integral part of their lives in this historic community.”
Examples of Data-Informed Nonprofits
PH: What are the best examples of data-informed nonprofits that you’ve encountered? What were some best practices that you’ve seen?
JC: The best examples are organizations that identify the important questions, try things, reassess, at some point in the process to figure out if it’s working or not, draw a line in the sand and say, “Okay, we’re done with this for now, and I’m making a decision. I’m going to change something based on what I learned. Or continue doing what I’m doing because I’m sufficiently convinced that it’s working.”
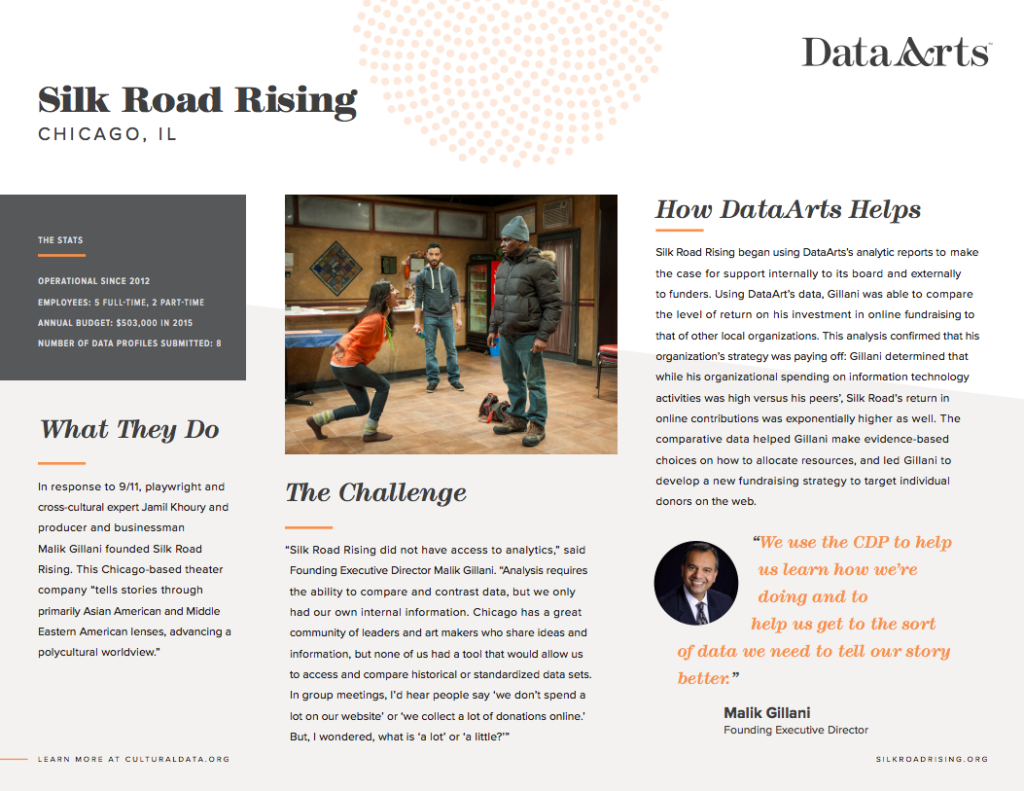
The DataArts website actually has a number of great case studies, but one of them is for an organization called Silk Road Rising. It’s a theater company that puts on plays primarily written by Asian Americans. They started after 9/11, and they wanted to use data to make sure that the investments that they were making in marketing efforts were working.
![]()
They did a lot of data-gathering and figured out that, comparatively, they were spending more than others, but they were also serving a different constituency, and they were getting a pretty sizable return on investment. Their audience numbers were growing, and their reviews were rave. They were using the information, from the start, to figure out what they should be doing, and how they should be moving forward in building their business. They embraced the idea of collecting information related to the questions they were trying to answer.
PH: So it’s not just data-driven decision-making, it’s also about “decision-driven data collection.”
JC: Yes!
PH: Specifically for the arts nonprofits, was there a metric that was really important for that sector?
JC: The performing arts, your ballets, theaters, symphonies, orchestras – they have some shared metrics, such as retention (or churn) of subscribers/members and single ticket buyers. If you are a library, metrics will revolve around patron information and activity, such as how many times they come in and check out books. I would say the one thing that is commonly sought is how many people are you serving, and from which communities.
The Importance of Location Data and Mapping
PH: I know one best practice you advocate for is conducting a feasibility study first before investing tons of resources in order to study how your audience will grow and where your donors will come from. Is there a high potential impact of mapping your constituents, your beneficiaries, whoever you’re serving?
JC: Absolutely. In the arts and cultural nonprofit world, there’s a big conversation about equity, diversity, and inclusivity. A number of funders have started to ask questions about the demographics of the communities being served, as well as the demographics of your staff and board. For some funders, this is not new. Having that understanding is going to be increasingly important in the coming years.

PH: That was extremely helpful, thanks for sharing your insights Jessica!
Take-Aways
- Use decision-driven data collection: First, clarify the questions your organization wants to answer and the decisions you need to make.
- Measure what matters: Then decide what data you need to collect to answer those questions. Start by using Google Forms to collect names, addresses, and emails, and if you can, preferences and frequency (how many times they access your program).
- Have regular retrospective reviews after every program: After every program or event, assess how effective the project or event. Then answer the following questions:
- What’s the breakdown of your audience?
- Does that match who you built the program for?
- Did your assumptions in the beginning match the outcome?
- Did you involve everyone you should have in the planning (or execution)?
- At each retrospective, reassess if the data you’re collecting makes sense: Do you need to add or remove any metrics?
Action Items
- Want to learn about different ways nonprofits can use data with free tools?
- Want to see more content like this about how to become a data-informed nonprofit?
- Visit bit.ly/DAnewsletter to get email notifications about things like future webinars/tutorials
- Don’t know where to start? Check out Map Readiness
- Talk to us at analytics@azavea.com. We can help you develop some project ideas to make your organization more data-driven
Contact Info
- Website: analytics.azavea.com
- Email Newsletter: bit.ly/DAnewsletter
- Twitter: @azavea
- Email: analytics@azavea.com