
This post is part of a series of articles written by 2016 Summer of Maps Fellows. Azavea’s Summer of Maps Fellowship Program provides impactful pro bono spatial analysis for nonprofits, while fellows benefit from Azavea mentors’ expertise. To see more blog posts about Summer of Maps, click here.
A lot of research has gone into finding appropriate ways to define communities and neighborhoods. As geographic units, communities are useful for identifying and understanding spatial patterns. Urban planners often need to divide cities and neighborhoods into distinct groups for development and social objectives. Similarly, health professionals use community units to examine health outcomes in different areas.
As part of the Summer of Maps program, I have been working with The Food Trust to identify different communities throughout Philadelphia. Defining communities is an important part of The Food Trust’s strategy for improving food access, affordability and education in the city. This is a tricky process, though, for it presents some methodological challenges. If communities are not defined through relevant physical or social units or are unreliable, it will be difficult to target Food Trust programming where it is most needed.
Techniques for Grouping and Clustering
I conducted a literature review to explore the various ways in which communities are defined. Many researchers have used buffers and defining features like streets to define neighborhoods. Each method has its own advantages and limitations, and results are largely dependent on the phenomenon being studied. There are also automated approaches that use algorithms to find natural clusters in data. This algorithmic process was chosen for this analysis because I could include specific variables and create boundaries based on their collective similarity.
Using ESRI’S Mapping Clusters Toolset
ESRI’s Mapping Clusters toolset has an exploratory tool that can identify features within a group that are as similar as possible. It can also find groups themselves that are as different as possible. Dubbed Grouping Analysis, this tool’s grouping results are based on the number of groups specified, analysis variables, and optional spatial constraints. Performing multiple iterations of the analysis helps identify an optimal number of groups, as well as a suitable combination of analysis variables.
Analysis variables are generally driven by the research purpose. As we are concerned with food access and food security, only relevant variables like retail density and youth population were used in the Grouping Analysis. All of these variables were parsed into 6 groups, and no spatial constraints were specified in order to maximize feature similarity.
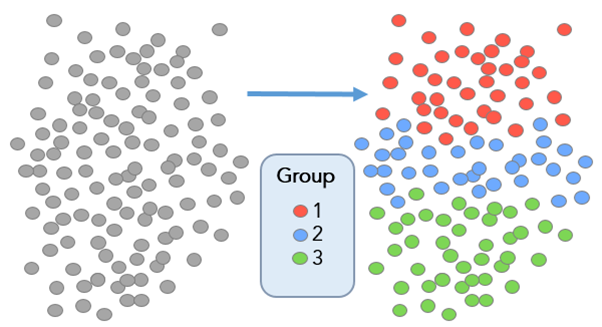
A visualization of ESRI’s Grouping Analysis Tool, image credit: ESRI ArcGIS for Desktop
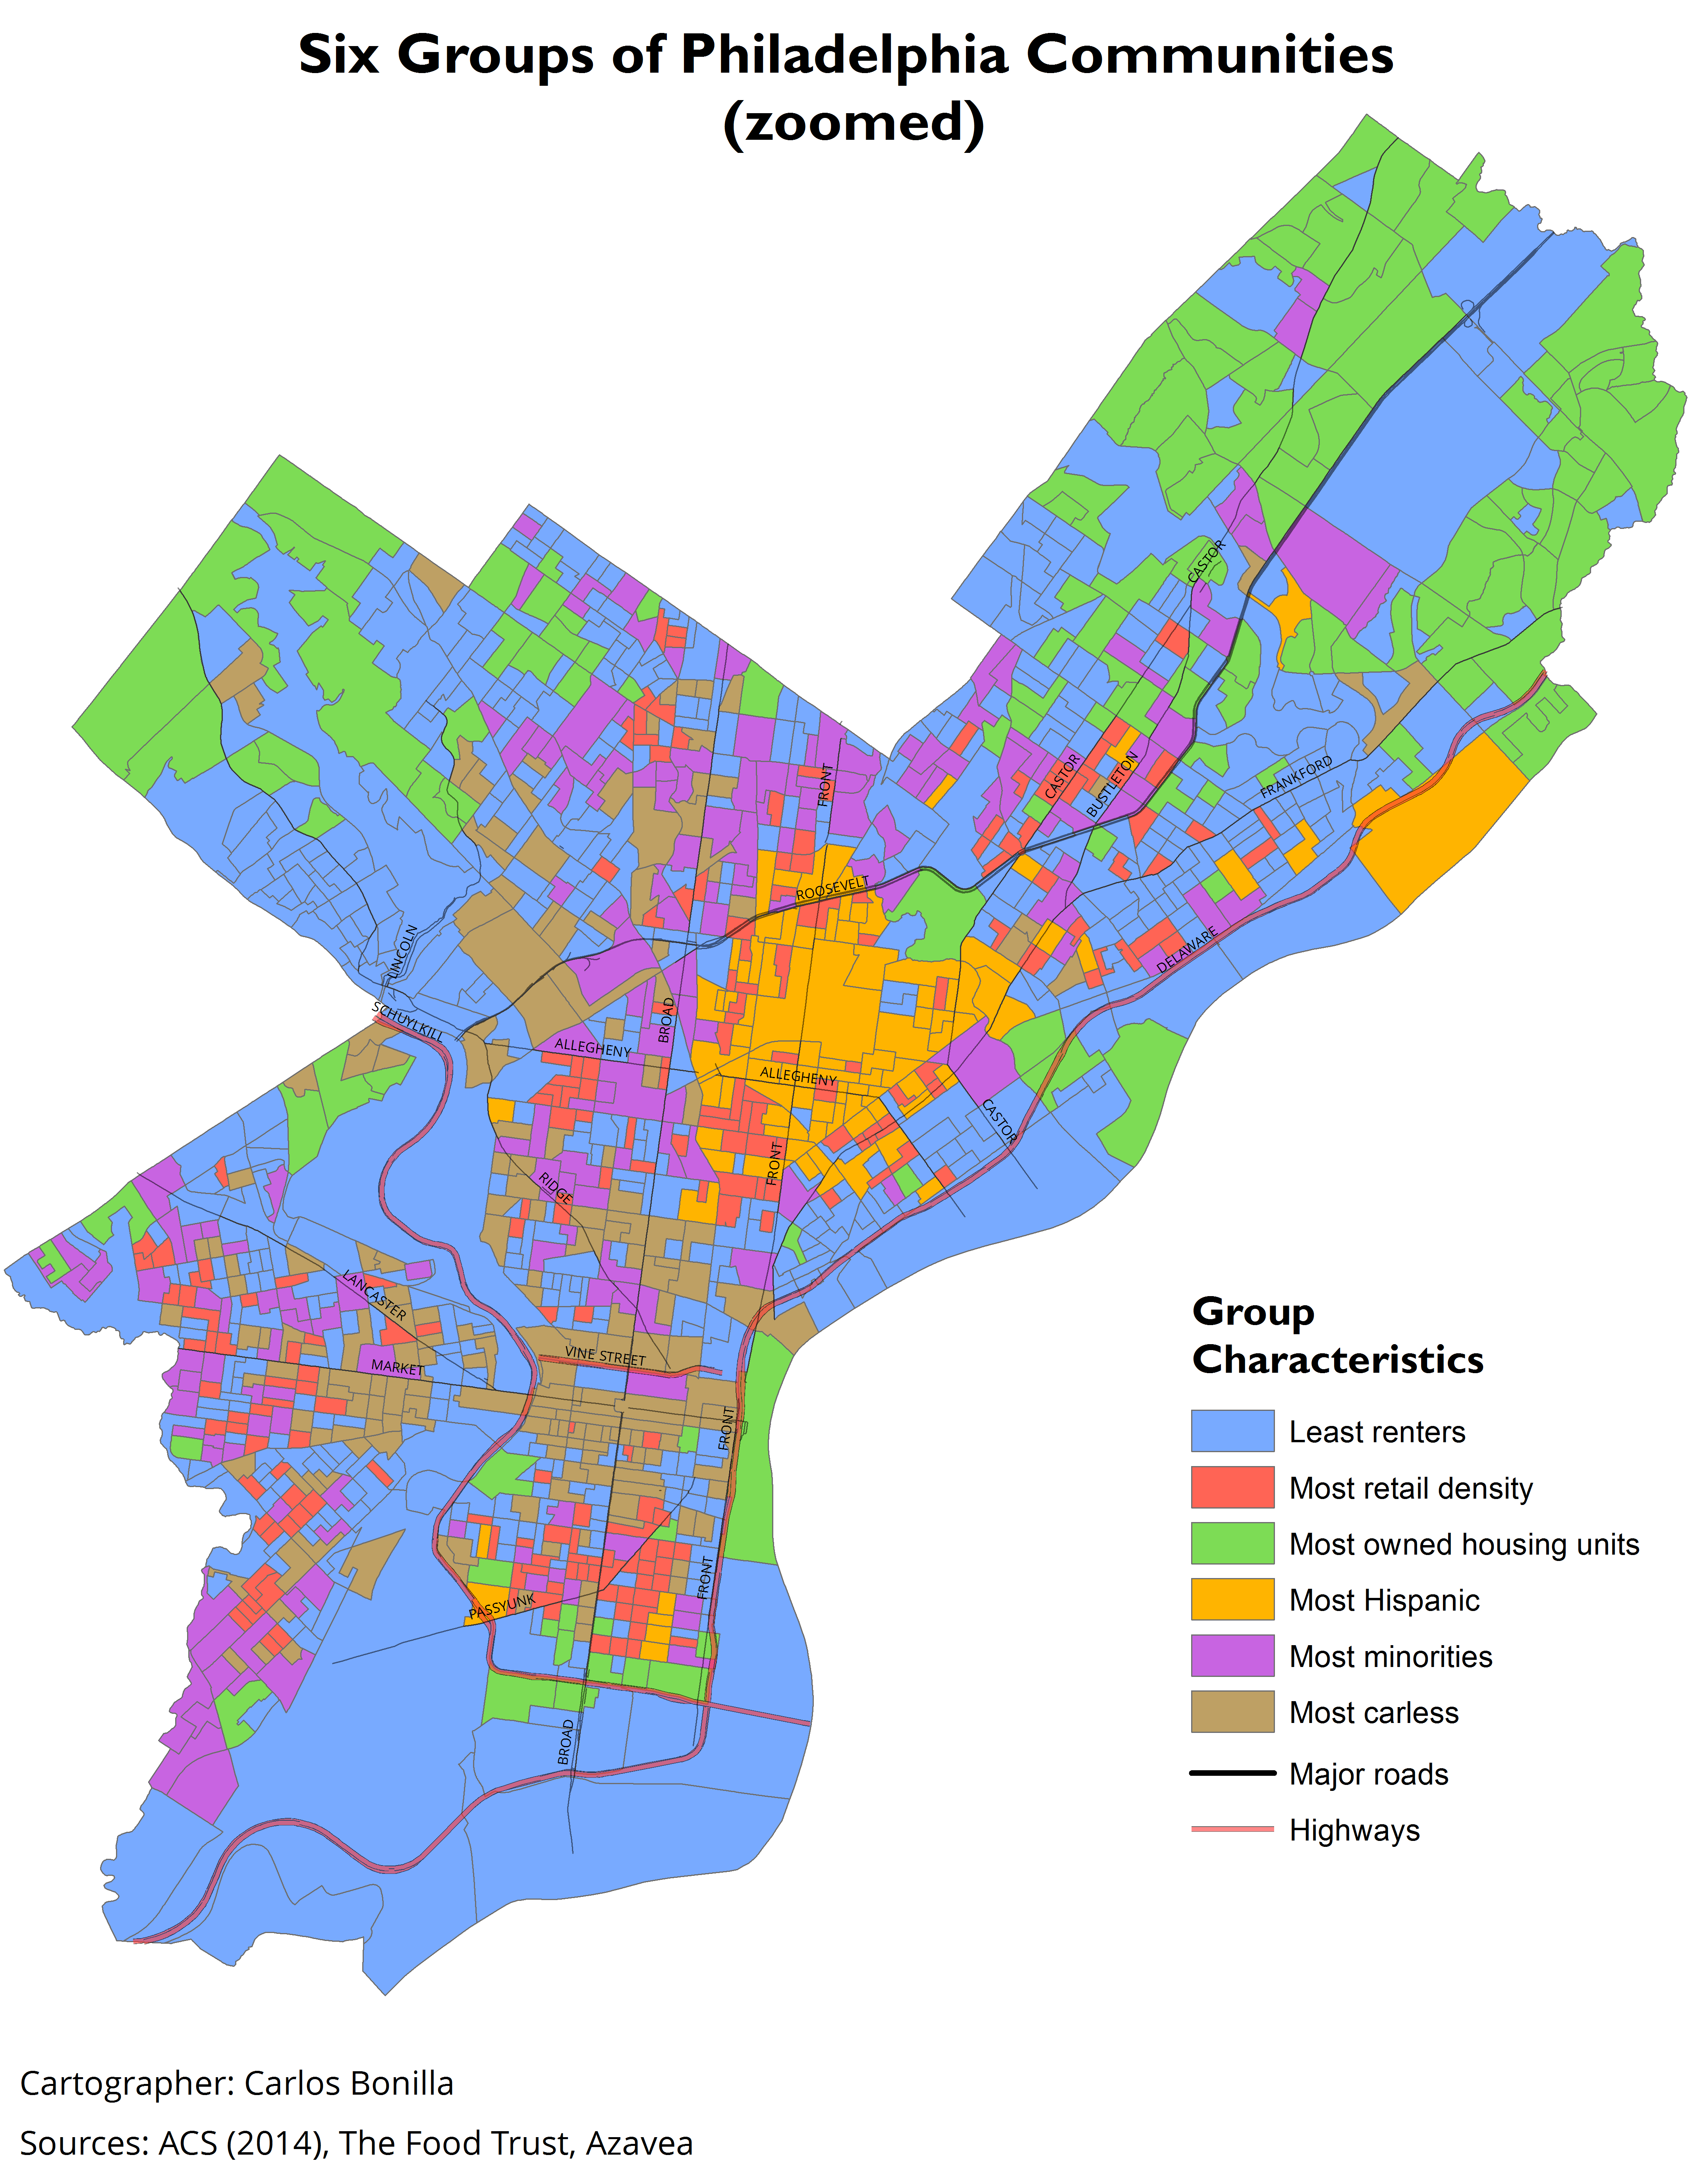
Map of Clustered Communities
Two outputs are created by using the Grouping Analysis tool. The first is a map of the different groups, or clusters, found within the data. The map shows how each area is split into groups that were the most internally similar and externally different. Note that the colors are arbitrary, as the clusters reflect nominal categories.
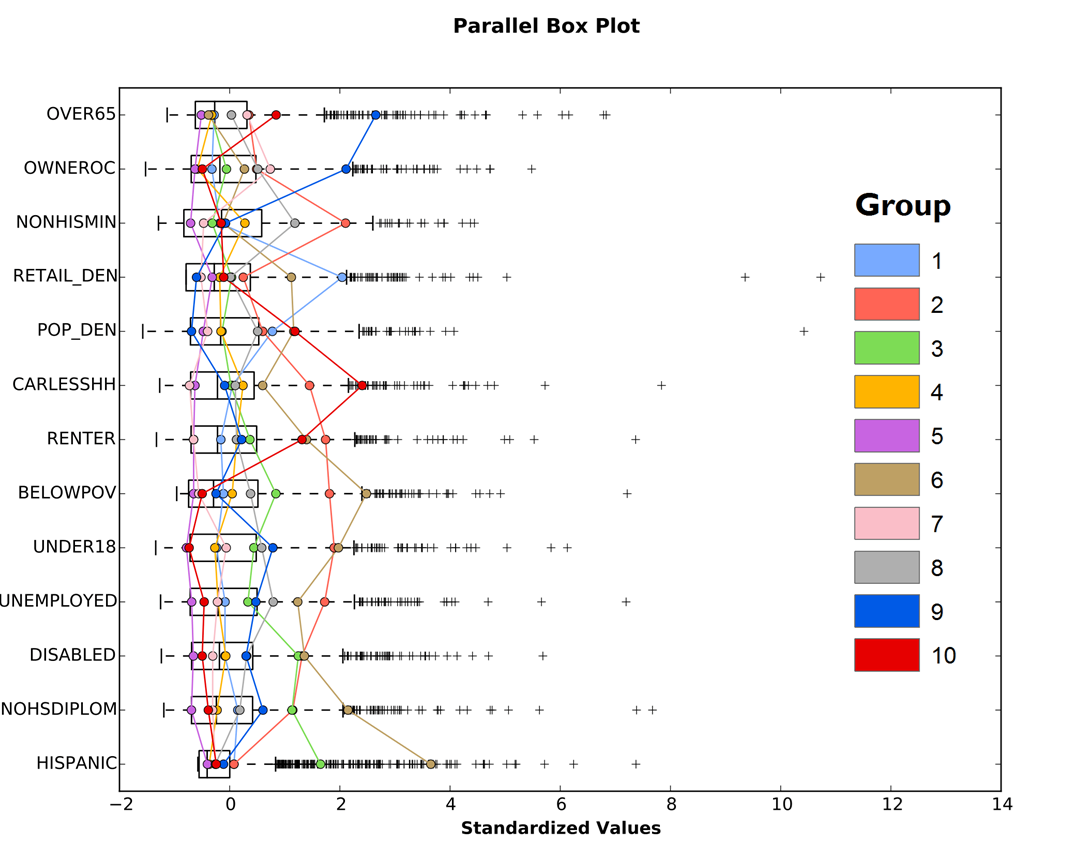
Parallel Box Plot
The second output is a report file that provides statistical summaries of each variable and group. The parallel box plot, below, is a visual summary of both the groups and variables within them.
In this example, the green group reflects block groups with the highest values for elderly population, owner occupied housing units and lowest values for retail and population density.
Similarly, the blue group contains the lowest values for number of carless households and rented housing units. The colors used in this box plot correspond to the colors used in the cluster map, allowing the user to interpret the results.
Powerful Tool with Some Limitations
Grouping Analysis is a powerful tool that can aid with data comprehension. It can group areas of the city into different communities based on a set of quantitative variables. The clusters created within this dataset feature distinct characteristics. Each grouping can help organizations like The Food Trust identify target areas.
However, there are some limitations with this analysis. While it may be able to highlight similar areas and construct boundaries around them, it does not take into account public input and how people perceive their own communities.
Expand your skillset
Are you a student pursuing a career in GIS/geospatial data analytics? Summer of Maps fellows grow their analytical skills in addition to learning important skills related to design, cartography, and even software development.
Keep an eye out for open application dates later this fall and reach out to us with questions about the program!