
Where are all the nonprofits?
We started out with a simple question. Where are all the nonprofits? As a B corporation, It makes sense to work with those that give back to the community, especially those in Philadelphia (Azavea’s birthplace). To help fulfill our triple bottom line of People, Planet, Profit, we created programs like Summer of Maps and Map Readiness, to mentor promising GIS students on pro-bono nonprofit projects and consult with nonprofits looking to more effectively employ data and analysis, respectively.
While there are a number of great tools like Foundation Map, they tend to focus on exploring a certain niche (in this case, foundations) of the nonprofit landscape. What if there were some MASTER LIST of nonprofits one could use to see where all nonprofits are located in the US?
One list to rule them all
Fortunately, my former colleague Sarah Cordivano (Mapadelphia on Twitter) located a list of IRS Tax Exempt organizations (or non-profits) earlier this year. She geocoded each of the four regions of the United States with the included postal addresses and merged them into a single shapefile. And it was a whopper, coming in around 2.25 gigabytes.
However, the data had one major problem: it only included National Taxonomy of Exempt Entities (NTEE) short codes, and not descriptions. Meaning, if you saw a nonprofit with the NTEE code N32, you’d have to use a lookup document from the National Center for Charitable Statistics. I used Import.io on a web version of the list and converted it to a usable CSV. ![]()
Cleaning and Exploring the data
Sarah Cordivano did the original work of appending Latitude and Longitude to the data. The next step I took was to join the NTEE description codes using the Python pandas dataframe.merge(). This attached a more broad NTEE category and specific NTEE code description to every single record with an existing NTEE code in the file. You can see the Python notebook I used to perform this here.
The final CSV with Latitude, Longitude, and NTEE descriptions has 1.5 million records and clocks in around 410 mb. This is clearly too large to use with Excel, so I decided to explore the data with Python and pandas, though this task is also easily accomplished with R or an SQL database. I downloaded the Anaconda distribution of Python, which includes a ton of scientific and data analysis packages, as well as the handy Juptyer Notebook. ![]()

Slicing the data
I wrote a summary function in python that will just take a city and state (in all caps) and display descriptive statistics and a graph: summarizeCity(CITY, ST)
def summarizeCity(city,state):
 # Set up all the output stats, pivot table to be used
 print(city,state)
 summary = data.loc[(data["CITY"] == city) & (data["STATE"] == state)]
 print("\nNarrowed to city / state\n")
 print(city,state,"has",len(summary),"nonprofits")
 print("Median ASSETS:",summary["ASSET_AMT"].median())
 print("Median REVENUE:",summary["REVENUE_AMT"].median())
 print("Median INCOME:",summary["INCOME_AMT"].median())
 print('\nTop 10 Nonprofit Categories by Asset Amount')
 pivot = summary.pivot_table(index="category",values="ASSET_AMT", aggfunc=[len,np.median]).sort_values('len',ascending=False)
 print('\n',pivot.sort_values(by=['len','median'],ascending=False).head(10))

 # Set the plot style
 sns.set(style='darkgrid')

 # Initialize the matplotlib figure
 f, ax = plt.subplots(figsize=(5, 8))

 # Plot the data
 sns.set_color_codes("pastel")
 sns.barplot(x="median", y='category', data=pivot.reset_index().sort_values('median',ascending=False).head(10),label="Median", saturation=0.5)

 # Add a legend and informative axis label
 ax.legend(ncol=1, loc="center right", frameon=True)
 ax.set(ylabel="",xlabel="Top 10 Nonprofit Categories by Median Revenue")
 sns.despine(left=True, bottom=True)
Running summarizeCity('PHILADELPHIA','PA') results in some descriptive statistics, as well as a graph like: 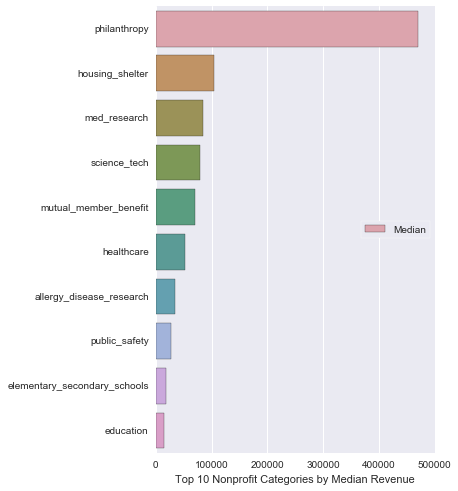
What are the top 10 recreational social / pleasure clubs by yearly revenue?
bigclubs = data[data['category']=='religious'].sort_values(by='REVENUE_AMT',ascending=False).groupby('STATE').head(10)
Florida leads the nation with six of the top ten ‘leisure clubs’ (which appear to be country clubs) by assets in the country, but the Desert Mountain Club in Scottsdale leads the asset charge with a whopping $137,530,112 in its coffers.
| NAME | ASSET_AMT | CITY | STATE |
|---|---|---|---|
| DESERT MOUNTAIN CLUB INC | 137530112.0 | SCOTTSDALE | AZ |
| LANDINGS CLUB INC | 53269967.0 | SAVANNAH | GA |
| BROKEN SOUND CLUB INC | 68594372.0 | BOCA RATON | FL |
| BALLENISLES COUNTRY CLUB INC | 79329432.0 | PALM BCH GDNS | FL |
| BONITA BAY CLUB INC | 64691302.0 | BONITA SPGS | FL |
| MYERS PARK COUNTRY CLUB INC | 29824881.0 | CHARLOTTE | NC |
| COUNTRY CLUB OF BIRMINGHAM | 27003229.0 | BIRMINGHAM | AL |
| KINGS POINT RECREATION CORPORATION INC | 14378625.0 | DELRAY BEACH | FL |
| SHADOW WOOD COUNTRY CLUB INC | 25689419.0 | BONITA SPGS | FL |
| WYCLIFFE GOLF AND COUNTRY CLUB INC | 48406272.0 | WELLINGTON | FL |
What are the top ten animal nonprofits in California?
biganimals = data[(data['category']=='animal') & (data['STATE']=='CA')].sort_values(by='REVENUE_AMT',ascending=False).head(10)
Fresno’s Chafee Zoo Corporation is far and away the largest animal-focused nonprofit in California, with almost seven times as much money as the next wealthiest nonprofit.
| NAME | CITY | STATE | ASSET_AMT | INCOME_AMT | REVENUE_AMT |
|---|---|---|---|---|---|
| FRESNOS CHAFFEE ZOO CORPORATION | FRESNO | CA | 66448447.0 | 41847631.0 | 41629807.0 |
| WILDLIFE CONSERVATION NETWORK INC | SAN FRANCISCO | CA | 9459637.0 | 14331912.0 | 11696816.0 |
| WILDAID INC | SAN FRANCISCO | CA | 9757198.0 | 10080046.0 | 9761533.0 |
| NATIONAL MARINE MAMMAL FOUNDATION INC | SAN DIEGO | CA | 2435400.0 | 8415069.0 | 8415069.0 |
| MERCY FOR ANIMALS | LOS ANGELES | CA | 5313113.0 | 5204093.0 | 4986012.0 |
| CALIFORNIA WATERFOWL FOUNDATION | ROSEVILLE | CA | 4416074.0 | 4246261.0 | 4246261.0 |
| HERCULES RESCUE FOUNDATION | STUDIO CITY | CA | 3519747.0 | 6064170.0 | 3738148.0 |
| HOPE FOR PAWS | LOS ANGELES | CA | 853853.0 | 3324111.0 | 3324111.0 |
| LEWA WILDLIFE CONSERVANCY USA | MILL VALLEY | CA | 6983050.0 | 3098196.0 | 3035922.0 |
| SPAY NEUTER PROJECT OF LOS ANGELES INC | SAN PEDRO | CA | 248574.0 | 3024735.0 | 3024735.0 |
Mapping the data
Since almost all records have latitude and longitude, they can be mapped easily. Let’s look at the top ten animal nonprofits by Assets per state across the US, instead of just California:
biganimals = data[data['category']=='animal'].sort_values(by='ASSET_AMT',ascending=False).groupby('STATE').head(10)
And here’s a CARTO map:
We can see that the types of animal nonprofits differ in both popularity and assets across the country, with animal protection and welfare popular in the midwest, and zoos and wildlife preservation more prominent on the coasts.
Getting the data
There’s a lot more than can be done with 1.5 million records of nonprofit data. What would you like to find out? Do your own analysis–visit https://github.com/TDahlberg/nonprofit_data and follow the directions in the repository to download the data. Then use your power tool of choice (Python, R, Postgres…just not Excel) to explore away.