Skip to content
Azavea
  • What We Do
  • Research
  • About
  • Blog
  • Careers
  • Contact Us

Spatial Analysis

Getting Started Exploring All 1.5 Million Nonprofits in the US

By Tyler Dahlberg on August 18th, 2016

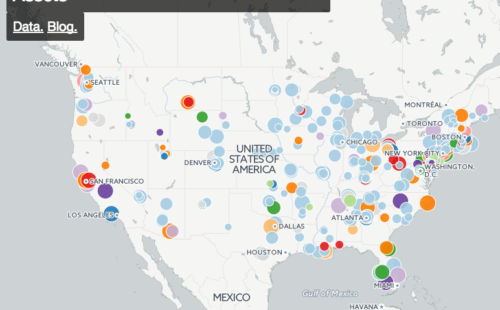
Where are all the nonprofits? We started out with a simple question. Where are all the nonprofits? As a B...

Spatial Analysis

Serving Local Mapbox Vector Tiles with Docker

By Tyler Dahlberg on June 27th, 2016

Why Would I Want to Use Docker to Serve Local Mapbox Vector Tiles? You really want a custom vector tile...

Spatial Analysis

Announcing Azavea's Nonprofit Map Readiness Program

By Tyler Dahlberg on January 26th, 2016

Where are more potential clients? How do we prioritize which service locations to improve? What programs do we choose to...

Spatial Analysis

Using PostGIS to Summarize Philadelphia Inspections Data

By Tyler Dahlberg on January 7th, 2016

Summer of Maps Fellow Nat Henry wrote a Python script to collect the entire universe of available Philadelphia License and...
Photo of Chicago Loop elevated trains

Spatial Analysis

Calculating Daytime Population at the Census Tract Level for the Entire US

By Tyler Dahlberg on October 21st, 2015

What is daytime population? Despite official estimates, many parts of the US have populations that vary wildly from day to...
CensusReporter.org map displaying Minneapolis, MN

Spatial Analysis

How to Get Census Data for Maps in 5 Steps

By Tyler Dahlberg on August 25th, 2015

Census Data Doesn’t Have to Be Difficult One of the largest and best free sources of data in the US...
  • 1
  • 2
  • 3
  • Next
azavea-logo-white
990 Spring Garden,
5th Floor
Philadelphia, PA 19123
(215) 925-2600
Contact Us

Company

  • About
  • What We Do
  • Research
  • Careers
  • Blog
  • Press

Services

  • Software Engineering
  • Data Analytics
  • User Experience Design
  • Big Data Processing
  • Machine Learning
  • R&D

Newsletter

Stay in touch, spam-free. Sign up
B Corporation logo.
Terms of Use • Privacy Policy • Directions
© 2023 Azavea