
GTFS stands for General Transit Feed Specification. It is a simple set of files that represent the network and schedule for a transit system. Many of us use it every day, as it powers web and mobile transit routing apps like Google Transit. This relatively new specification (started in late 2006) has rapidly become both widespread and important, and it is now being adopted by transit agencies around the world.
GTFS is a multi-dimensional specification that is still evolving and driven by active development and planning communities. Its rapid proliferation as a de facto standard is already enhancing use, planning and analysis as well as supporting the development of software tools that can leverage its ubiquity. This includes software like OpenTripPlanner, Azavea’s GeoTrellis-Transit toolkit, and a global catalog of GTFS data sources.
The Basics: It’s not so basic
The unassuming set of comma-delimited text files that comprises GTFS data appears simple at first. There are six required tables (text files) and seven optional ones. The tables are related by common identifiers, and two of the tables contain coordinate pairs. Simple, right? Not so much. The attributes of real transit systems represented by these tables –such as trips, fares, pick-up types, whether or bicycles are allowed on board or not — are incredibly complex!
When I first examined the tables, I approached them as a geographer, and quickly realized there was a lot more going on. There are files for “stop locations” and “route paths” but these reveal only two dimensions. GTFS must also account for stop times and organize these stop times into trip patterns, and then those patterns into routes. Oh, and bear in mind that the patterns are different on different days – not just the schedule changes, but sometimes the paths as well. They also must account for different fare rules and transfer rules, too. And don’t forget that some stops are shared among routes, and that paths overlap as well. I think it’s at least seven-dimensional. But it’s hard to think in seven dimensions.
I am wholly impressed by the community that developed this simple, flexible model for such a complex system.
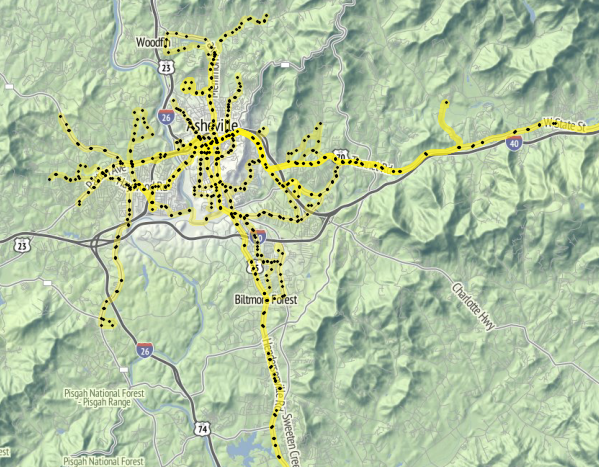
Asheville, NC – Bus stops and routes from GTFS data
Strictly Flexible
One of the strengths of the specification is that it is designed to accommodate transit systems that operate very differently. It has to support transit systems from Portland’s TriMet to Manila’s multiple transit systems (serving a population greater than New York City). There are sometimes multiple ways to represent how a system works that fit within the specification, and it’s open enough for agencies to augment the attribute fields to fit their needs. So when developing against GTFS data, it’s important to always keep the data’s inherent structural complexity in mind.
Our Work with GTFS
I’m currently working out methodologies to calculate a number of performance and accessibility metrics based on GTFS, road network, and population data to support an international open source software development project. I’ve really been enjoying my days delving through different GTFS feeds and exploring them in a PostGIS database, and am looking forward to implementing this work with Azavea developers.
This isn’t the first time we’ve worked with GTFS. Daniel McGlone wrote a great blog post about an analytics project earlier this year.
The GeoTrellis team recently released GeoTrellis Transit, an API for calculating multi-modal travel sheds. The GeoTrellis team put together a blog article describing the toolkit in more detail.