
This Raster Vision release brings new features, improved documentation, and an entirely new way to use Raster Vision. If you found Raster Vision too inflexible in the past, we invite you to give it another try!
We highlight some major changes below. For a full list of changes, see the changelog.
Highlights
Raster Vision is now also a library
Raster Vision has historically been a kind of low-code framework where users could configure a full pipeline in one go and then execute it all at once (or in stages). While this has obvious advantages for some workflows, it also brings with it the usual drawbacks of frameworks. Specifically, in Raster Vision’s case, the framework paradigm made it too inscrutable and, thus, harder to debug, customize, and extend.
Based on these concerns, and the trajectory of other similar projects in the past, we undertook a major refactoring effort to make Raster Vision also usable as a library from which users can pick individual components and use them to build new things.
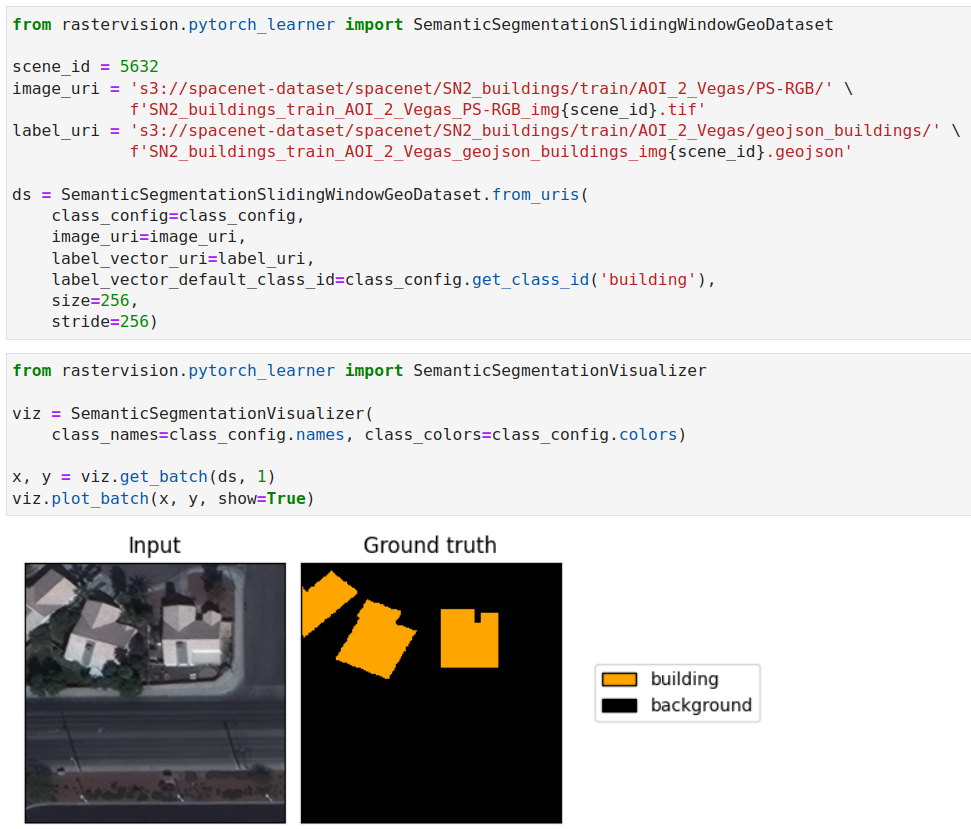
One major benefit (and indeed one of the motivations) of this is that Raster Vision can now be used in Jupyter notebooks!
Another, even bigger, benefit is that you can now combine Raster Vision with Lightning (or other machine learning libraries) allowing you to use the latest and greatest in machine learning techniques while letting Raster Vision handle the geospatial data reading and writing.
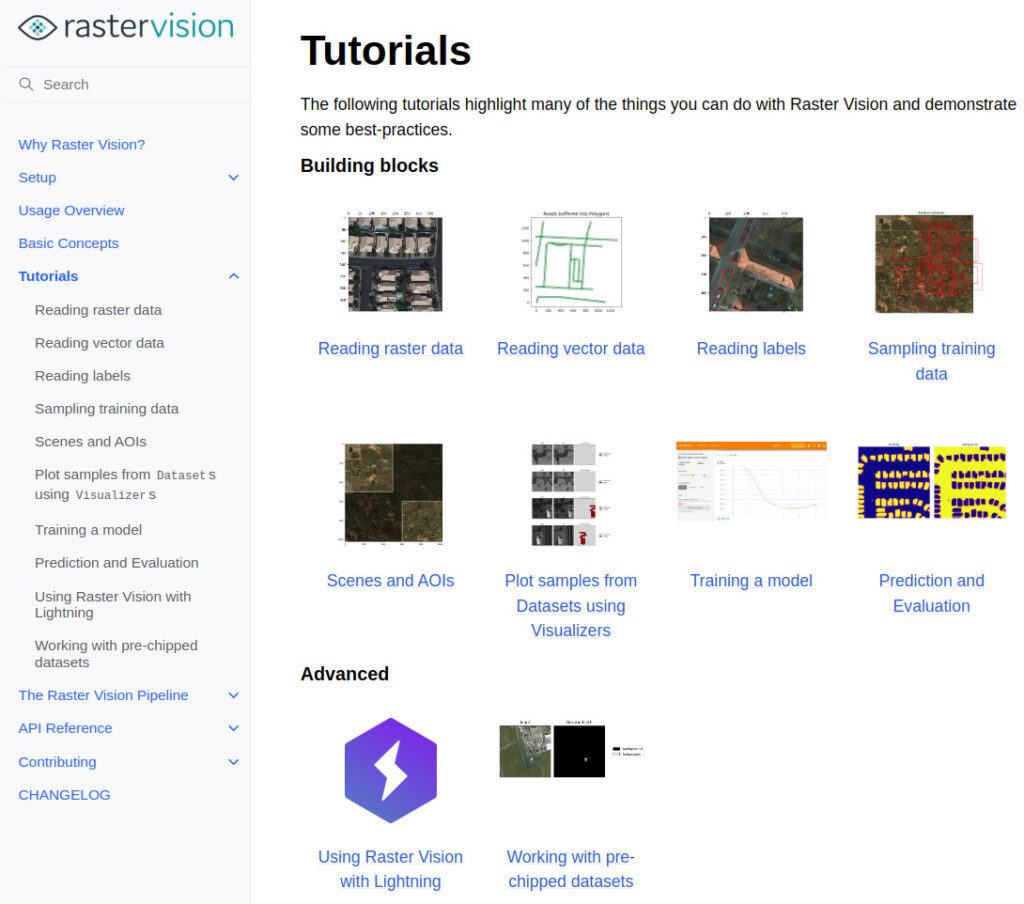
Improved documentation and tutorials
In this release, we have also significantly improved Raster Vision’s documentation. Most notably, it now contains detailed tutorial notebooks as well as a full API reference. The documentation for the Raster Vision pipeline, which used to make up most of the project’s documentation in previous versions, is now located in The Raster Vision Pipeline section.
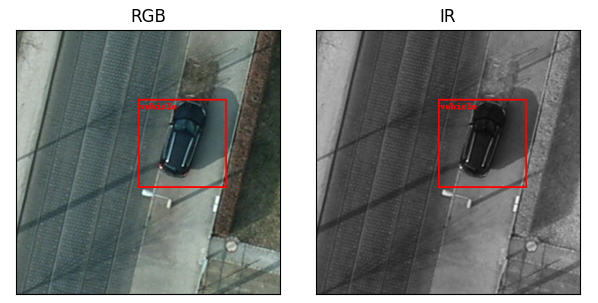
Support for multiband imagery and external models extended to all computer vision tasks
In version 0.13, we introduced the ability to use multiband imagery for semantic segmentation. This functionality has now been extended to chip classification and object detection as well.
Similarly, the ability to use external models has been extended to object detection where it was previously missing.
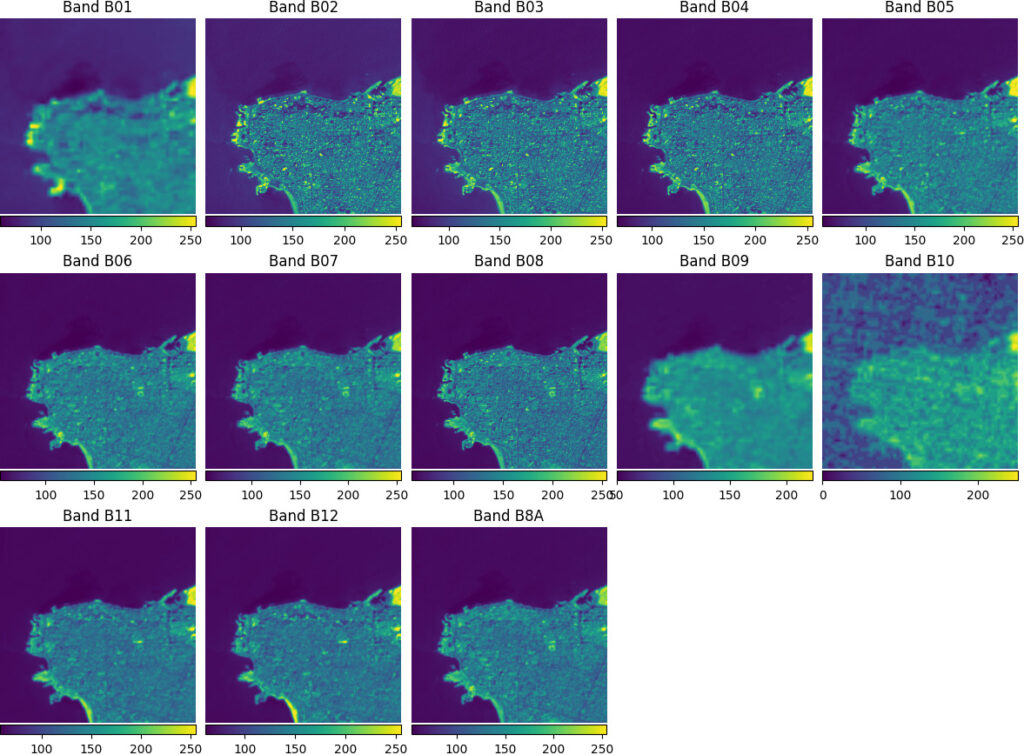
Improved data fusion
Raster Vision can now combine bands from multiple sources of raster data even if they have different resolutions and extents.
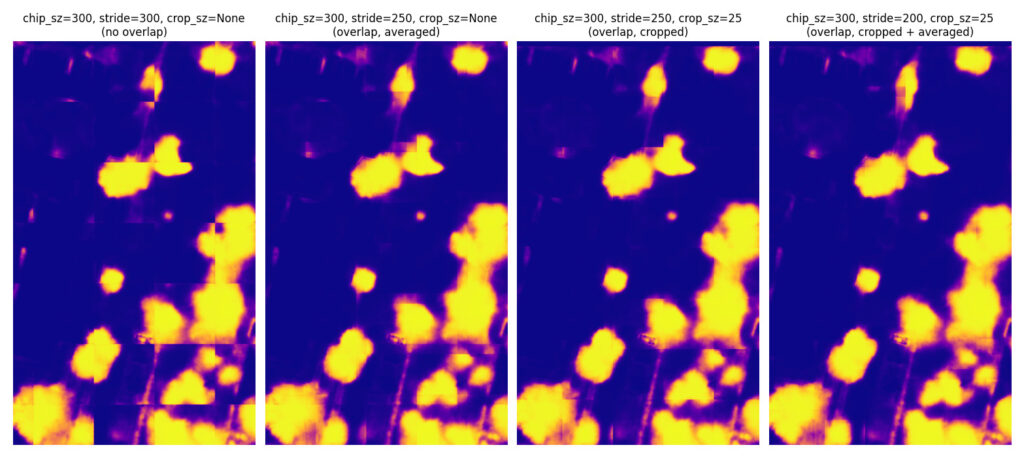
Cleaner semantic segmentation output
You can now discard edges of predicted chips in semantic segmentation in order to reduce boundary artifacts. This technique can be used in addition to the previously introduced ability to average overlapping regions in adjacent chips.
Miscellaneous quality-of-life improvements
We have added progress-bars to all downloads and uploads as well as other time-consuming operations that take longer than 5 seconds so you no longer have to wonder whether Raster Vision is stuck. You will also notice significant speedups due to fewer downloads compared to older versions thanks to better caching.
Useful links
For more information, and to get started using Raster Vision, view the resources below.
Website: https://rastervision.io/
GitHub repo: https://github.com/azavea/raster-vision
Documentation: https://docs.rastervision.io/en/0.20/index.html
Tutorials: https://docs.rastervision.io/en/0.20/usage/tutorials/index.html
Changelog: https://docs.rastervision.io/en/0.20/changelog.html#raster-vision-0-20