Population outside “housing units”
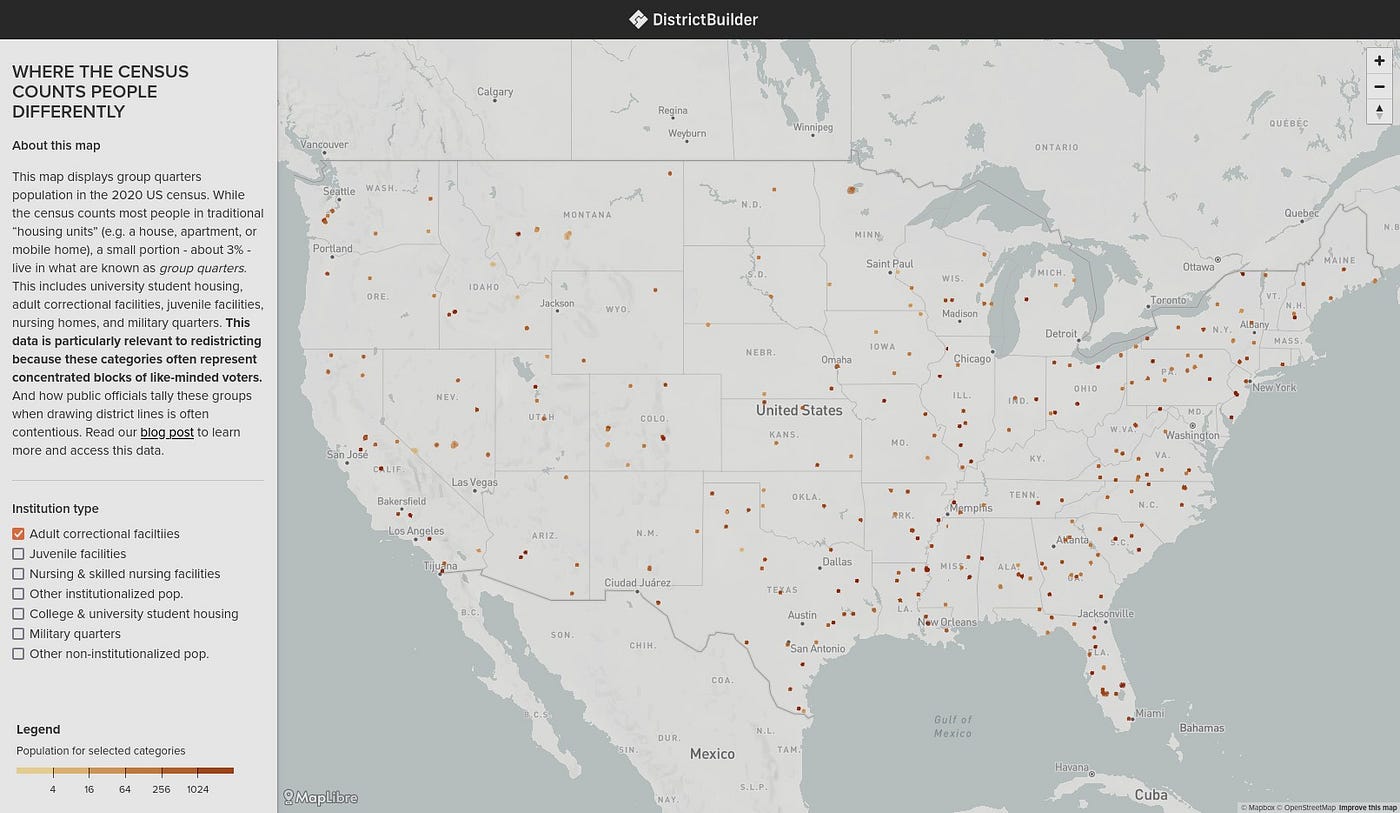
The US Census counts most people in their residence (e.g. a house, apartment, or mobile home) using the household survey. However, a small portion of the population lives outside traditional housing units and is counted differently. Roughly 3% of the US population is counted in the group quarters count, which tallies the number of people living in places like university housing, correctional facilities, and nursing homes.
The process behind the group quarters count is different from the household survey. While the household survey is primarily filled out by families, in the group quarters count, census bureau officials work with administrators of group facilities to arrive at the population tallies. This process was particularly challenging amidst the coronavirus pandemic when many facilities failed to provide timely data.
Redistricting implications
The constitutional basis for conducting the decennial US Census is the reapportionment of the US House of Representatives. The same census data is also used to support the redistricting of many state and local legislatures as well. The group quarters count is particularly relevant to drawing district boundaries because the data often represents concentrated blocks of like-minded voters.
As is well documented, too often politicians who control redistricting will carve boundaries to punish opponents and protect their own interests. How public officials tally the populations enumerated in the group quarters count when drawing district lines is often a contentious topic. For example:
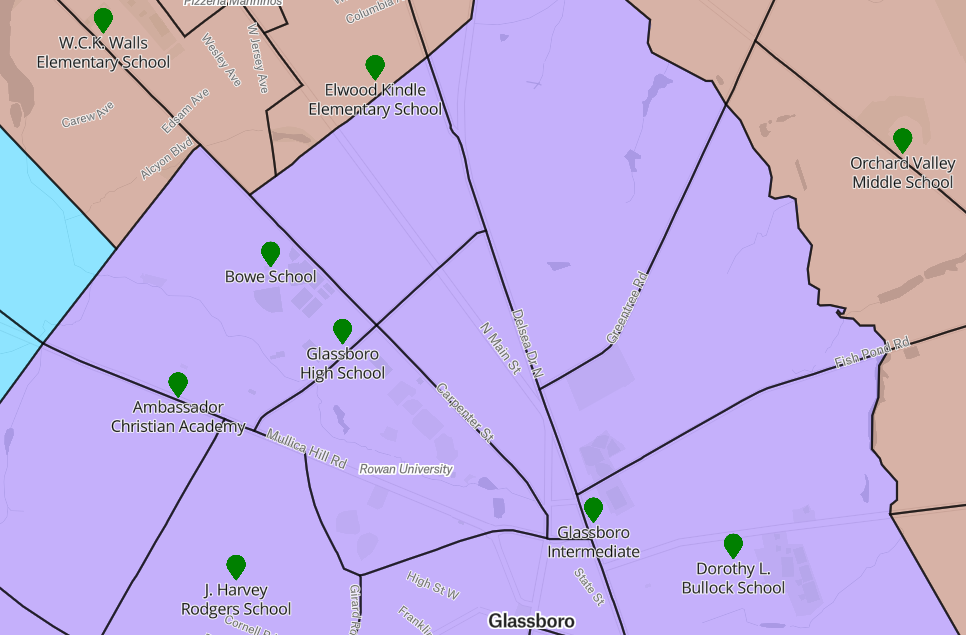
- College campuses are prime targets for gerrymandering. The Institute for Democracy and Higher Education at Tufts University found that campuses serving large minority student populations are 1.8 times more likely to be packed or cracked in Congressional boundaries. The IDHE also created this tool for visualizing the student population in 2020 census data.
- In a practice known as “prison gerrymandering”, many states assign incarcerated adults to their correctional facility rather than their home community for the purposes of redistricting.
In this graphic, we display the group quarters population data from the 2020 decennial census. While these counts do not tell a full story, we believe visualizing them in this format can help increase transparency and public understanding of the census data behind these redistricting conversations.
Click here to view the interactive map
Use this data in DistrictBuilder
DistrictBuilder is a tool for drawing district maps and evaluating redistricting plans. You have the option to start your own map from scratch or upload a current or proposed district plan drawn by public officials. As you work on the map or after you finish, DistrictBuilder has tools to help you evaluate the fairness, compactness and partisan balance of the boundaries.
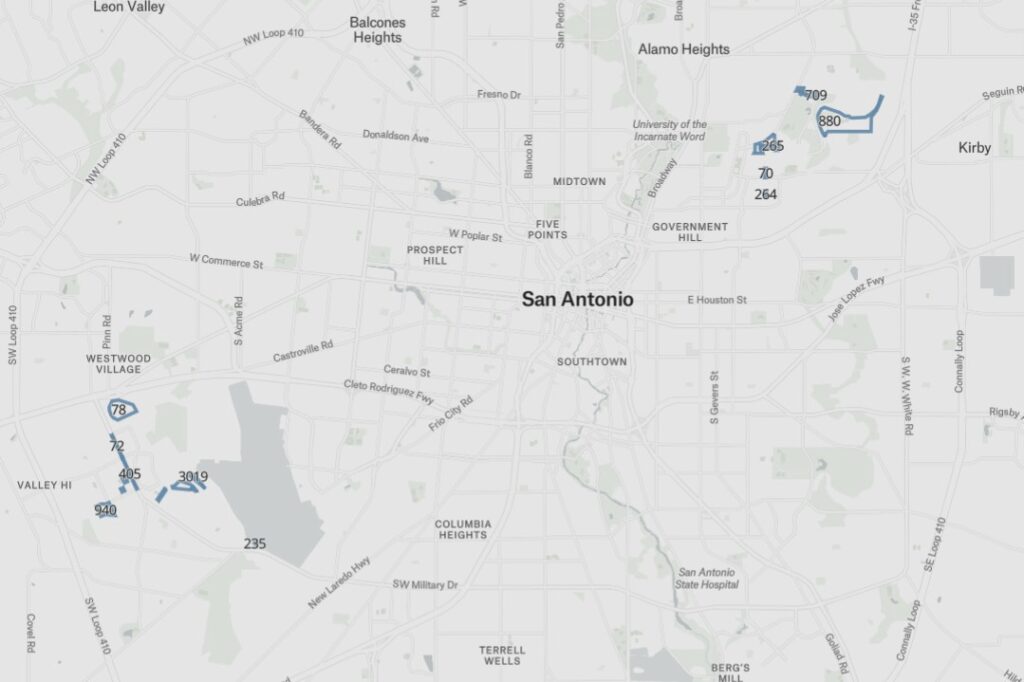
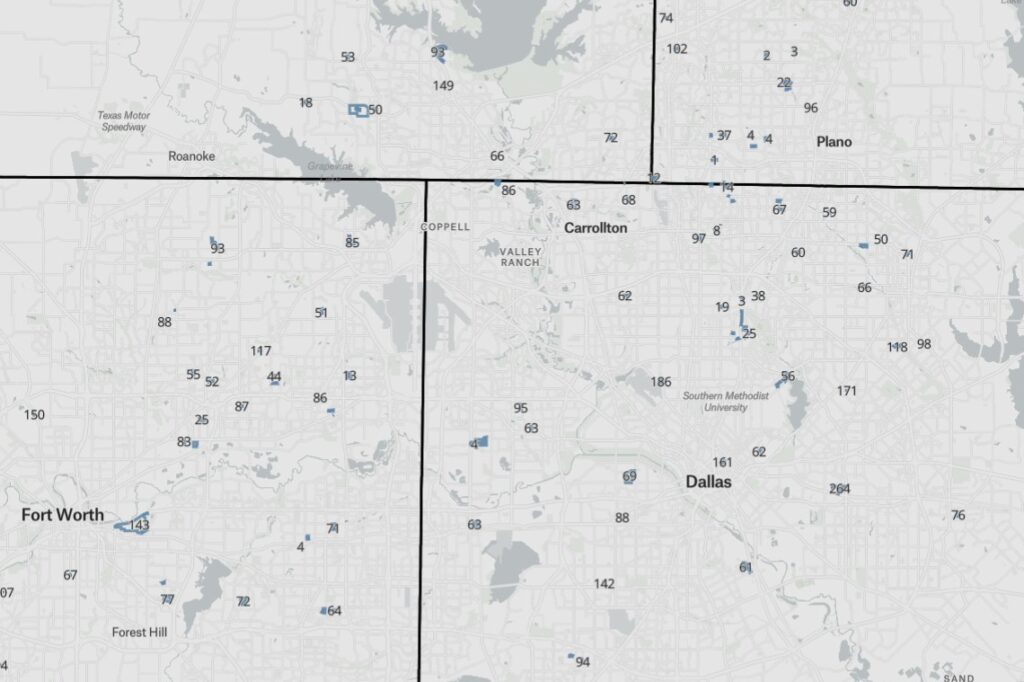
DistrictBuilder also lets you upload additional data sets into your map to add context as you draw and share your plan with others. As such, we have made the group quarters census data available for download, so that you can upload it to your maps in DistrictBuilder. By doing so, you can see how clusters of group population fall into current and proposed redistricting plans, and possibly understand where groups are being packed and cracked.
- Download the full set of group quarters variables for all 50 states here.
- Download files by group quarters category for New York, Texas, and Pennsylvania here.
Here are some examples of viewing group quarters data as reference layers in DistrictBuilder.
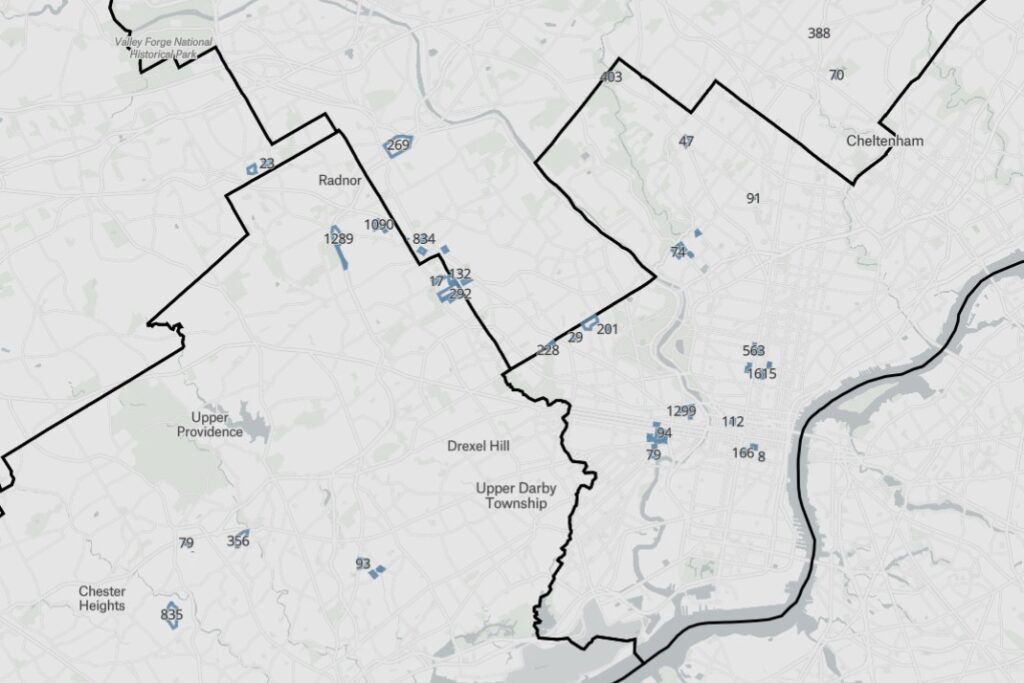
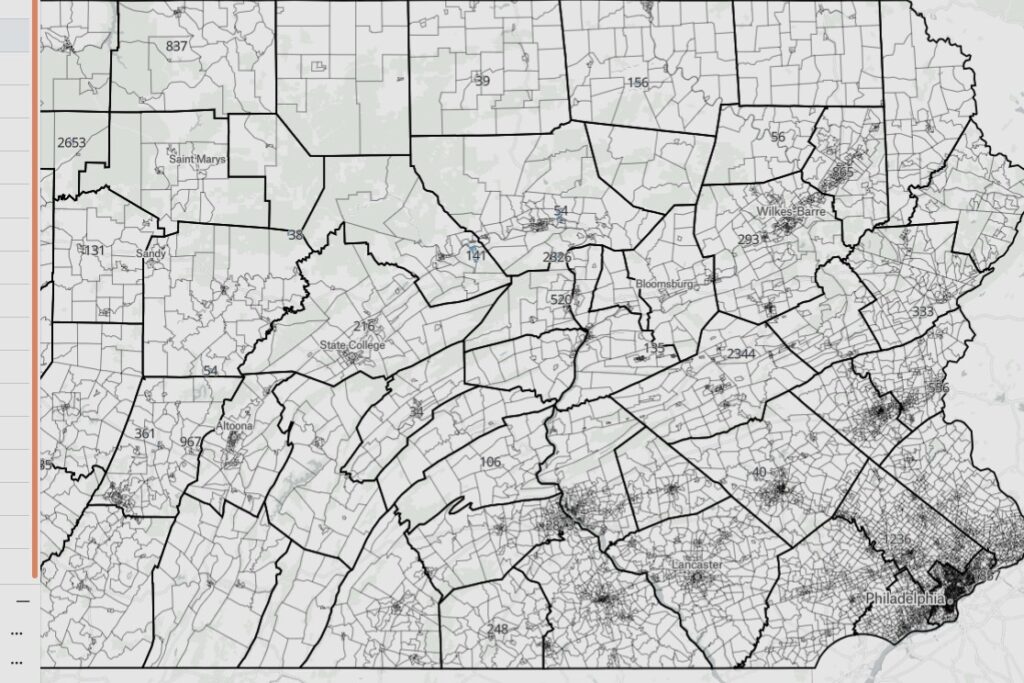
For more information about creating a reference layer in DistrictBuilder, see this post for a complete guide: