

Transport energy consumption is one of the leading contributors to greenhouse gases (GHGs), and 40% of energy transport is derived from urban settings. As the climate change impacts of GHGs become harder to ignore, many cities across the US are rethinking their urban mobility plans with the aim to improve public transport infrastructure and also encourage more cyclists and pedestrians to take the road. Austin, Texas has been a city at the forefront of this space. In November 2020, their City Council put two urban mobility propositions on the ballot. Proposition A was a $7.1 billion initiative that included a new rail system, a downtown transit tunnel, an expanded bus system, and a transition to an all-electric fleet. Proposition B initially seemed unlikely to make it to the ballot. It was a $460 million investment to expand Austin’s bike network, invest in urban trails, and fund projects to improve safety and convenience for biking and walking. On November 2, 2020, voters passed both ballot measures. The story of how Proposition B made it to the ballot is a story of effective partnerships, accessible data, and strong data visualization.
Effective partnerships and accessible data
PeopleForBikes, a nationwide bike advocacy group, has had a long-standing relationship with Austin’s Transportation Department (ADoT) and City Council. Over the years they have worked together to strengthen Austin’s bicycle infrastructure. In large part, they have been able to do this by using data in PeopleForBikes’ Bicycle Network Analysis (BNA) tool. This tool, built in partnership with Azavea, measures how well bike networks connect people with the places they want to go. One of the key advantages is that it quickly computes data on a city bike network that would take the city’s transportation department significant time and money to do on their own. The ability to make biking data accessible has been a game-changer for ADoT.
Accessible data frameworks
ADoT wanted to show that an investment in Proposition B would greatly expand the impact of Proposition A, but they couldn’t do it alone. ADoT is one of the more advanced city transportation departments when it comes to data, and they have staff with deep data science knowledge. However, it would have been prohibitively expensive for them to collect and process the data needed to demonstrate Proposition B’s importance to the City Council. Luckily, due to past collaboration, they knew they could call on PeopleForBikes and quickly get accurate data from the BNA framework. This framework, notes Rebecca Davies, the Bicycle Networks Data Manager at PeopleforBikes, “made what would have otherwise been a tedious and prohibitively expensive task fast and easy”.
Accessible data and compelling visualization to push public policy
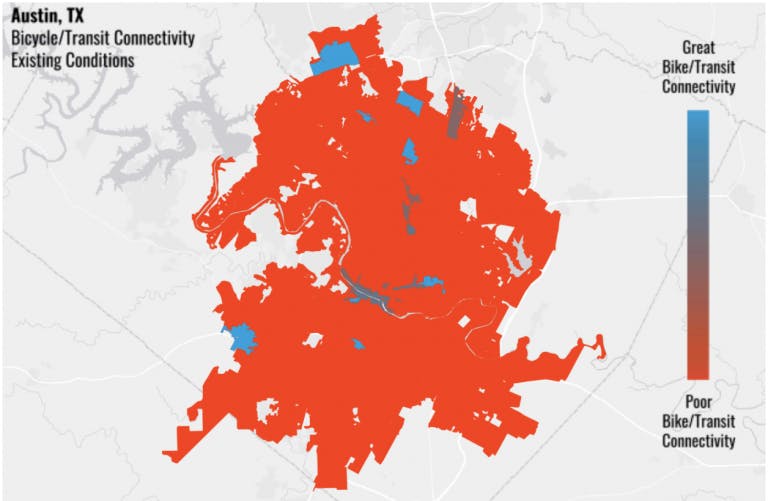
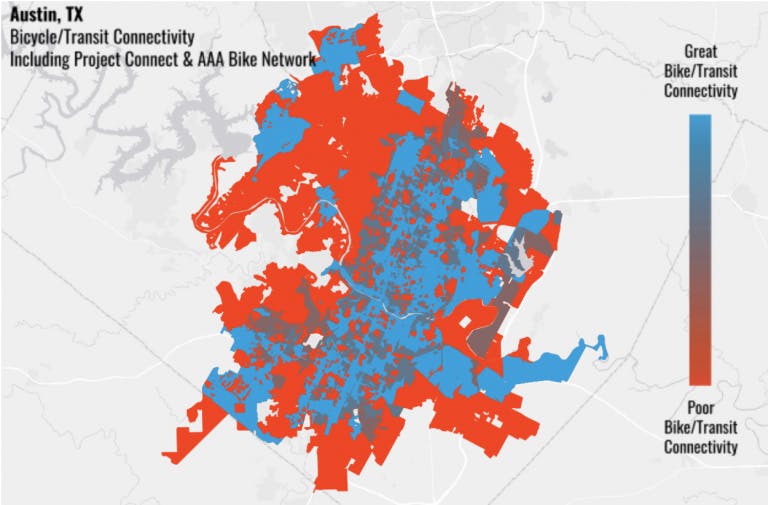
By using data in the BNA, PeopleForBikes quickly complied statistics for ADoT to present to the City Council showing that Proposition B would amplify the effect of Proposition A, leading to a significantly improved transit network. The planned improvements in Proposition A alone would expand access to 146,749 people who would now be within biking access to public transit (Map B). By also passing Proposition B, for a relatively small additional budget of $460 million, they would increase access to 429,494 people in total (Map C).

The results were so staggering that leaders simply could not ignore the value that biking would bring to supporting transit. The City Council added Proposition B to the ballot and it passed along with Proposition A on November 2, 2020.
The benefits of open source and easily customizable software
The BNA was an effective source of information for ADoT for two key reasons. First off, BNA utilizes OpenStreetMap, an open source map of the world. Given the open source nature of OpenStreetMap it was very easy to update and modify data sets. Therefore the BNA always had updated maps of Austin that reflected any recent street changes. Secondly, Azavea had updated the BNA to make it more customizable per city to highlight factors such as individual street speed limits. Previously BNA used a de facto street speed limit on residential streets. When Propositions A and B were put forth in Austin, residential street speed limits were considerably higher than most of the nation, making biking less safe in many areas. This updated information in BNA highlighted the greater impact that Austin bike lanes would have in streets with these higher speed limits.
Azavea was proud to have supported this effort through our work on the BNA. This case exemplifies how accessible data can push public policy forward. It can help cities rethink their urban mobility plans as well as a variety of other factors that also contribute to climate change and long-term sustainability. Want to learn more about how we can help your city? Reach out; we’d love to talk.