
Are you responsible for the labeling side of your team’s machine learning project? If so, you’ve noticed the dearth of resources available to guide you. Fending for yourself may not be comfortable, but it can be a fulcrum for developing new ideas. Here are four insights I’ve developed while managing the data labeling for Azavea’s machine learning projects.
Align project goals
Before building your data labeling project, you need to sit down with your client and software engineers to hammer out what information you want to glean from your data. You should also determine if labelers can accomplish the project’s goals. Maybe the feature the team wants to label is not decipherable in the imagery, or the level of detail or number of classes a client wants is incompatible with their deadline. If possible, have everybody working on the project spend time labeling to see whether your goals and data are compatible.
Define classes early and exhaustively
Once the project’s goals are established, it’s time to define the classes. To ensure consistency and clarity, I like to develop a chart like the one below to capture all relevant information about each class:

Organizing multiple classes for optimal data labeling
If the project has more than one class, define those classes exhaustively to ensure that they meet the client and model’s needs. If the project involves visual data, be sure to define the classes both in writing and pictorially. This will also ensure consistency of labeling.
If the project involves multiple layers of imagery, include pictures of each class in all layers. These layers and classes can multiply to a point where they will burden labelers, so we advise clients to keep classes to a minimum. If a larger number of classes is necessary, you can explore alternative workflows to minimize the mental toll on labelers, such as developing super classes that can then be broken down on a second pass of labeling.
Other considerations
- Task size
- Label colors (surprisingly important!)
- Team members and their responsibilities
- Edge cases you encounter
Once you have documented these choices on one sheet, share it with all parties to get feedback before asking a software engineer to create the projects.
Develop a “burndown” chart
One of the top questions you’ll be asked is: “When will the data labeling be complete?” If you keep good metrics, you’ll be able to deliver answers with ever-increasing accuracy.

The main metrics you’ll need to give a completion date for a project are the average number of hours spent labeling and validating per day/session and the average number of tasks labeled and validated per hour. I find that separating labeling and validating provides a more precise estimate, but is not essential for an accurate assessment. You’ll then divide the number of outstanding tasks by these figures to deliver an estimate in hours and days until project completion. Each day your labelers spend working on the project will improve your estimate.
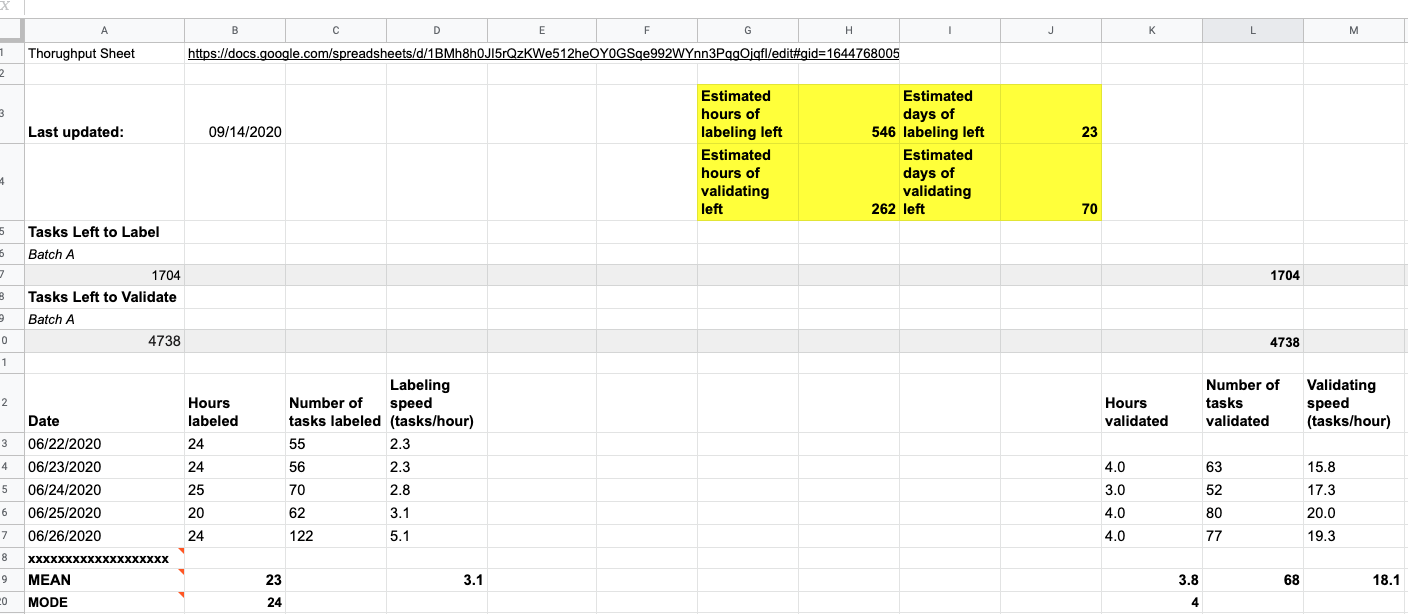
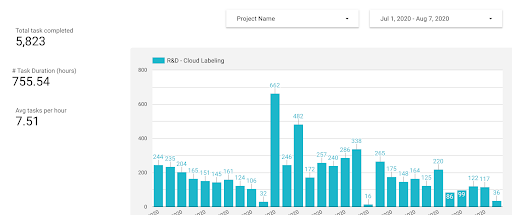
Sourcing your data
Where do you get the raw data? That can vary, and in our case, has changed over time. We first asked our labeling team to record the number of hours they spent on a given project and the number of tasks they completed in that time each night. I then plugged those numbers into a spreadsheet I designed to calculate averages and estimates. The number of outstanding tasks I filled in using the dashboard on Azavea’s data labeling tool, GroundWork. This system was imperfect, but worked fairly well. I’ve since benefited from the work of my CloudFactory labeling team lead, who has developed a dashboard that shows me the averages instead of the raw data. Our next step is to bake all of this data gathering and mathematics into GroundWork itself; a feature our engineers and designers are currently building.
Check and track data labeling quality
Depending on the project size, you may not be able to validate every task that labelers complete. Still, it’s important to validate, or otherwise check in on, your team’s work as often as possible, especially when starting a new project. Not only will validating guide you as to what feedback and retraining to offer, but you can also use the opportunity to create data about the quality of work being done.
This needn’t be difficult. To start, I decide on a percentage of validated tasks I want to include in my quality check; in complicated use cases it may be 100%, but I usually track 1 of every 10 tasks I check.
Defining quality
What do I track? First I determine the primary question or questions the labelers are being asked to answer. In an object detection project, for example, the main question you track might be: “Did the labeler correctly identify all instances of the desired feature?” Once you have validated a fair number of tasks, you’ll have a pretty good idea of whether your labelers are accomplishing their given task.
If you are working on a semantic segmentation project, you can also give a grade on the drawing quality of the annotations in a task. I keep it simple by giving a score of 1 to 3. Not only can you use these numbers to track project quality, but you can also use them to evaluate individual labelers.

We have found this step particularly critical because most of our projects are sufficiently large that we need to rely on a portion of the labeling team to validate. Being able to identify the top labelers on each project (and you’ll find this varies if you do many types of tasks), means that you will produce the best annotations possible for your machine learning projects. In our experience, validated labels can provide a significant boost to a model’s performance.
What tips do you have for managing data labeling for your machine learning projects? What pitfalls have you encountered or avoided? I’d love to hear your thoughts! And feel free to reach out to us if you’re looking to develop an imagery-based machine learning project of your own.