
Over six thousand seats were up for election this past November in 87 out of 99 state chambers in the United States. The Cicero team has tracked legislators for over 10 years, and we’ve seen some interesting changes come out of the most recent election cycle. To illustrate these, we produced graphics that capture an aggregate total and party breakdown of representatives in each state chamber. We also included an overview of the contact information made available by those new or re-elected officials, which could be helpful for any person or organization planning state level advocacy or outreach.
Party structure
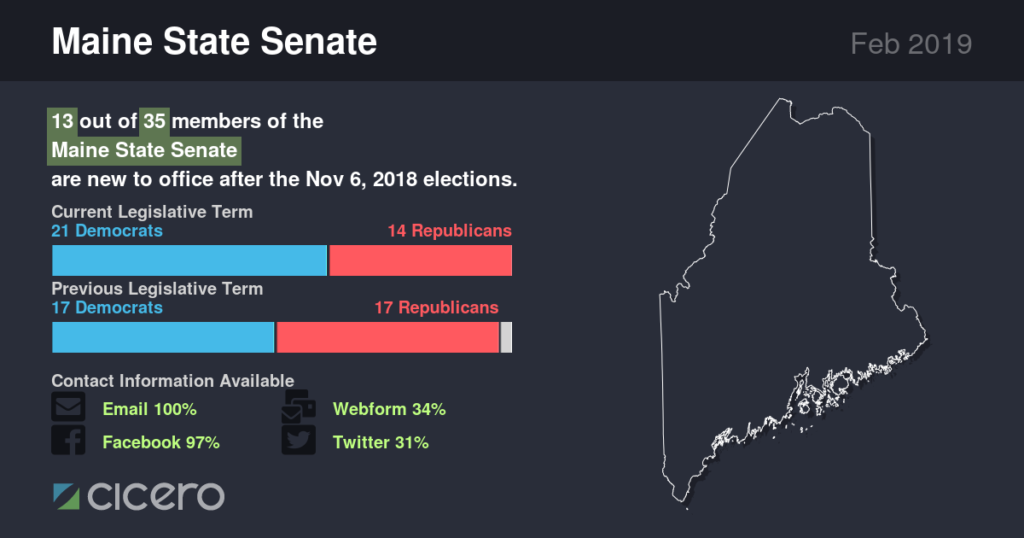
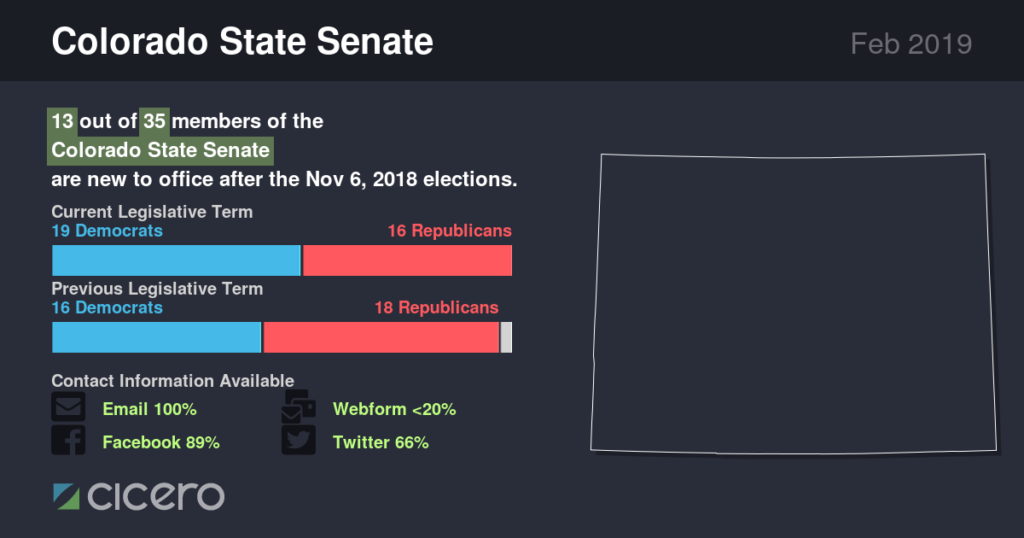
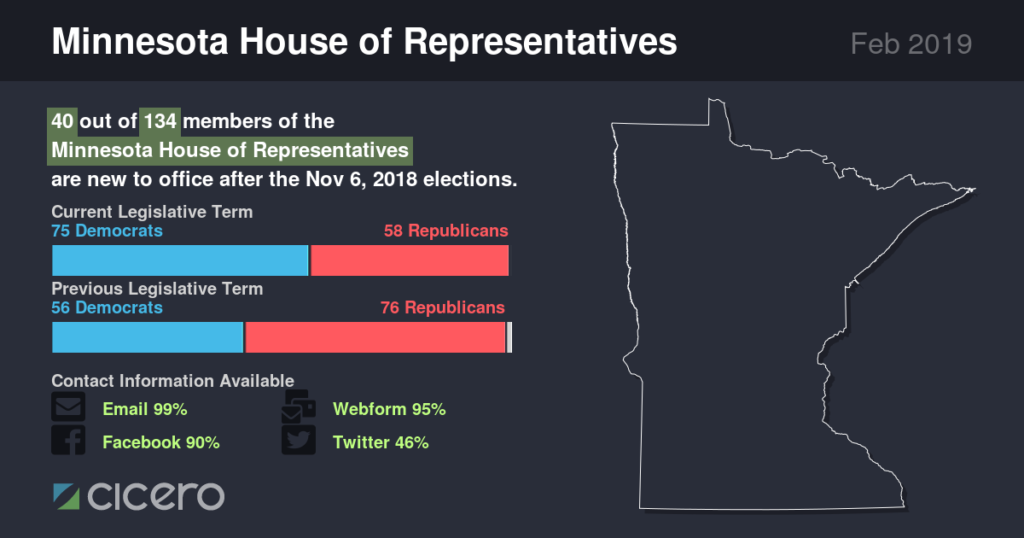
Overall, Democrats had a net gain of seats in 35 states, while Republicans had a net gain in 9. Six state legislatures ultimately switched from Republican to Democratic control. Out of the 99 state chambers, 37 are now controlled by Democrats and 61 are controlled by Republicans, versus 32 and 67 respectively.

Maine Senate Changes Colorado Senate Changes
Trends in contact information
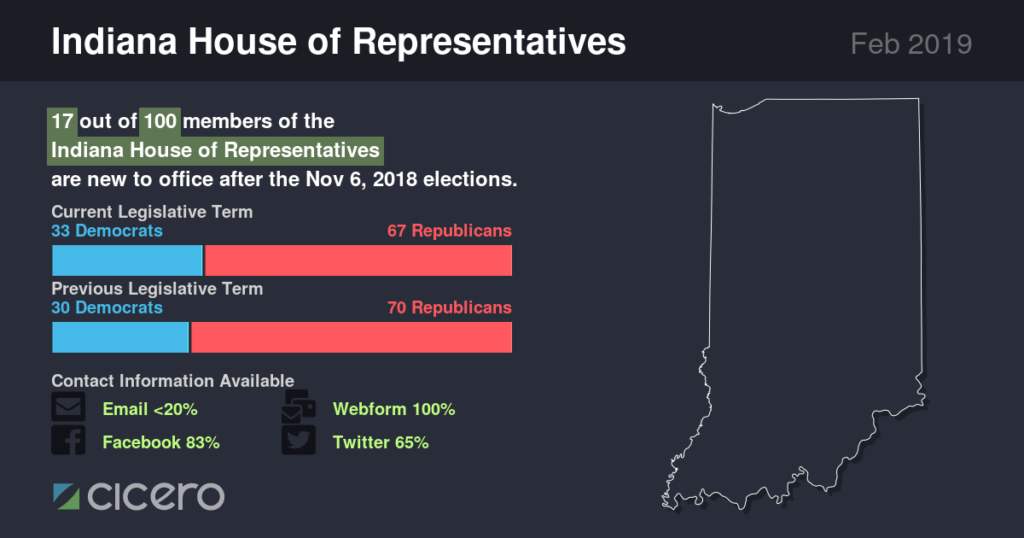
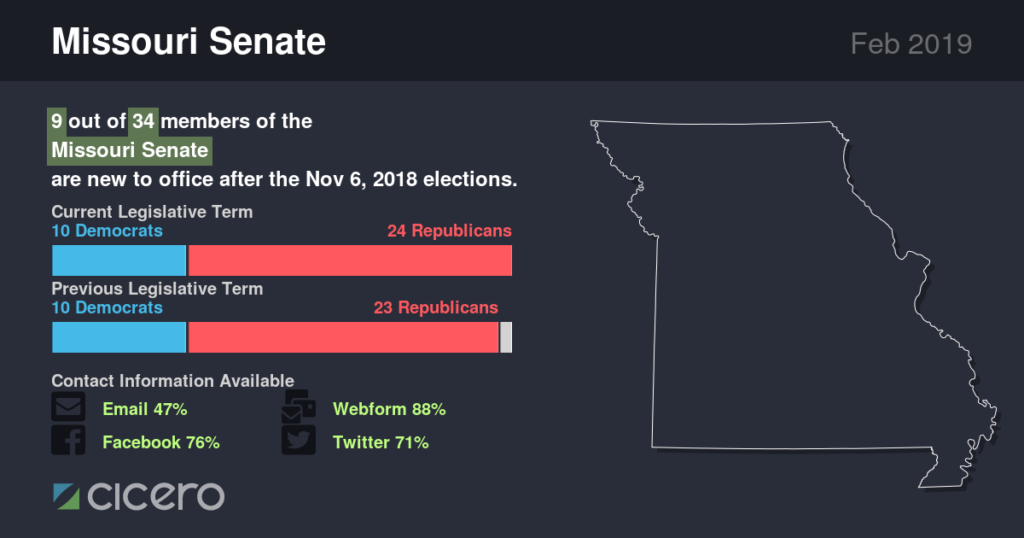
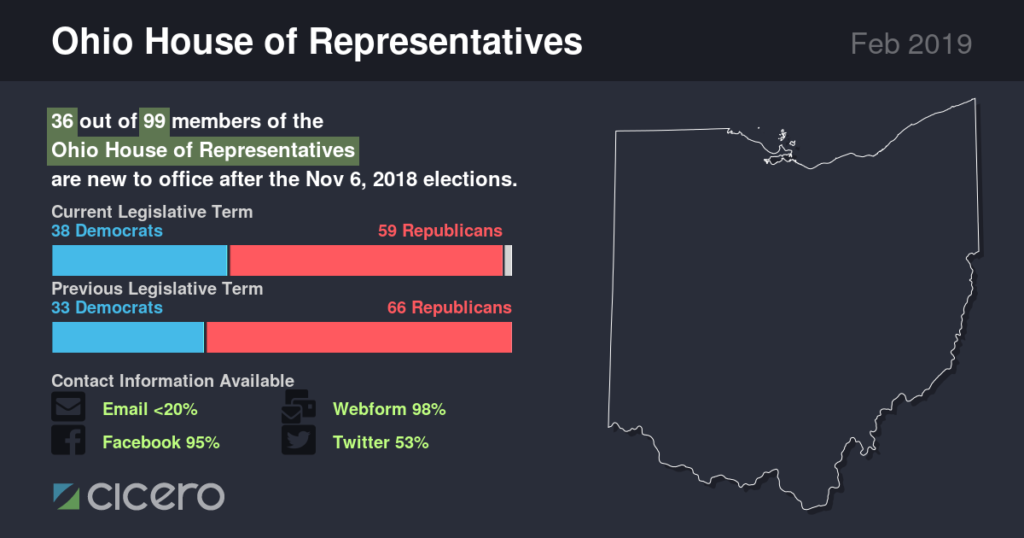
Elected officials serve to represent their constituents, so constituents need to be able to contact them. However, all methods of contact are not created equal. Legislators in different states provide access to different types of electronic communication. One major change over the past several years has been the switch from published email addresses to webform URLs. In 6 chambers now, 50% or fewer representatives make an email address publicly available.
Indiana House Changes Missouri House Changes
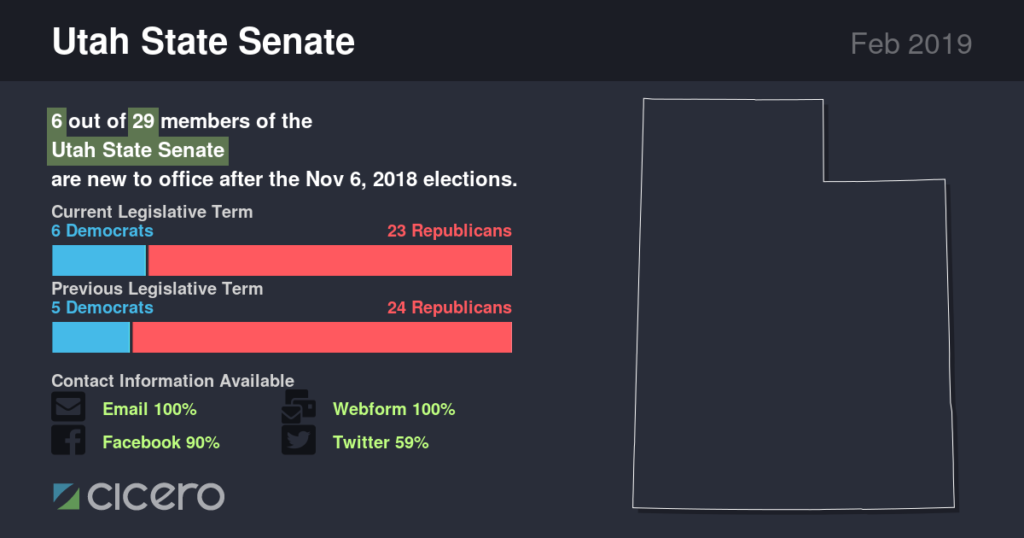
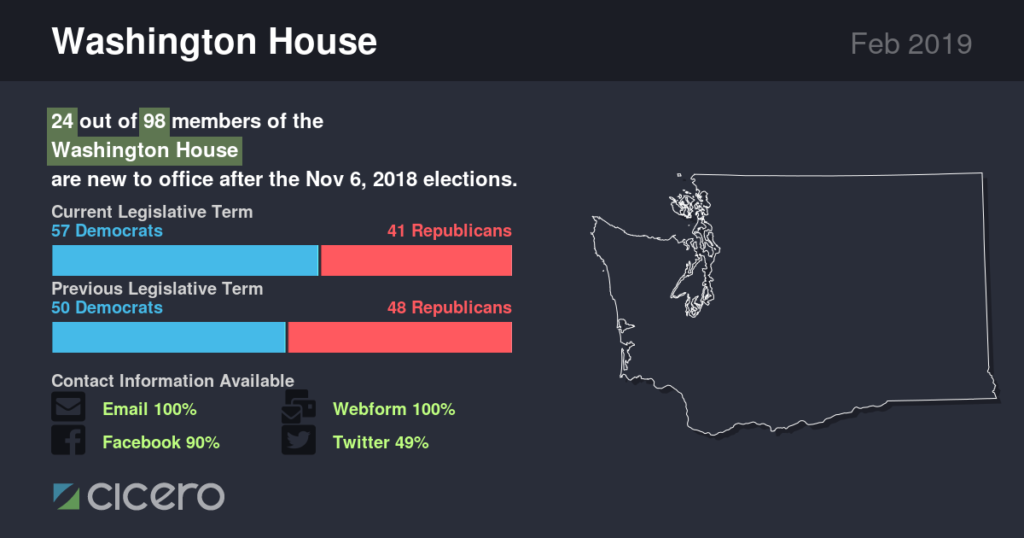
Conversely, we have seen a rise in elected officials publishing and encouraging communication via social media accounts. In 46 chambers, 90% or more of elected officials maintain an active Facebook page.
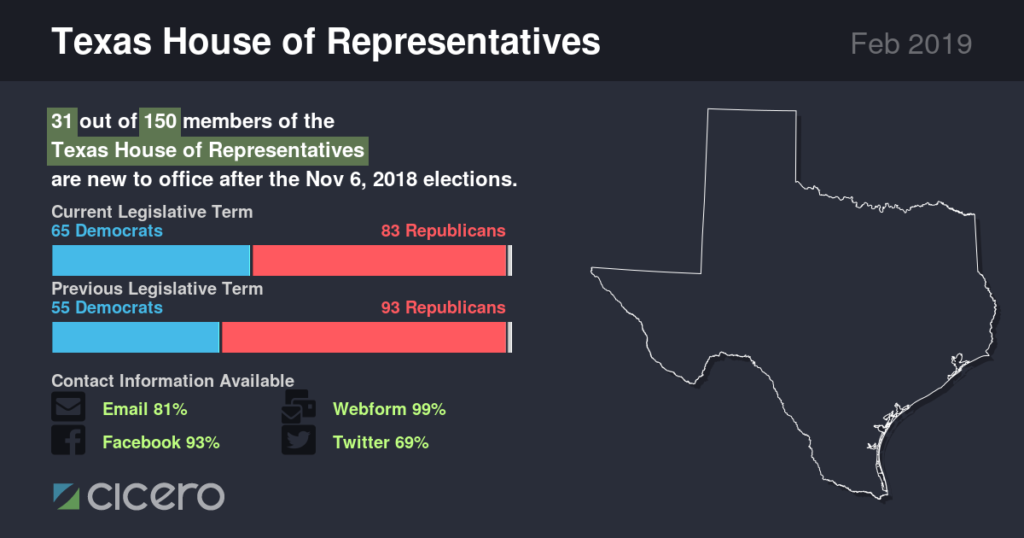
Utah Senate Changes Washington House Changes Texas House Changes
Scroll the full set of graphics here to see the best ways to contact elected officials in your state.
Looking for election results?
Making these graphics
Immediately following the election, we entered new officials into the Cicero database, along with their term dates. As legislatures began kicking off new sessions, we gathered all of the contact information available on their websites, such as emails, contact web forms, and social media (like Facebook profiles and pages). After this round of research was complete, we had detailed information about the political makeup and availability of contact information for every state chamber in the US.
We leveraged work we did last year in creating these reproducible graphics as a PNG using Node.js, Canvas, and D3.js. We also wrote a script to generate an HTML page to publish the graphics on the web. Feel free to check out our code on Github.
If you’re interested in using this data for a project or visualization, reach out! We’d love to chat.