
In a recent interview with Harvard’s Data-Smart City Solutions, Tom Schenk Jr. (the City of Chicago’s Chief Data Officer) reflected that he “was always fascinated and convinced that the future of policy was going to be data-driven and data-informed.” Schenk is not alone in this sentiment. In fact, the very existence of the aforementioned Data-Smart Cities Solutions Initiative is telling about the groundswell of support for a new paradigm in city decision-making: cities can improve their inhabitants’ quality of life by implementing data-driven processes that empower their departments to provide better services.
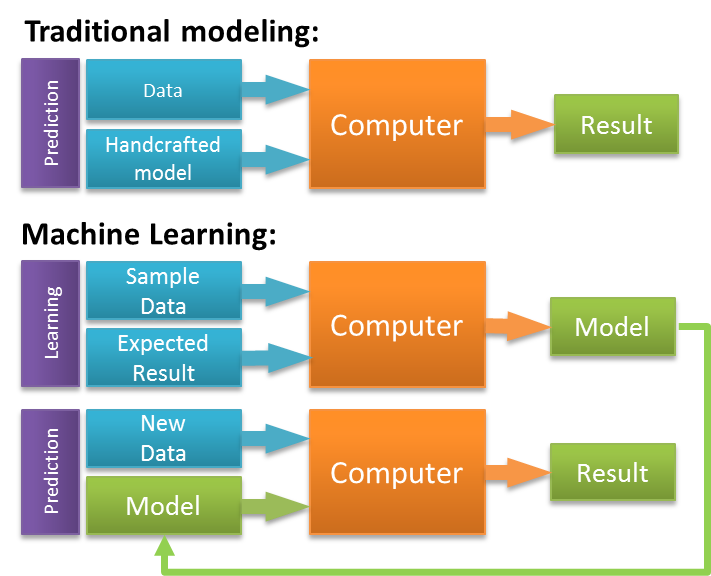
At Azavea, we’re doing our part to help make this new paradigm a reality. We partner with government agencies, non-profits, and private companies to develop data tools that inform decision-making. One of the ways that organizations can effectively use data is to build machine learning models. These models generate predictive intelligence that cities can use to address resource allocation questions. When and where are crimes most likely to occur? Which water mains are most likely to spring leaks? How will new road infrastructure improve pedestrian safety? We can use predictive models to help cities make informed guesses about the answers to these questions.
In the following post, we describe a model that seeks to answer one of these questions: which buildings should inspectors prioritize in order to maximize public safety? The project serves as a proof-of-concept. We answer a very specific question but stress that we could map the general methodology onto many similar problems. If we’re able to predict which buildings will fail inspections then we may be able to figure out which will have unauthorized construction. More abstractly, we may be able to determine which sidewalks are most likely to need frequent improvements.
This post offers a high-level overview of the model. For a more detailed description of our methods, complete with code samples, check out the project’s website.
Our Objective
Our objective was to create a tool that would allow inspectors to prioritize the buildings that they visited. This is a multi-faceted problem because many different events trigger several different types of inspections. A robust tool may make different predictions for inspections in response to 311 calls vs. new construction vs. random surveys. However, In the interest of time and simplicity, we took aim at one specific aspect of this broader objective. We built a model that predicts the likelihood that a building will fail a follow-up inspection after it has already failed in the past. This means that we limited the scope of our analysis to buildings that already had a “case” in the inspection system.
We chose this specific analysis for a few different reasons. First of all, limiting the scope of the project made it more manageable and easily digestible. Additionally, we believed that this level of specificity would generally be more useful to an organization. When a department tries to figure out how to most effectively use its personnel, the decision-maker likely wants specific answers to specific questions. Finally, we believed that we would be able to gain a lot of predictive power by looking at the time in between different events in the life-cycle of an inspection case. We found this hypothesis to be true. This methodology of mining the time-series trends in a specific “case” or “account” could easily be generalized to look at tax balances, school performance, or even natural disasters.
Motivation
Before diving into the methodology, let’s consider the benefits of such a model if it were to be implemented. Imagine a large city with lots of construction and high rates of buildings failing to comply with the local code. The department tasked with ensuring that buildings comply doesn’t have nearly the capacity to send inspectors to every building in the city. The department allocates initial inspections based on number of events and criteria. A number of these buildings go on to fail their inspections. Once they have failed, they must be re-inspected later to ensure that each makes the prescribed improvements. Some of these re-inspections are on a fixed schedule and some aren’t. Either way, the department has limited capacity. They aren’t able to keep up with all of the existing cases and also inspect new and potentially unsafe buildings.
This type of predictive model would provide the person in charge of allocating inspectors with the probabilities of which buildings are most likely to remain non compliant. She could combine these probabilities with other internal decision factors and plan accordingly. By prioritizing inspections for buildings that are likely to fail, she can ensure that these problematic cases comply in a reasonable amount of time. Meanwhile she can wait to check in on buildings that are likely to pass inspection anyway. All the while this may free up additional inspectors to find undiscovered potentially dangerous buildings using community feedback, professional intuition, or an additional predictive model. When all is said and done, this analysis could allow the inspectors to create safer buildings all across the city.
Modeling Process
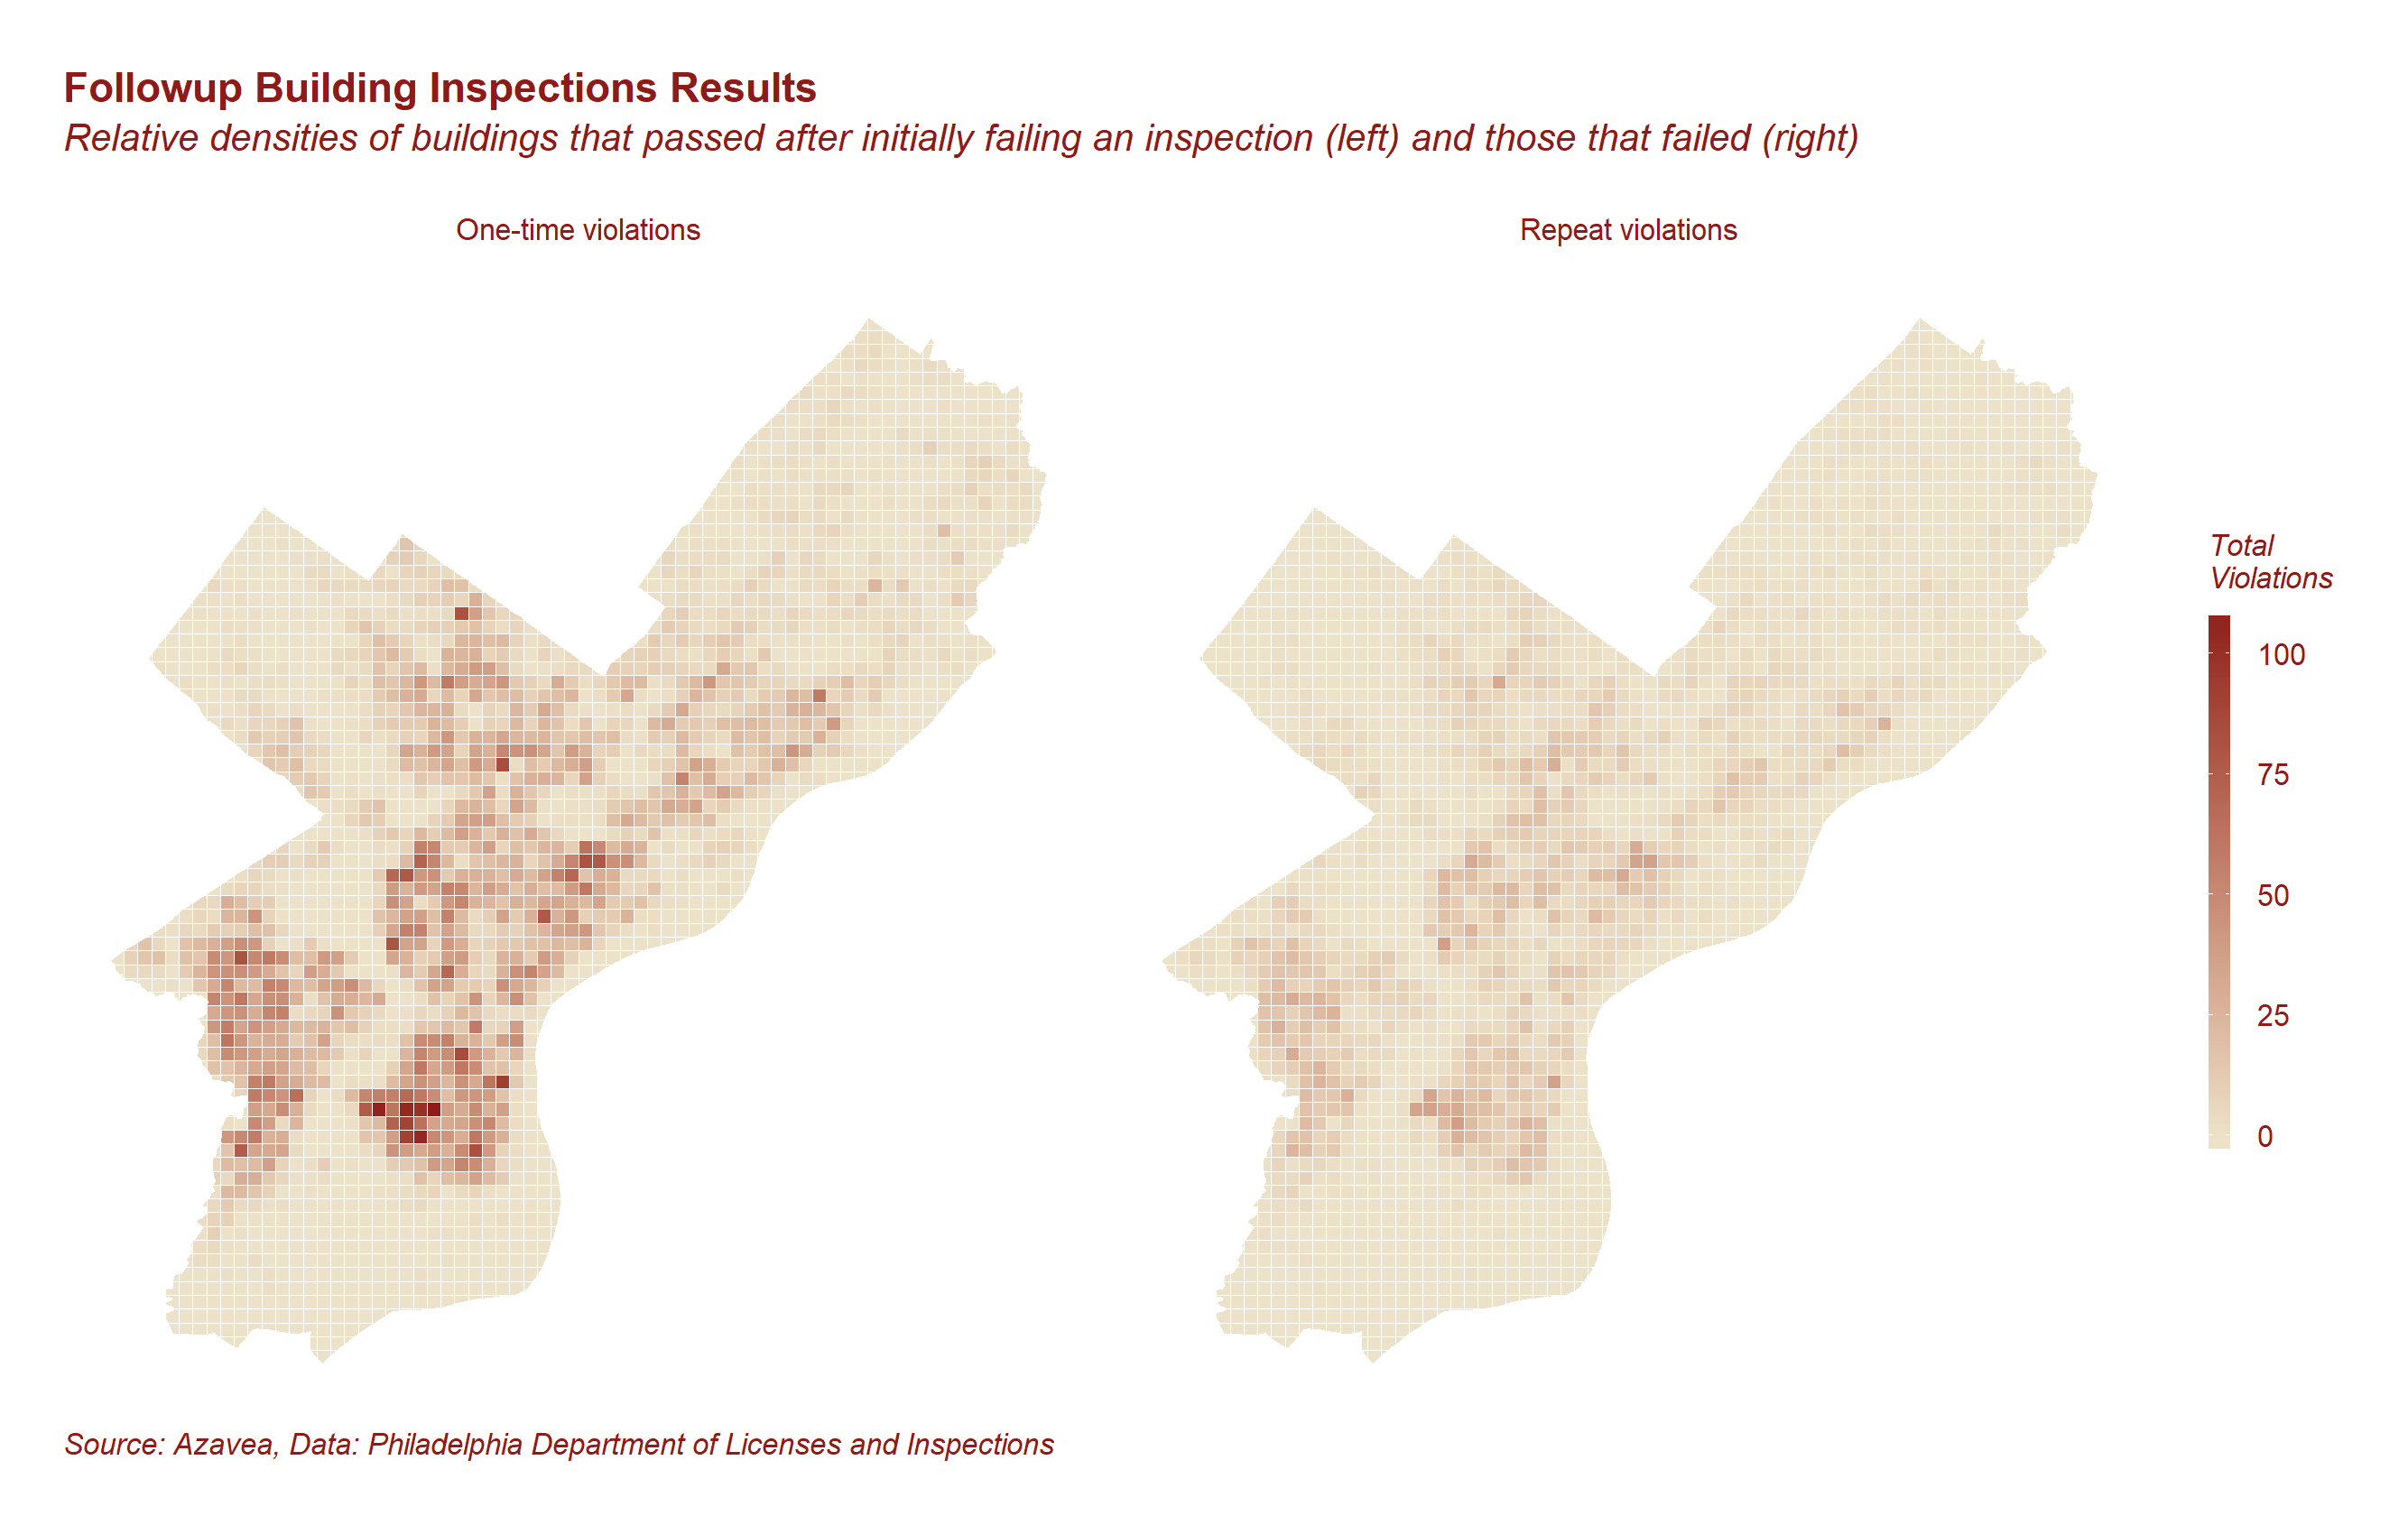
We built a statistical model using data from the City of Philadelphia’s Department of Licenses and Inspections. The City makes these and many other data sets available via it’s Azavea-built open data site: OpenDataPhilly. We are a proud member of the open data community and hope that this project inspires others to tackle civic tech projects of their own.
From these data, we created variables that described each inspection and would give us insight into the outcome. The details of this process are beyond the scope of this post. As I mentioned before, we’ve built a site that will walk you through each step of the model-building process. The results, on the other hand, are discussed in the following section.
Results
Put yourself in the shoes of a city department manager considering implementing this type of model. Before you invest time and money into it, you would need to see some sort of evidence that it would be useful.
Situations like this one call for model performance metrics. The simplest and easiest to digest is accuracy rate: what percentage of inspections could they accurately predict for using this model. We won’t know what the actual future accuracy rate would be without making predictions and waiting them out. However, in the absence of this type of actual experiment, we can simulate one by testing our model on data that it was not trained on. Before we build the model, we split the data randomly into training and validation sets. We train a model on the training set and use it to make predictions for the validation data. By comparing predictions to actual results we are able to tell how accurate our model is.
When we went conducted this process, we predicted at a 74.19% accuracy rate on the validation set. Figure 2 shows how these predictions broke down by category.
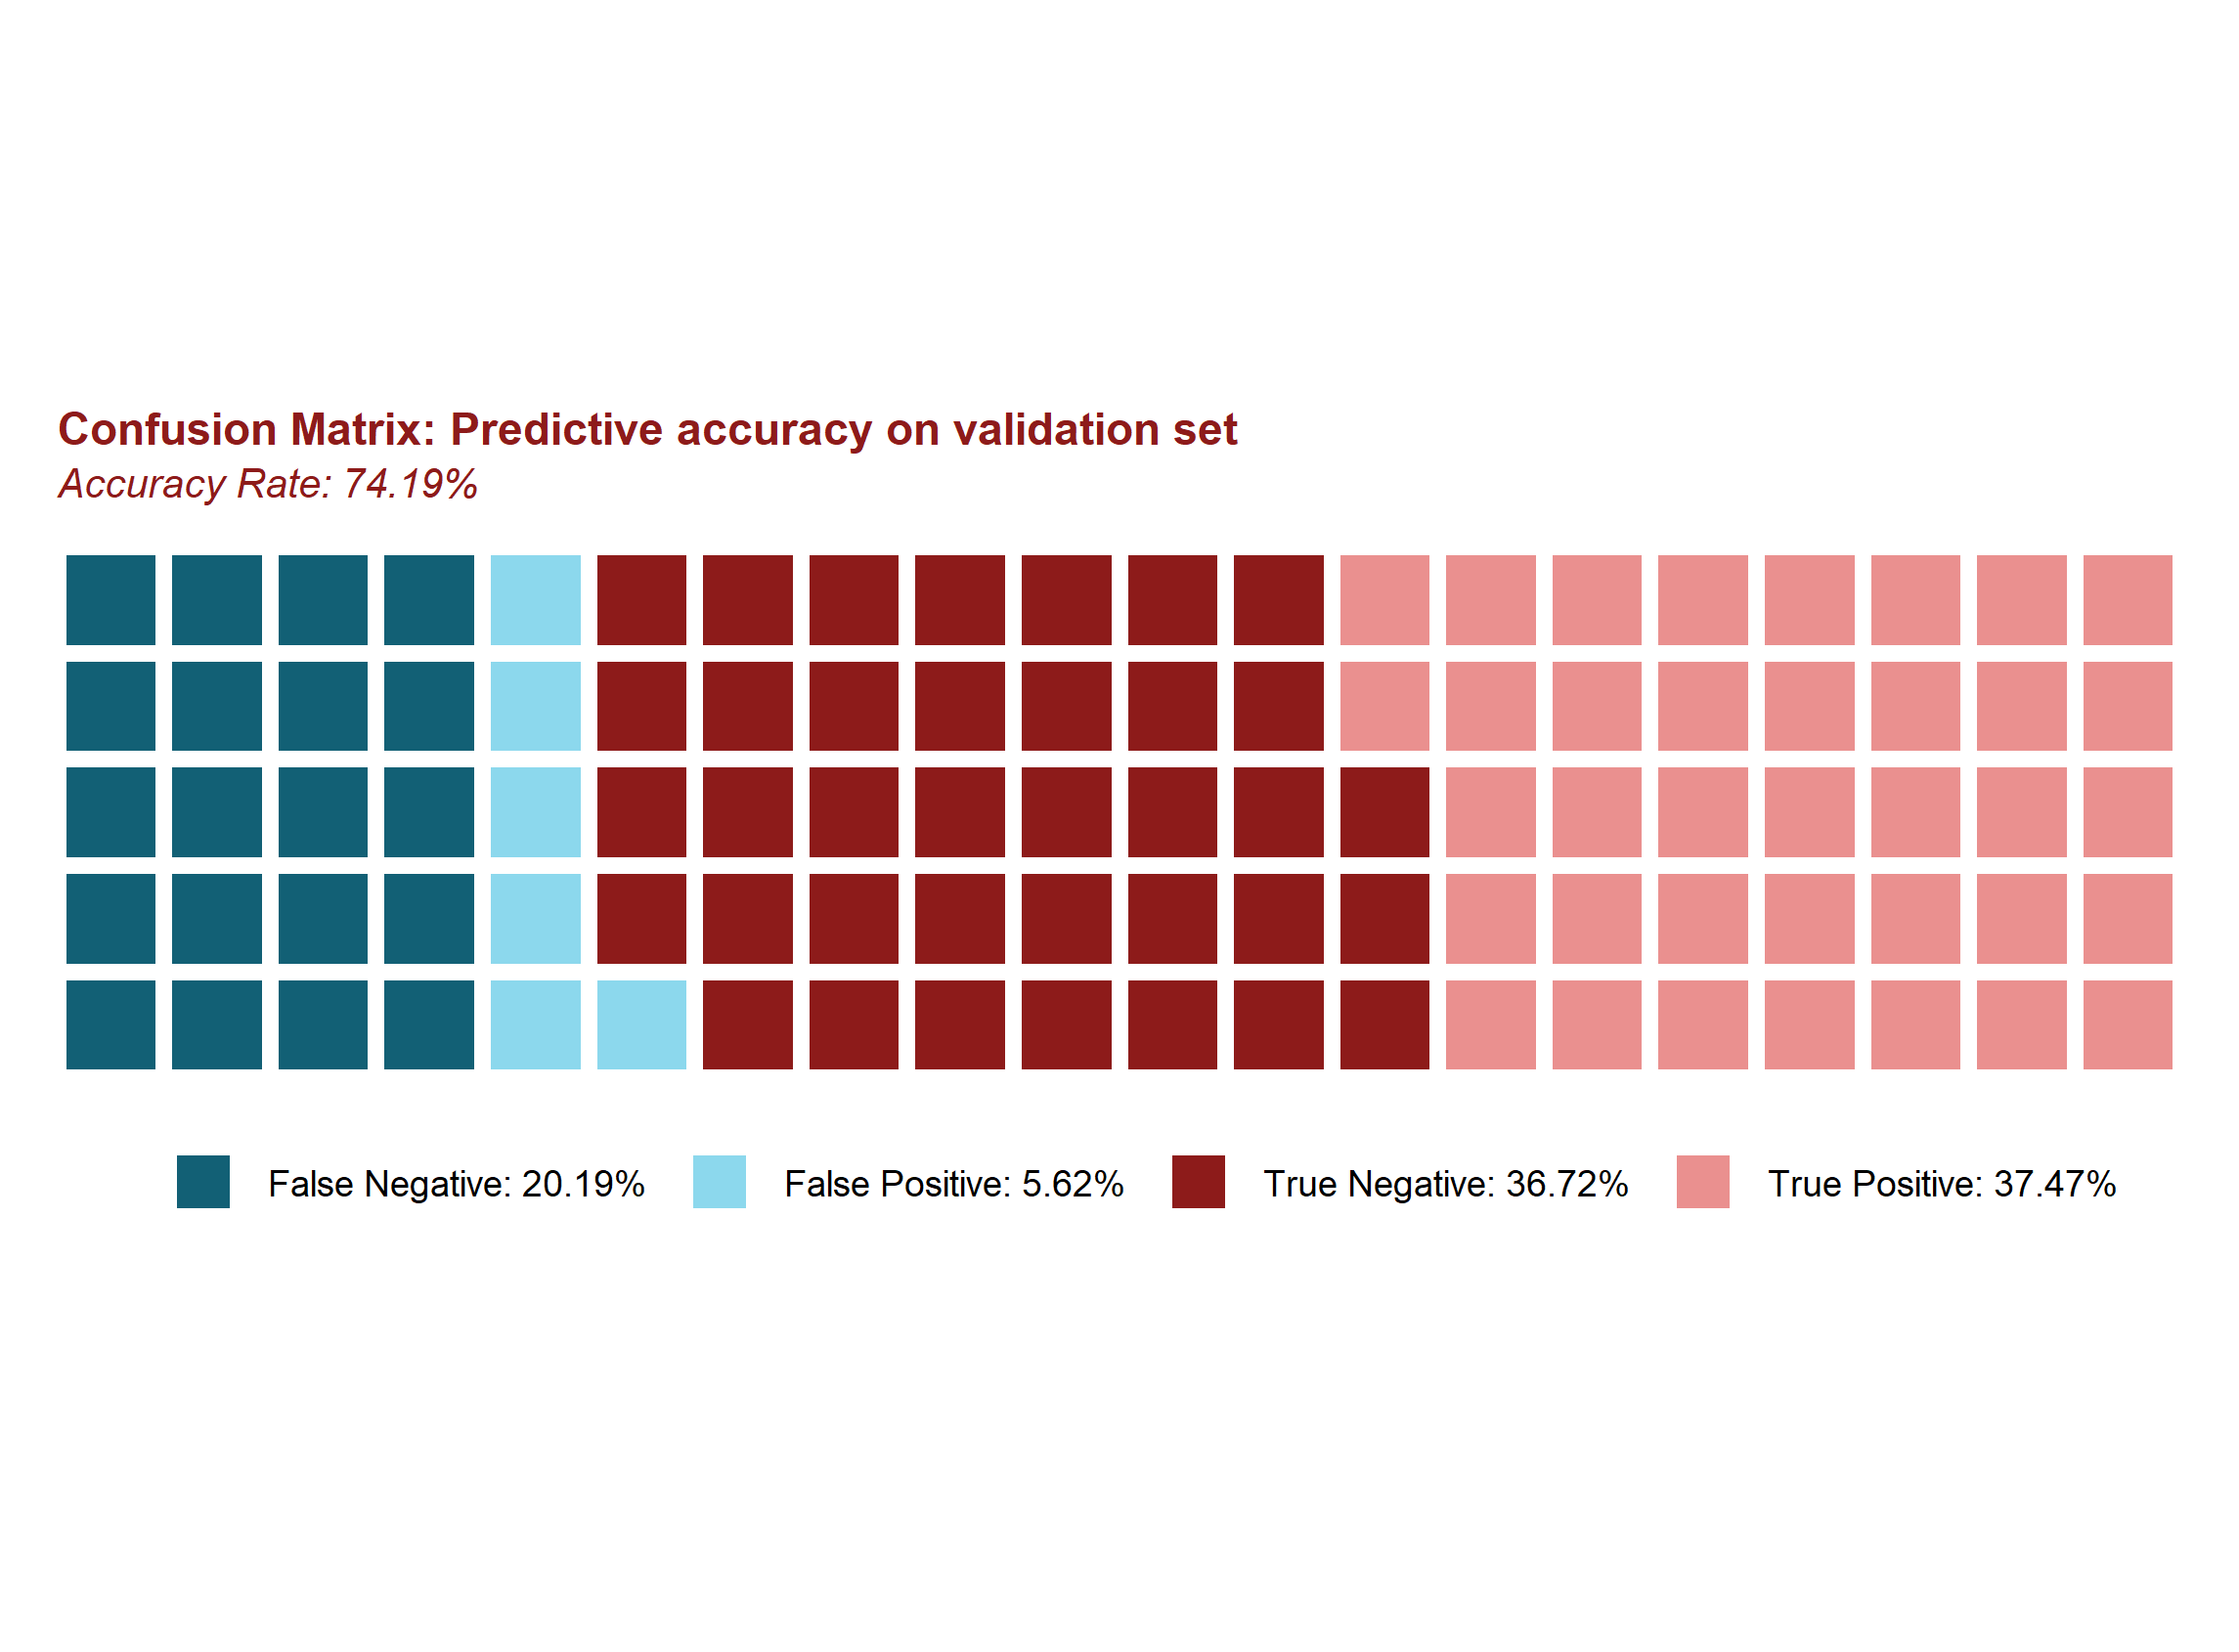 Fig. 3 – Test set prediction results
False negatives are instances in which the model predicted failure but the result was a pass. True positives are inspections in which the model predicted a failure and it turned out to be correct, and so on and so forth. This distribution is based on the prediction threshold that maximized accuracy in the test set, however that does not mean that it is categorically the best one to choose. If the department’s main priority was to waste no time on inspections that would ultimately pass then they may pick a high threshold that maximizes sensitivity.
Baseline Accuracy
Of course these rates don’t mean much in the absence of context. We must compare our accuracy rate to a baseline in order to understand the added value of the predictive model. This baseline indicates the accuracy rate we could expect with no predictive intelligence. One way to do this is by figuring out how accurately we would predict if we guessed the most frequently occurring outcome every time. In the case of our inspection dataset, failures occur 57% of the time. Therefore, with no other information at our disposal, our best strategy would be to guess “fail” every time and we would achieve a 57% accuracy rate. Our 74% accuracy rate may have some room to improve, but it still represents a nearly 20% increase over the baseline.
Variable Importance
Finally, we were able to calculate variable importance for two of the models we used (GBM and RF). You can learn more about these models here, and see the results visualized in figure 4.
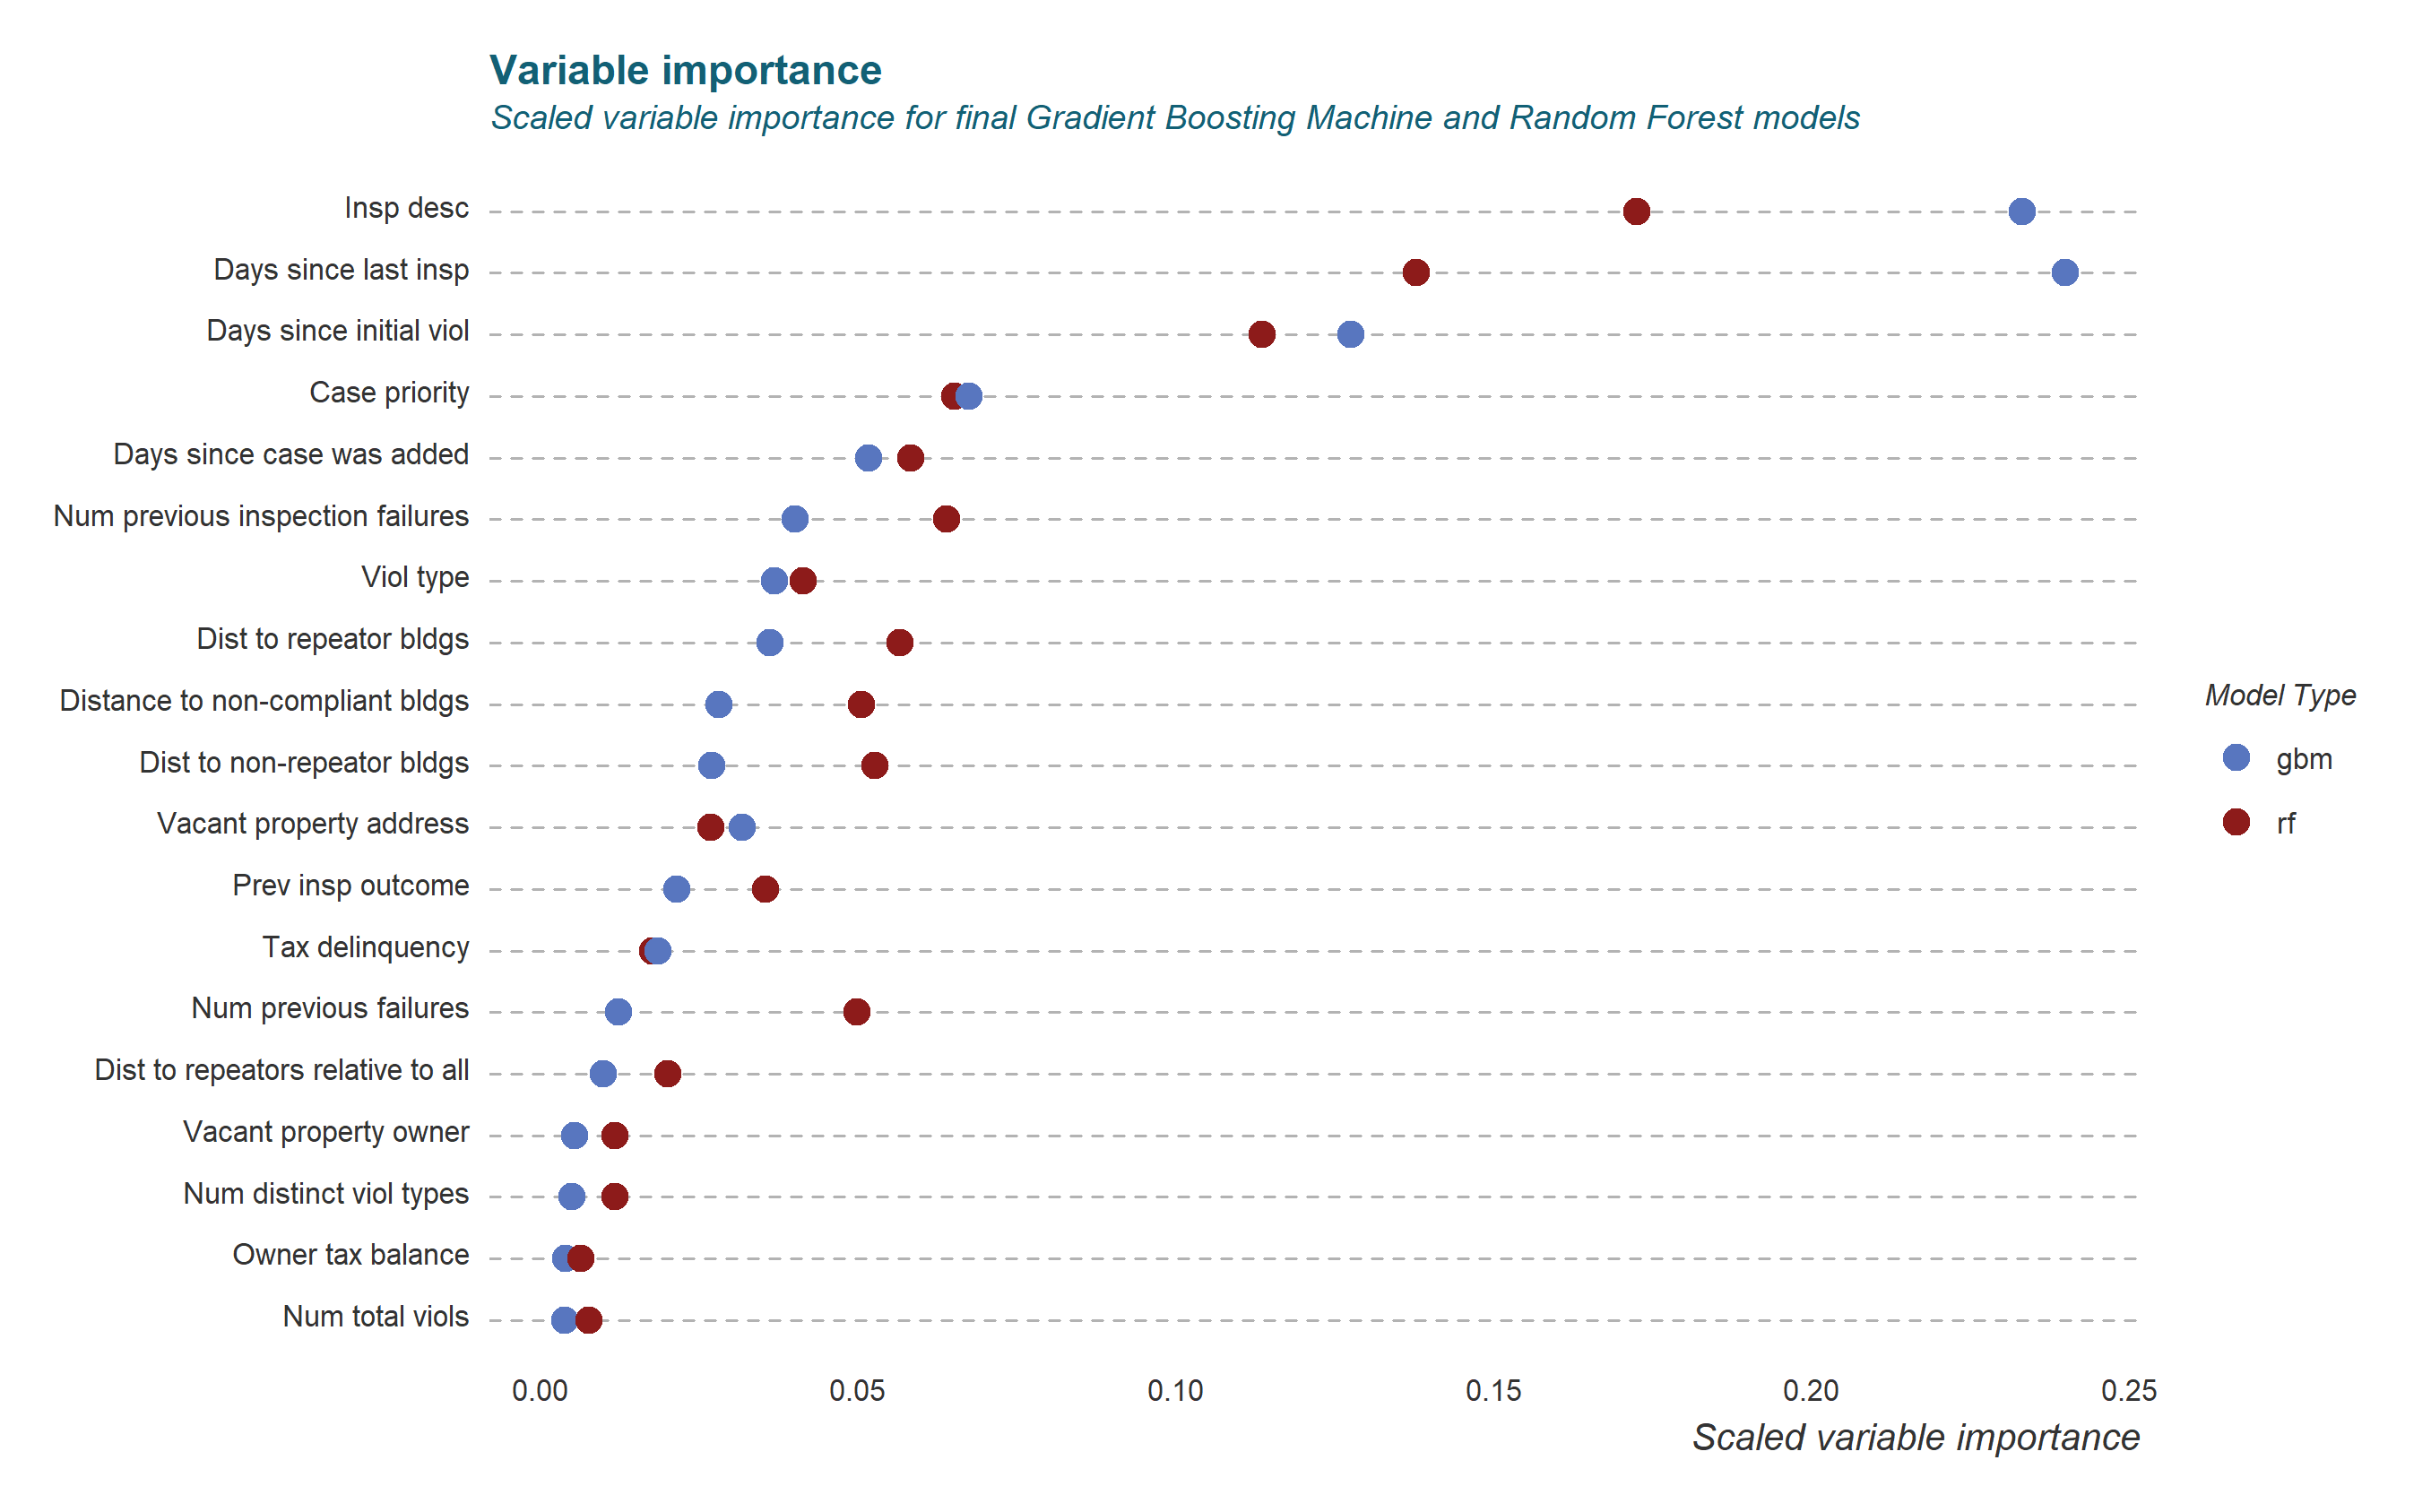 Fig. 4 – Scaled variable importance among predictor variables
Interestingly, the importance of some variables varied slightly between the different models. However, for the most part, the most powerful predictors carried over from model to model. The categorical inspection description variables, as well our time series predictors proved to be most important. It’s clear that we can gain intelligence about the likelihood of an inspection failure from a variety of sources. With access to all of the additional internal data that an agency has at its disposal, it would likely be able to come up with even more sources of predictive intelligence.
Conclusion
This project only scratches the surface of the possibilities for predictive modeling in the policy realm. It isn’t just a proof of concept for building inspections but for any number of data-driven tools for urban policy. If you have ideas for how machine learning can help you improve your city, we’d love to hear from you.