
The Data Analytics team at Azavea decided to take a look at the geography of fatal crashes by Congressional district in the U.S in response to the recent release of the 2015 Traffic Fatalities data and call to action. First, the stunning statistic that 35,092 people died on our streets in 2015. This marks the first increase in years, with over 7% more fatalities than in 2014. With the upcoming U.S. election and people increasingly looking for political solutions to crash deaths and injuries (like getting elected officials on board with the Vision Zero initiative), it seemed to be timely to match the crash data to Congressional districts. We used Cicero, our in-house database of elected officials and congressional districts, to identify which districts had the most fatal crashes.
Mapping the data
We used CARTO’s new Builder platform to provide some built-in querying functionality for the data and Tableau Public to visualize graphs of crash type by district. In the map below, you can hover over and click on a Congressional district to find out the number of fatal crashes, the total number of fatalities, contributing factors (such as drunk driving, distracted driving) as well as whether crashes involved pedestrians or bicyclists. You can also see the name and contact form URL of the Representative, thanks to data from Cicero.
View full screen version here.
The trend seems to be that more rural districts tend to have higher numbers of fatal crashes. Rural roads are known to be more dangerous than urban roads, and we know that speed kills. Despite a higher total number of crashes in urban areas, vehicles moving at slower speeds are less likely to result in crash deaths or major injuries. Other hypotheses are that rural areas don’t have access to timely emergency medical care and there are higher rates of drunk driving.
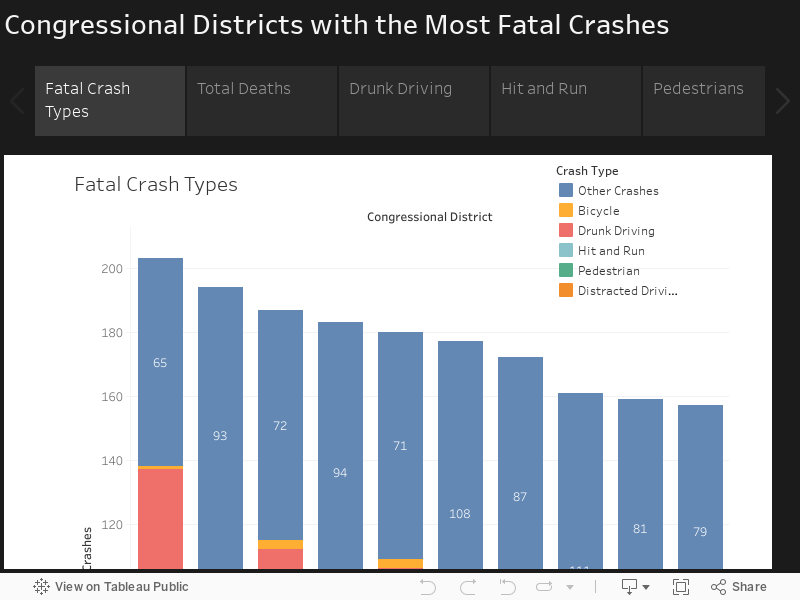
Below, you can explore the Congressional district data in more detail, with breakdowns for top ten districts for some contributing factors:
View full screen version here.
The Congressional districts with the most fatalities are mostly in the South, with the exception of Montana’s At-Large district, which encompasses the whole state. Trends for other contributing factors for fatalities seem to be mixed, but a trend of higher amounts of crashes in Texas and Florida seems to be present.
We hope to see further analyses and visualizations with this data to help researchers and the public better understand why traffic fatalities are occurring. Hopefully, this will result in better safety campaigns, more informed drivers and better-designed roads with the ultimate goal of reducing traffic fatalities. If you are interested in exploring the crash data, you can download it from FARS here. You can also get the traffic fatalities pre-joined to Cicero Congressional district data on Github.