
Earlier this month, our friends at CartoDB announced that heatmaps are now available as a visualization option in the Editor and as part of the Torque library. By heatmap, I mean the traditional GIS definition of a heatmap as representation of the density of point locations.
Since CartoDB’s heatmaps can leverage the time-series mapping capabilities of the Torque visualization library, I thought I’d take a dataset the Data Analytics team has been working with recently and provide an example of how heatmaps work with a tip about formatting your timestamp field to work with Torque.
Following up on the work I did last year, I’m helping to analyze pedestrian crash data in Philadelphia from 2008-2013 for PlanPhilly. These are only the crashes reported to PennDOT by the Philadelphia Police or Pennsylvania State Police, so the vast majority of these involve cars hitting pedestrians. Here’s what Philadelphia’s pedestrian crashes look like over time using CartoDB’s Torque heatmap:
Configuring The Timestamp Field
It’s important to have a dataset that has a compatible timestamp field to work with CartoDB’s Torque. This can be challenging when you’re working with datasets coming from a multitude of database sources that all store dates in a different format. However, converting a date or time field in your dataset to make it work with Torque is quite simple using the to_timestamp formatting function in PostgreSQL.
In the case of the crash data from PennDOT, they provide an integer field with year, month and day of the crash. I concatenated this into one field, which created a rather ugly date YYYYMMDD.
To convert to a date field in CartoDB, your data must first be of type String, which is easy enough to change using the Change data type… option in the dropdown accessible next to the field name in the Data view. Next, create a new field with the Date type using the add column button or SQL. I created a new column called “crashdate”.
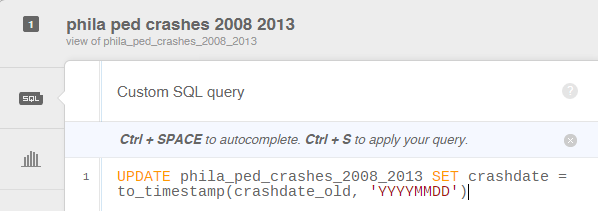
Finally, in CartoDB’s SQL editor, a date with this format (YYYYMMDD) can be converted into a timestamp field with the following SQL:
UPDATE tablename SET newdatefield = to_timestamp(olddatefield, 'YYYYMMDD')
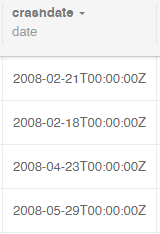
The first argument in the to_timestamp function is the date field you want to convert and the second argument is the format that defines the input. So if your date field is in a different format, simply enter it into the function. With the new date field in your dataset, you’re ready to start a time-series visualization using Torque! If you’re interested in doing your own analysis with this data, head over to the new OpenDataPhilly and pick up the crash data.