
The arts and culture sector in Azavea’s home city of Philadelphia is enormous. According to the Arts, Culture and Economic Prosperity in Greater Philadelphia report in 2012, arts organizations and their patrons inject $3.3 billion into the region’s economy. In addition, these organizations support nearly 44,000 full-time equivalent jobs. Clearly, the arts and culture sector is vital to the economic and social fabric of Philadelphia. However, with dwindling public funds available and a decrease in donors since the recession, some organizations are finding it tough to grow their patronage and increase donations.
The Greater Philadelphia Cultural Alliance is the umbrella organization that advocates on behalf of and supports the over 300 non-profit arts and cultural organizations in the Philadelphia region. Complementing to their advocacy work, the Cultural Alliance has a strong research sector. With support from the Pew Charitable Trusts, the Cultural Alliance partnered with Azavea to develop new data analytics and mapping tools to chart demand for arts and culture. With so many diverse organizations; from the large ones like the Museum of Art to the small like The Clay Studio, the Cultural Alliance has lots of data to work with, including 1.2 million patron households in the Philadelphia region. Each organization’s data is coded by the discipline of the organization — such as theater, dance, or education. Furthermore, the patronage data is coded by type of patron — single ticket buyer, student, or donor and year of participation. That’s where Azavea steps in. Using GIS, the geocoded households can be mapped and matched to demographic data or overlaid with other proprietary audience or arts and cultural demand data. The goal is to map out existing audiences and find new opportunities for growth.
In addition to the Cultural Alliance’s own member data, we researched and purchased other datasets to use for the project. Esri’s demographic projections provided an easily digestible format for analyses of future growth in the region. We also purchased Esri’s tapestry segmentation, market potential, and consumer expenditure data. These datasets can be used to profile households and identify more specific niche markets for organizations.
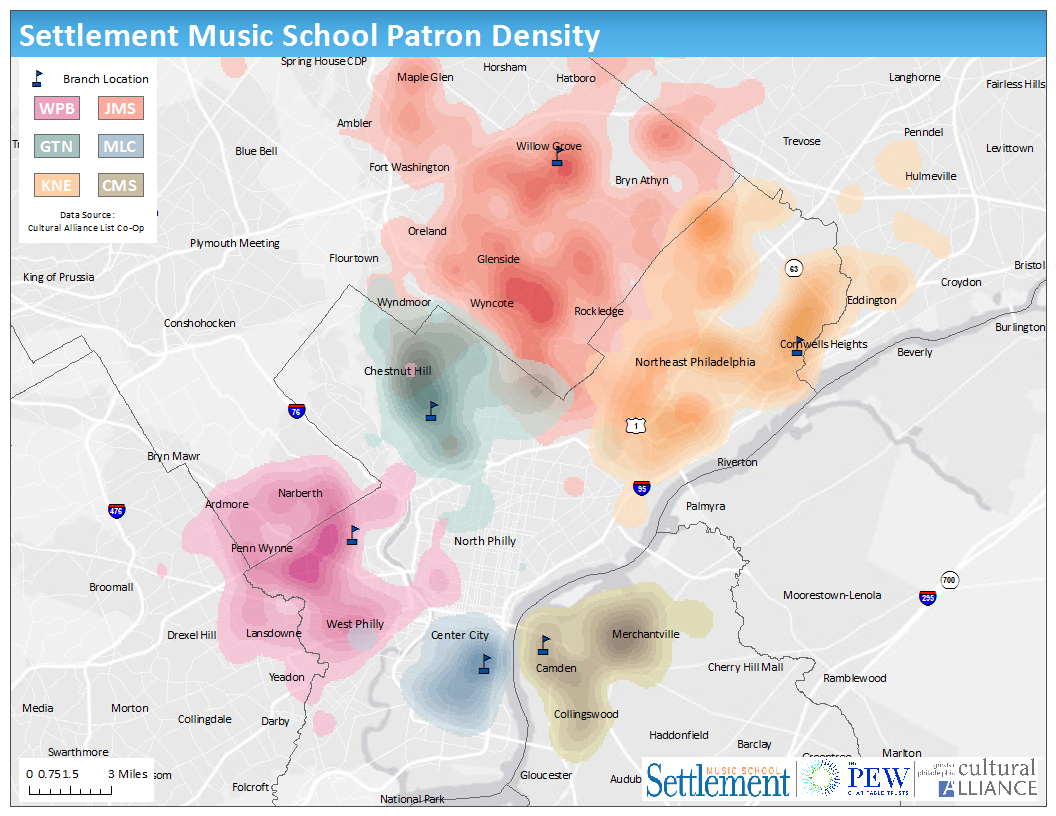
One of our first partners is the Settlement Music School (SMS), which provides youth and adult music lessons and programs at six branches in southeastern Pennsylvania and Camden, New Jersey. They are seeking to better understand their current patrons’ neighborhoods and identify areas for future growth at their five Pennsylvania branches. One way to look at the patronage for each branch is a density map, shown here. The darker shade indicates cluster or higher densities of patrons for each branch.
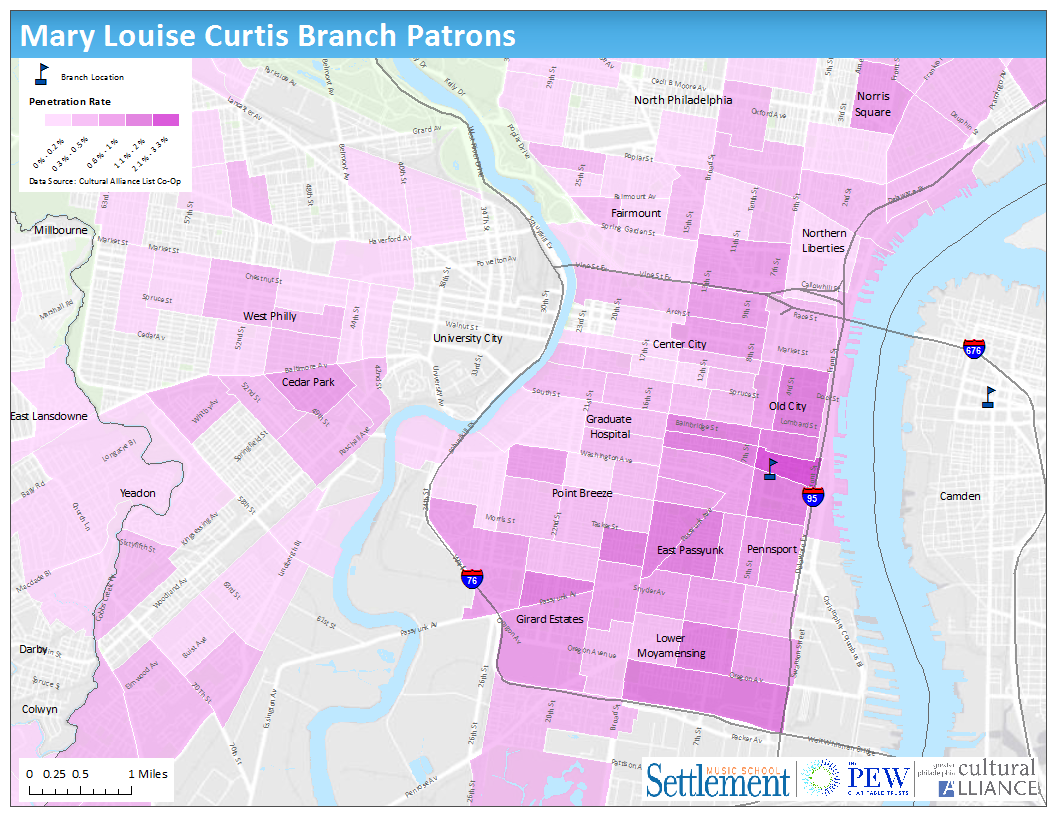
By looking at this, we observed some interesting patterns about where patrons are clustering and overlapping between different branches. First, we noted that patrons for the Queen Village and Germantown branch are very highly clustered close to the branch location, while patrons for the Willow Grove and Northeast Philadelphia branches are spread out with multiple clusters of patrons. There could be many reasons for this, possibly because the population is more spread out in those areas. To get to the bottom of it, we defined primary market areas for each of the branches. To do this, we determined the penetration rate in each census tract and extracted the top twenty tracts with the highest penetration rate. Since we had all of the SMS patron households organzied by branch, we could extract each branch’s data and match to the census tract it falls within. Then, we could get the total number of SMS patron households in each census tract and divide by the total number of households in each census tract. Shown here is the market penetration rate for the Mary Louise Curtis branch in Queen Village. Notice how the highest rate tends to follow Passyunk Avenue southwest of the branch. There are additional areas of high penetration in lower southeast Philadelphia and Cedar Park in West Philadelphia. Overlaying the other demographic and consumer behavior datasets, we can better understand why these areas might have a higher rate and apply that understanding to other parts of the region.
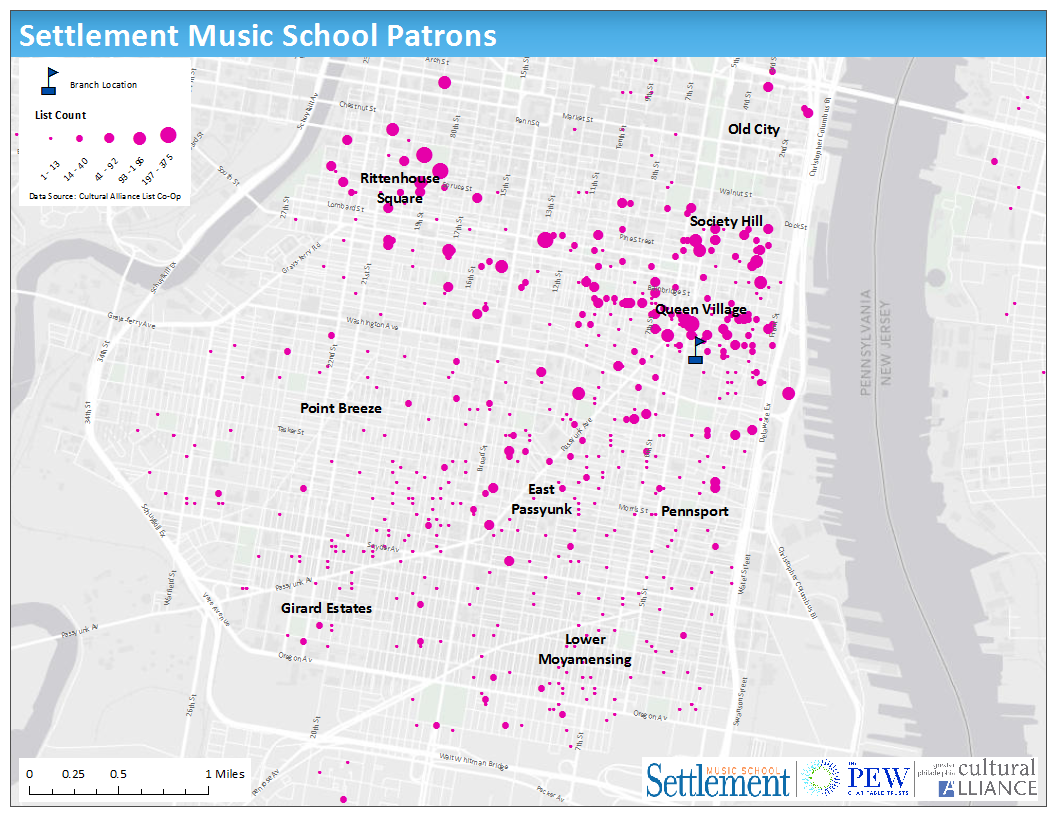
Frequency is another way to look at the SMS data. Since each patron household in the database is linked to a list, we can map them based on the number of lists on which they appear. The more lists the patron is on, the more actively involved in the arts and culture. Using this information, we can find out which parts of the city have low frequency patrons for SMS and which parts of the city have high frequency patrons.
In addition to Settlement Music School, we’re also identifying other arts and culture organizations in the region with which to work. Each organization is unique and the analysis will be tailored to their needs. For example, a theater might be interested in growing their audience by looking at where patrons of other theaters live. A museum might be starting a special program for children and need to identify where young families are living and anticipated to increase in population.
Furthermore, we’ve developed a custom geodatabase for the data and a set of ArcToolbox models to process and display the data. Moving forward, we’ll be working with more organizations and continuing to work with the Cultural Alliance research team about how to manage and leverage their geospatial data. This is an amazing opportunity to support and grow the arts and culture organizations that make Philadelphia a vibrant and exciting city.