
Early in July, The University of Pennsylvania School of Social Policy and Practice and Azavea announced the launch of the Homelessness Analytics web application. The new online database gives communities, organizations and individual’s critical information on trends in homelessness among both the general population and Veterans, including factors related to homelessness and support services aimed at the homeless population.
According to the National Alliance to End Homelessness, there are more than 633,000 people experiencing homelessness on any given night in the United States. The Homelessness Analytics application, developed in collaboration with the National Center on Homelessness Among Veterans (NCHAV) in the U.S. Department of Veterans Affairs (VA) and the U.S. Department of Housing and Urban Development (HUD) aims to enable the general public, researchers and homelessness program planners to fight homelessness by:
1. Understanding the demand for homeless services across time and place nationwide.
2. Identifying gaps between resources and need at a local level.
3. Visualizing the location of community and provider programs alongside data related to capacity, utilization and performance over time.
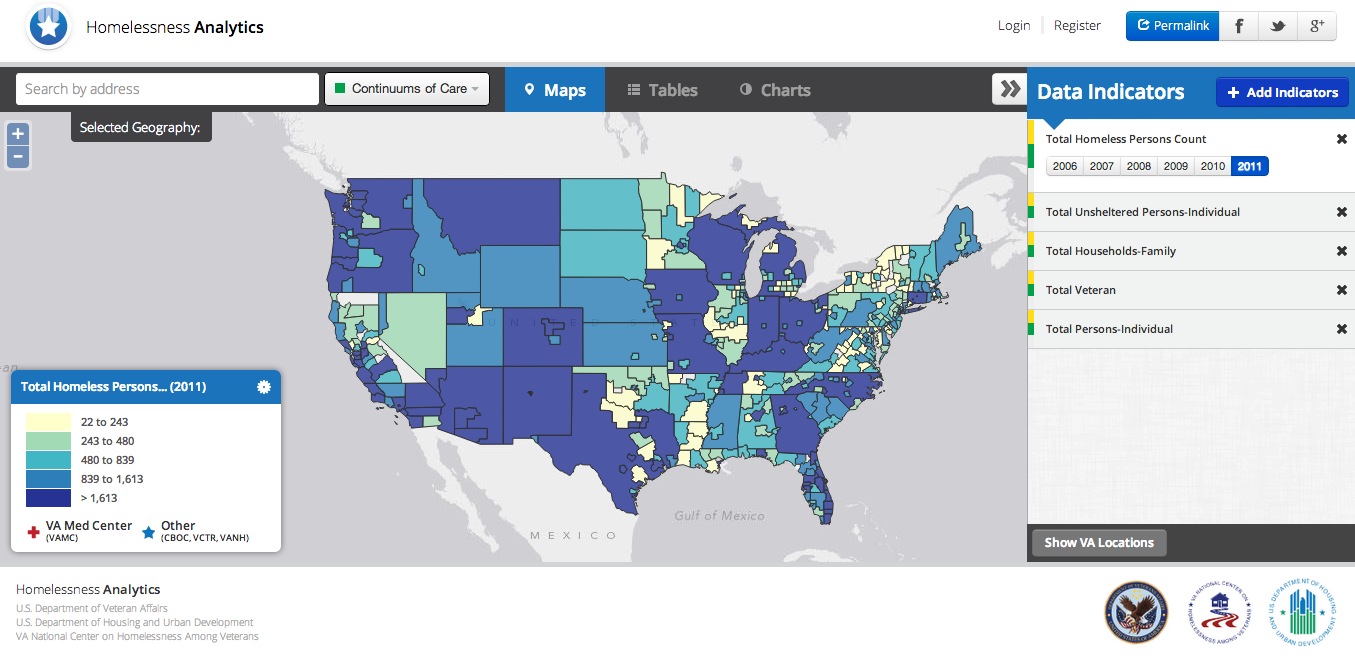
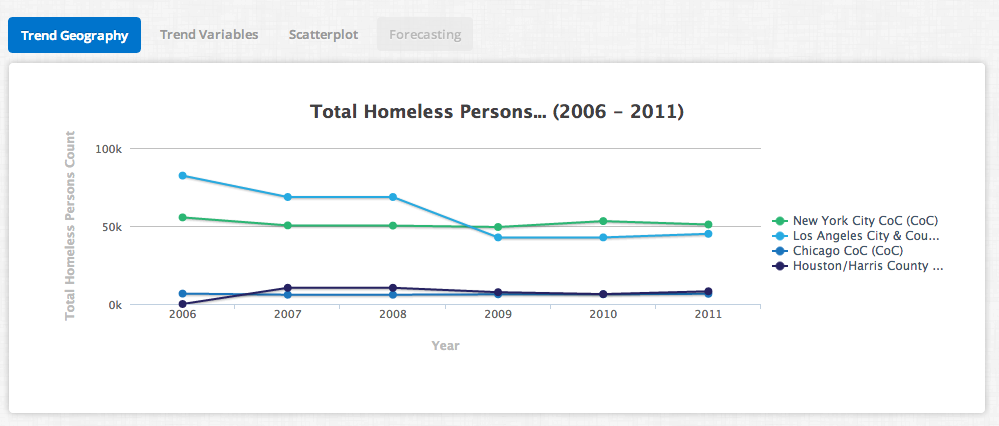
The application provides a feature-rich interface that offers easy access to data on the size of the homeless population and sub-populations as well socio-economic indicators that are related to homelessness gathered from dozens of data sources such as the American Community Survey, the Centers for Disease Control’s Behavioral Risk Factor Surveillance System, the Department of Veterans Affairs Homelessness Program data, the U.S Department of Housing and Urban Development’s Fair Market Rents, and the National Survey on Drug Use and Health. Users can manipulate these data by exploring maps, creating customized tables, and generating charts. They can download brief formatted reports that provide snapshots of homelessness, resources to address homelessness, and related socio-economic indicators for states and local communities. Data can also be funneled to spreadsheets or databases to conduct independent analyses.
The Homelessness Analytics application not only provides access to data but also modeling and forecasting features that enable users to simulate expected changes in homelessness given changes in an underlying community level indicator. For instance, a user can model the relationship between median rent levels and rates of homelessness to better understand how changes in housing market conditions might impact homelessness.
One of the challenges in developing this application was the sheer volume of data to manage. Not only are there hundreds of data points, there are thousands of geographic features. In order to provide a highly interactive map, Azavea developers chose to render the map overlays as client-side generated vectors. Once the geography is rendered, the overlays respond very quickly — but getting the map to its initial display required some optimization and data management. In order to decrease the payload of the JSON file containing the geographic data, Azavea GIS analysts created multiple levels of simplified geometry, so that the application could load a lighter-weight version depending on the size of the geographic extent of the map. For a national map, the most simplified data is loaded, but as the user zooms in, more detailed data is requested from the server. The trick to getting the higher detail data to load quickly is by using a bounding box strategy — only the data that is needed for the map extent is requested (plus a little extra to keep panning fast and smooth).
An extension of this challenge will be in fulfilling a supplemental request for the next phase of the project. The NCHAV has data at the census block group level that can be included in the application. There are about 3,000 counties in the United States. This is what posed the initial development challenge. By contrast, there are over 210,000 block groups. An advanced bounding box strategy using simplified polygons, data aggregation, and non-traditional voodoo is in the works to let the application handle this massive data increase smoothly. We’re excited about the challenge.