
Five categories of information – crime, median household income, median house sales, population, and poverty rate – were evaluated as part of an analysis conducted by NextCity as part of an effort to measure the progress of every neighborhood in Philadelphia.
Olivia Hall (Philadelphia Media Network) and Tom Ferrick, with support from Next City through its Philadelphia in Flux project, compiled and analyzed the most recent data available from several sources. Average scores were calculated for each category, in addition to an overall score for each neighborhood. The data analysis methodology is detailed in a separate document.
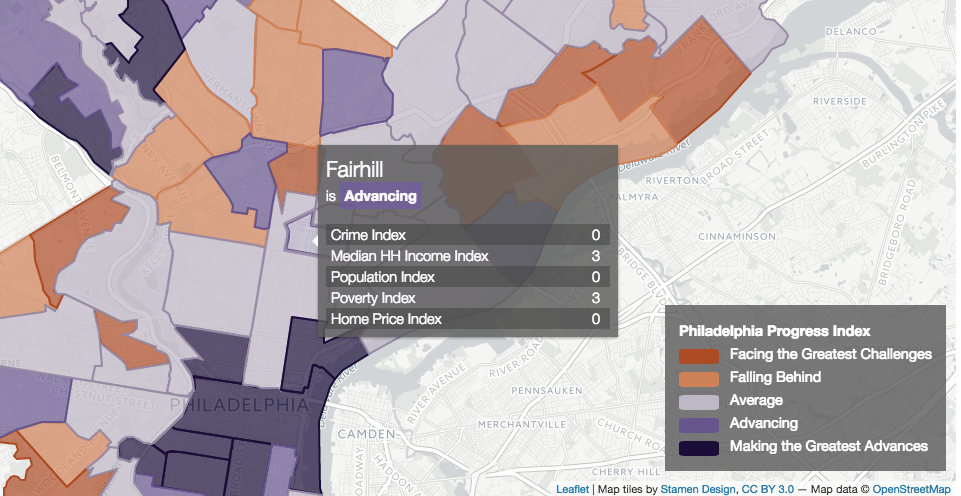
The Azavea Data Analytics Team helped to visualize the story of the data by creating an interactive map that was embedded in the article. Colors indicate the Progress Index of each Philadelphia neighborhood. Users can mouseover neighborhoods to identify the scores by category and the overall rating for the area.
Read the full piece to interact with the map and read about the challenges that face Philadelphia neighborhoods.
Can you picture a similar map enhancing your story? Contact our Data Analytics Team for more information about our services.