
OpenRefine (formerly Google Refine) is an awesome open source tool for working with data. If you haven’t heard of it before, in the words of Christopher Groskopf, “”Once you’ve clustered and reconciled your crufty public dataset into a glistening gem of normality you won’t know how you lived without it.”
Even if you have a dataset that’s useable already though, you might want to add more data to it. This is often why clients come to us for Cicero batch processing and district stamping. Clients can give us a spreadsheet of data with street addresses, often a list of supporters or members exported from their CRM system. Then, we can use the expansive database of elected officials and political districts that underpins our Cicero API to process these large batch processing jobs, geocoding and providing official and district information for each record.
However, one of the cool things about OpenRefine is that you can use it yourself to perform similar batch processing tasks with external APIs, like Cicero! In this blog post, we’ll use OpenRefine to add Philadelphia city council district information to an open government dataset of all Charter School locations in the city. Why charter school data? Whether you’re for or against them, there’s no question that charter schools are a tough local political issue being debated by communities across the country. Using OpenRefine and Cicero to determine the council districts of each charter school in Philadelphia would enable us to determine how many charter schools are in each councilmember’s district. That would be useful information to make councilmembers aware of if we were conducting local advocacy work on the merits or drawbacks of this educational approach. With 84 charters in the city, too, this would be a laborious task without OpenRefine!
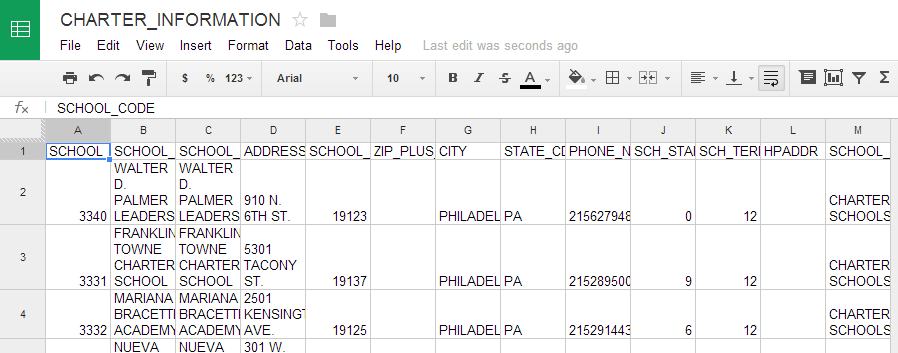
We’ll start by downloading the zipped CSV file from the School District of Philadelphia’s Open Data Initiative site, which can be found through OpenDataPhilly. We see that the file has a few key fields we’ll be using to interact with Cicero – address, zip code, city and state.
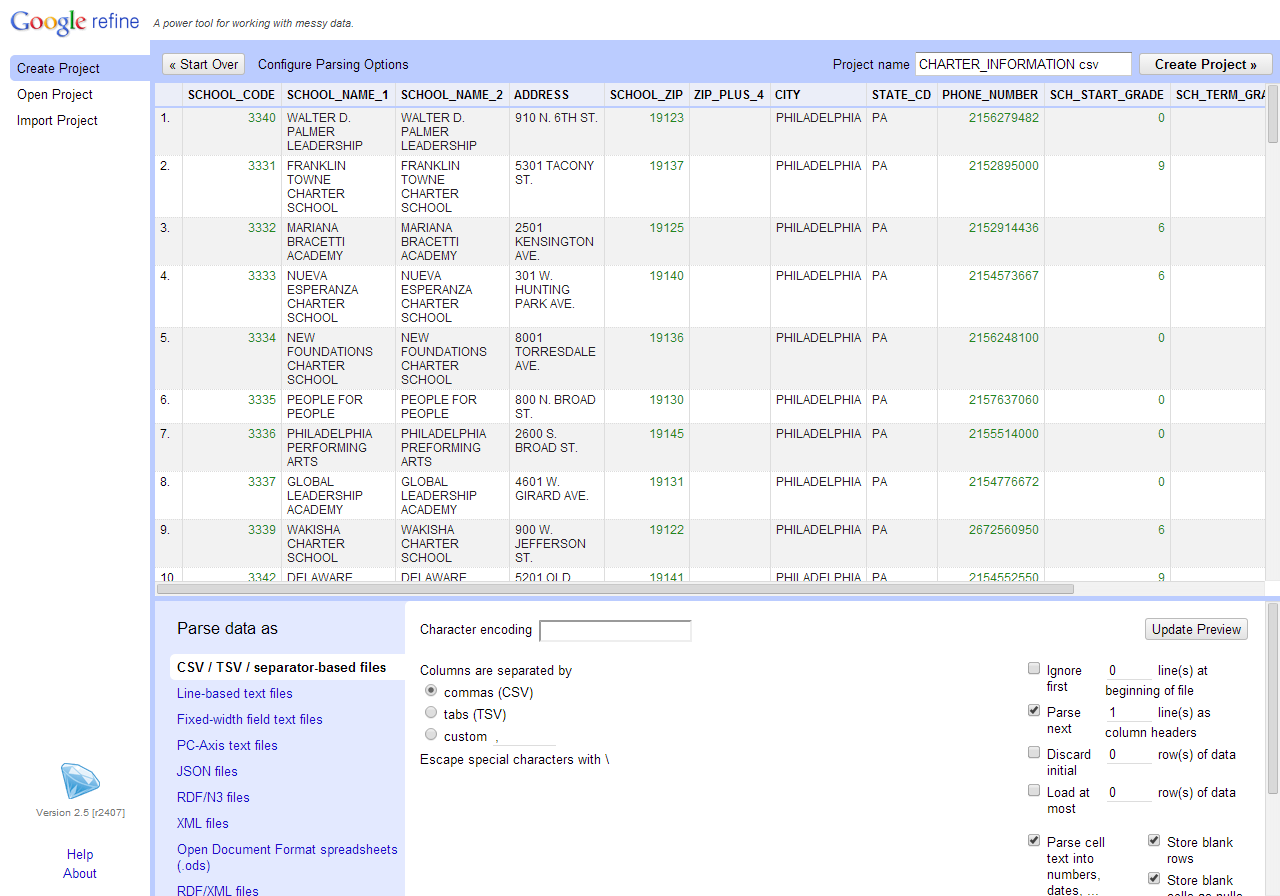
Next, download OpenRefine. OpenRefine is a non-standard desktop program in that it runs in your web browser rather than a regular window. After running google-refine.exe, a browser window should pop up with 127.0.0.1:3333 or something similar in the address bar, and a screen for importing data. Choose the CHARTER_INFORMATION.csv file we just downloaded and hit the “Next” button.
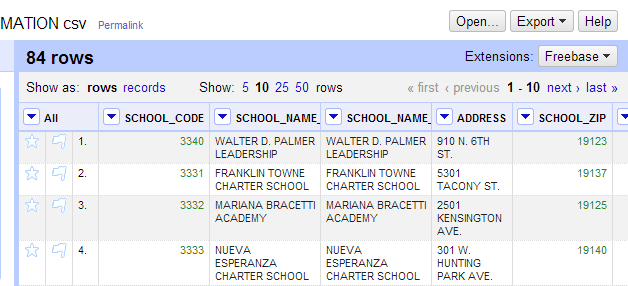
Now our data is in OpenRefine!
With any luck, our school data should appear in OpenRefine. Hit the “Create Project” button in the upper right, changing the project name if necessary. Now your data should be in Refine’s project view like below:
And now we have a Data Project!
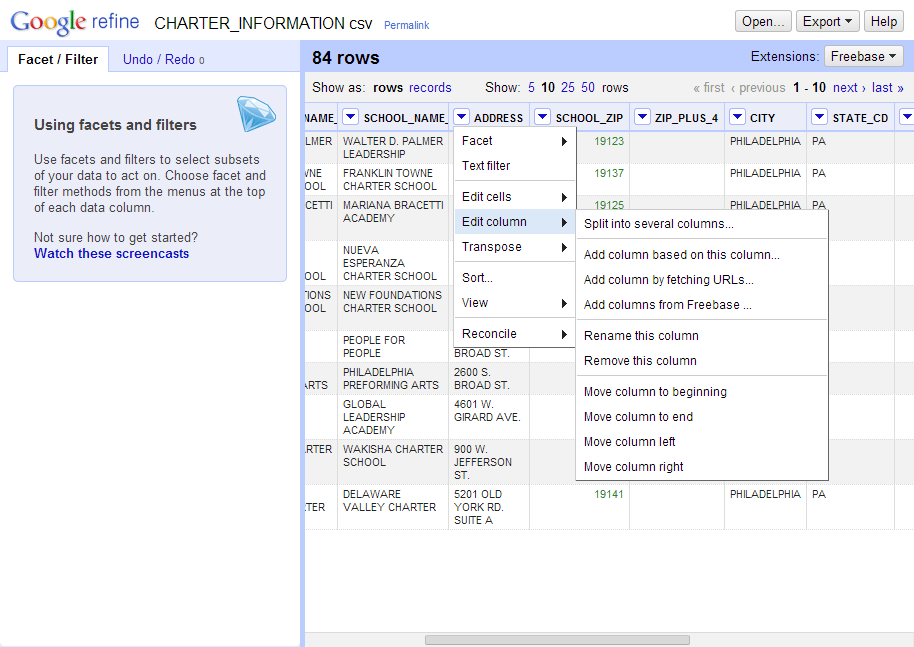
Looking at our columns, we have address, city, state, and zip code information for every school. We should be able to use this information to geocode the schools and get the city council districts from Cicero. To do this, click the dropdown arrow by the ADDRESS column -> Edit Column… -> “Add column by fetching URLs…”:
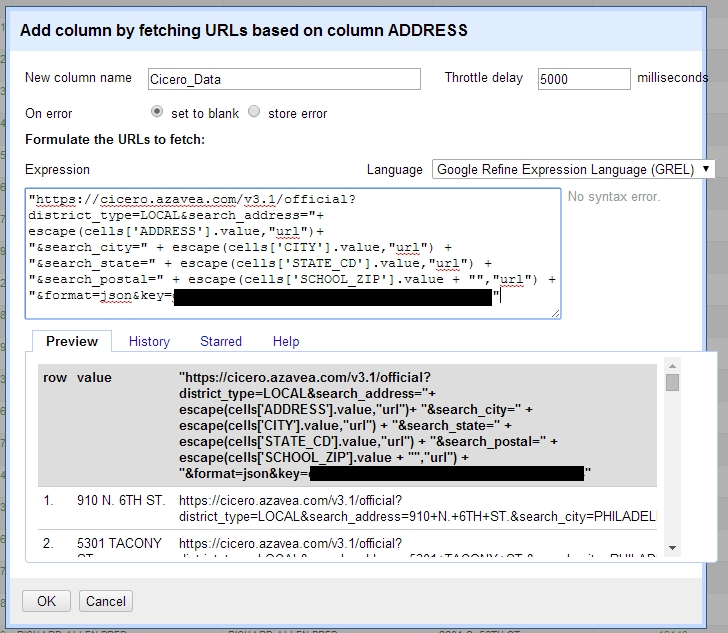
That’ll give us another dialog like the below. We’ll name the new column we’re trying to create “Cicero_Data”, as it will contain a full JSON response from Cicero for every charter school. We’ll parse this column later for the key points of information we want. The “Expression” box is where we will compose the URLs we want OpenRefine to fetch for each charter school record:
Adding a new column based on URLs composed of multiple existing columns of strings and numbers.
You can use a few different programming languages in the Expression box, but for this tutorial we’ll be using the Google Refine Expression Language, or GREL. (It’s taking the OpenRefine project a while to change their name…) GREL is a small-but-just-powerful-enough language for manipulating data within OpenRefine spreadsheets. When you first see this Add Column popup, the Expression box will already have the value of…well, “value”. As you might guess, this is a GREL variable we can use to refer to the value of the current cell our new column’s cell is based off of – in the case above, the ADDRESS of the school record.
But to construct our Cicero URLs with complete address information, we’ll need to access the values of not just the ADDRESS column, but the CITY, STATE_CD, and SCHOOL_ZIP columns as well. How do we do that?
There’s another GREL construct we can use: “cells[‘column_name’].value”. By specifying a column name, like “cells[‘SCHOOL_ZIP’].value”, we can grab the value of any of the columns of a record – not just the column we’re currently working with. This will help us pass our parsed address information to Cicero’s “search_address=”, “search_city=”, “search_state=”, and “search_postal=” fields.
But there’s one thing we should take care around. Almost every street address (ours included) has spaces or other strange characters in it that can make a messy or invalid URL. Fortunately, there’s a GREL function to help with formatting values (ie, escaping), aptly named “escape()“. escape() will take two arguments – the string value to be escaped, and an “escaping mode” – whether you want the value formatted for a URL, HTML, XML, CSV, or JavaScript. So, in our case, every time we need a value from the charter school record in our URLs, we’ll use:
escape(cells['ADDRESS'].value, "url")
Or something similar depending on the column name. One exception is the SCHOOL_ZIP column. US zip codes are composed entirely of numbers, and so OpenRefine recognizes the values of the SCHOOL_ZIP column as numbers and not strings. Unfortunately, escape() only takes a string value as its argument. Though there’s a “toNumber()” function, there is no function in the GREL documentation to convert a number to a string. (I found out later such a “toString()” function exists, undocumented, but it’s a bit weirder than you’d expect.) However, concatenating a number to a string transforms the whole value into a string. So, oddly, we can concatenate the empty string to all our zip code values to make them strings that escape() can accept, like so:
escape(cells['SCHOOL_ZIP'].value + "", "url")
(Side note: Because US zip codes are numeric, we don’t actually need to worry about URL-escaping them. But that’s not the case for every country. Imagine you had an international dataset – with addresses in the US and Canada or Mexico, as Cicero covers. Then escaping in this way would be very necessary!)
Finally, we need to take these values and put them together within the structure of a valid Cicero API URL. As we saw above, the Expression box will let you concatenate multiple string values with a simple “+” operator. So, our complete URL expression (on multiple lines for readability’s sake) is:
"https://cicero.azavea.com/v3.1/official?district_type=LOCAL&search_address="+
escape(cells['ADDRESS'].value,"url")+
"&search_city=" + escape(cells['CITY'].value,"url") +
"&search_state=" + escape(cells['STATE_CD'].value,"url")+
"&search_postal=" + escape(cells['SCHOOL_ZIP'].value + "","url") +
"&format=json&key=your_api_key_here"
Note that we’re using HTTPS and a Cicero API Key (found in your profile), and not a token and user ID. While you can use either, it’s easier to to use an API key in this context. After putting our URL template correctly, the preview box at the bottom will show a preview of some of the URLs to be sent to Cicero. Let’s hit OK and move on!
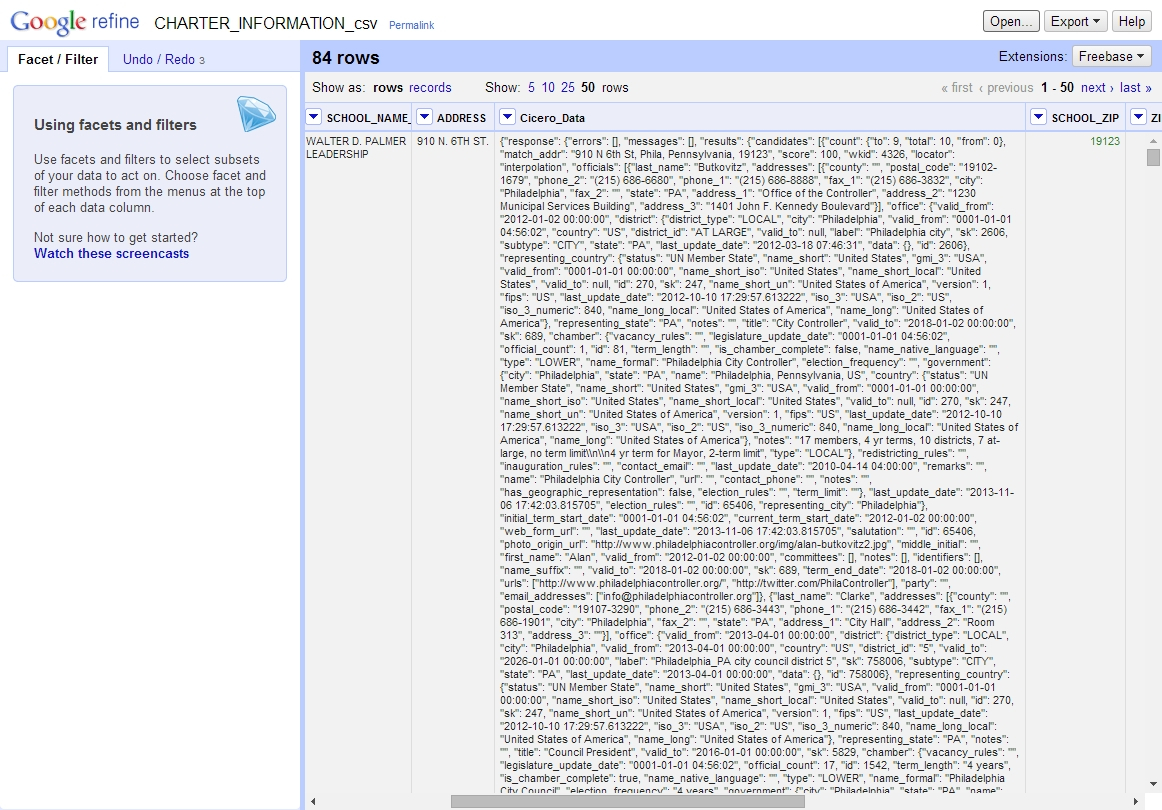
Fresh Cicero data from the Internet, right in our spreadsheet!
A yellow progress indicator will appear for a while as OpenRefine requests the data from Cicero, and if all goes well, we will have a new column of data from Cicero like above!
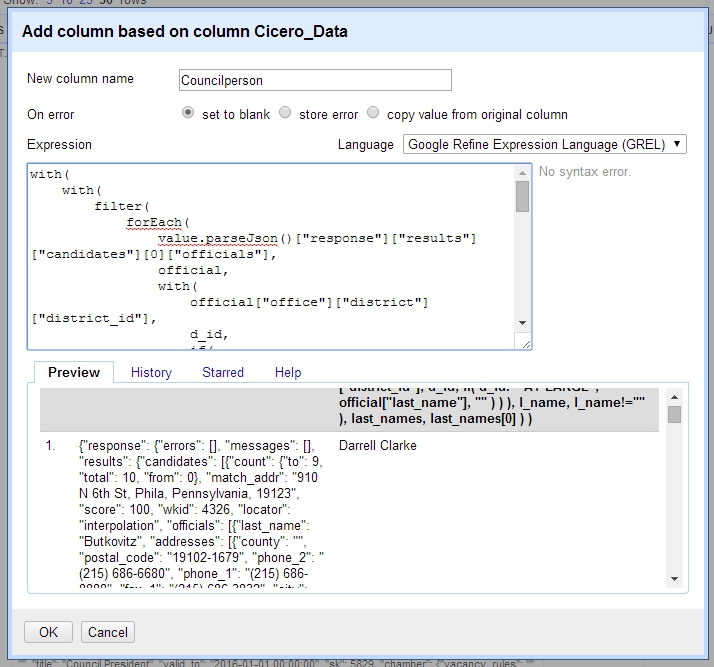
Now, we’ll need to extract the information we care about for our project from this column. Fortunately, GREL provides several functions for working with and filtering through JSON as well. Click the dropdown on the Cicero_Data column, and hit Edit Column -> “Add column based on this column…”. A similar dialog to the one before will pop up:
A large GREL expression parses through our Cicero JSON data to pull out just the first and last names of the school’s district Councilperson.
Also like last time, we’ll use a GREL expression to sift through each charter school’s Cicero JSON data blob to pull out the first and last names of the Philadelphia City Councilperson that represents the council district the school is located in. What makes this tricky is that Philadelphia has several elected officials who are “At Large” – as in they represent the whole city. Every one of the charter schools is in their “district”. We only care about the 10 City Councilpeople who are elected to particular council districts for this project. Also, in the Cicero data blob, each councilperson’s first and last name are stored separately, and we’ll want to concatenate them together and put the result in one column.
We’ll explain it a bit below (GREL does not allow for comments in-line with code), but the final GREL expression to do this is as follows:
with(
    filter(
        forEach(
            value.parseJson()["response"]["results"]["candidates"][0]["officials"],
            official,
            if(
                official["office"]["district"]["district_id"]!="AT LARGE",
                official["first_name"] + " " + official["last_name"],
                ""
            )
        ),
        name,
        name!=""
    ),
    array,
    array[0]
)
We’re using a few GREL control functions, and while this looks like a long expression, there are only a few basic parts:
- The whole expression is one big with() (returns a result of an expression), containing a filter() (returns an array/list), itself containing a forEach() (returns an array/list), itself containing an if() (returns a result of one of two expressions depending on if the test evaluates to true or false). So that’s 4 parts total.
- Let’s take the forEach() first. It’s first part is
value.parseJson()["response"]["results"]["candidates"][0]["officials"],
which uses the parseJson() function to take the Cicero_Data column’s value and drill down to the set of official objects. Since it’s a forEach() “loop”, it will consider one official object at a time – which is the second part:
official,
which is a variable we can use to refer to the official object currently being considered within the forEach() loop. The third part is the if() statement.
- The if() statement itself has three parts. First, it tests that this official’s “district_id” is not (!=) “AT LARGE”, because we only want councilpeople who represent a particular district:
official["office"]["district"]["district_id"]!="AT LARGE",
If this official is not an at-large official but is a district-based one, then the second part, the “true” statement, is evaluated:
official["first_name"] + " " + official["last_name"],
This will concatenate this district-based official’s first and last names, and return the result to the forEach() loop (which, again, is constructing an array). If the official being considered is At-Large, then the third, “false” statement will be evaluated instead:
""
This simply returns the empty string, which we can compare and remove from the forEach()’s array later.
- Now let’s consider the filter() function. This also has three parts – the first being the forEach() loop. However, by the time filter() gets evaluated forEach() will have already returned its resulting array – containing several empty strings and only one full name (Every address in Philadelphia, unlike some other jurisdictions, only has one city council district). The second part of the filter(),
name,
assigns the variable “name” to each element of the array as filter() works through them. And the third part,
name!=""
is the criterion on which we’re filtering – namely all names that are not empty strings.
- Finally, we have the enclosing with() expression. When it’s done, filter() (in our case) will return a one-element array. We simply need to extract this one element to put in our new “Councilperson” column. Much like the other functions, with() will consider the array (part 1, the filter), name it “array” (part 2, the variable), and evaluate a final expression “array[0]” (part 3) which returns the 0th element of the array and will be the value of the entire with().
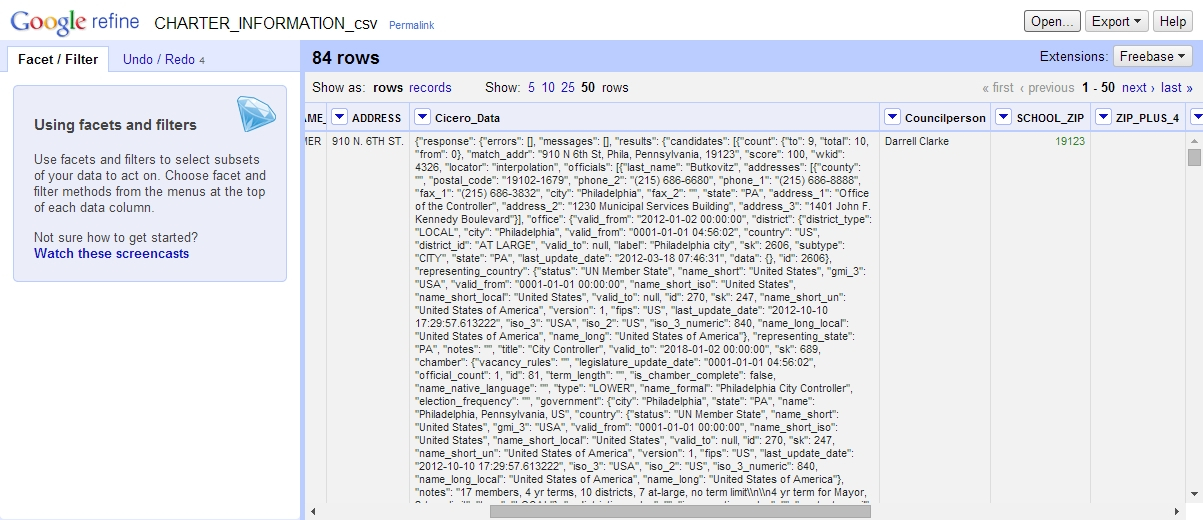
At the end, we’re left with our district councilperson’s name in a new column! Hit OK and let OpenRefine work through all 84 charter schools:
And we have the names of our councilpeople!
Finally, let’s go through the same process again and add yet another column with the council district number. This time, our GREL expression will look like so:
with(
    filter(
        forEach(
            value.parseJson()["response"]["results"]["candidates"][0]["officials"],
            official,
            if(
                official["office"]["district"]["district_id"]!="AT LARGE",
                official["office"]["district"]["district_id"],
                ""
            )
        ),
        district_id,
        district_id!=""
    ),
    array,
    array[0]
)
There’s really only one non-cosmetic change here, and that’s in the if() statement – instead of extracting the first and last names of the non-at-large councilpeople, we’re extracting the district id.
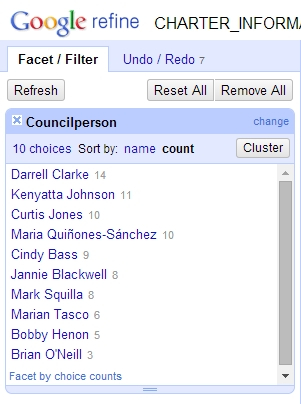
Now, with names and districts in our spreadsheet, we can do some fancy stuff. OpenRefine also has “facets”, which let you quickly slice and dice and see the shape of data. On our new Councilperson column, click the dropdown -> Facet -> Text facet. A sidebar will pop up, listing councilmembers and a small number next to their name. This number is the number of charter schools in their district! Clicking the “sort by count” link will reorder the names in order of the greatest number of schools.
Darrell Clarke has the most charter schools in his district, with 14 total. Compare to Brian O’Neil’s 3 charter schools.
It’s one thing to see these numbers, but it’s quite another to take a look on a map! Thanks to Cicero, our schools are already all geocoded. We can easily export our spreadsheet and upload it to a mapping service like CartoDB. Before we do, let’s extract the x/y coordinate data from the Cicero_Data column. We’ll create two new columns (“x_coord” and “y_coord”, but you could call them anything) based on the Cicero_Data column like we did before, with GREL expressions:
value.parseJson()["response"]["results"]["candidates"][0]["x"]
and
value.parseJson()["response"]["results"]["candidates"][0]["y"]
Then, go over to the Cicero_Data column’s dropdown, and select Edit Column -> Remove this column. That’s just so we don’t have to deal with all the extra data in the export. Then, in the upper right corner, click Export -> Comma-separated value. Your browser will download a CSV with the OpenRefine project’s data.
We can throw this CSV into CartoDB, set the x_coord and y_coord columns as longitude and latitude, and define a Category visualization based on the councilperson column. We emerge with a map!
[iframe src=”http://cdb.io/1oaoq8g” width=”100%” height=”480″]
Questions? Comments? Talk to us about how you can use Cicero or OpenRefine in your data project.