
This Month We Learned gives us an opportunity to share short stories about what we’ve learned and to highlight the ways we’ve grown and learned both in our jobs and outside of them. This month we learned about the React DevTools profiler, medium-term visits to different teams, and numpy tiles.

Alex Kaminsky 
Terence Tuhinanshu 
James Santucci


Tracking down tricky renders using the React DevTools Profiler
Alex Kaminsky
This month I learned that the official React DevTools can be used for more than poking through an application’s component tree. They can also be used to great effect to investigate unwanted renders.
Dynamic maps are one area where these renders can dramatically affect the end user’s experience. In this journey of discovery I was trying to find out why a react-map-gl Layer was re-fetching tiles when a seemingly unrelated interaction occurred. This was not the first time I’d been stumped by an unexpected render but it was the most elusive.
My toolbox for this sort of issue had a few techniques and two tools: why-did-you-render and use-what-changed. Sadly, these tools weren’t providing useful feedback. These tools excelled at solving problems when I knew which component or hook was the culprit. This time, I did not.
Realizing that my toolbox didn’t have what I needed I Googled desperately for something – anything that would point me in the right direction. Hours passed on this fruitless endeavor and left me questioning if I knew anything about React in the first place.

After a walk to clear my head, one thing from my search stuck out to me: multiple blog posts about the React DevTools and “measuring performance.”
I had tried the DevTools in the past for other debugging without success and so I had been dismissing these posts offhand. I decided to give the DevTools another chance. It was also my only lead.
Within 15 minutes of opening the DevTools I had figured out what was going on. Let me show you how.
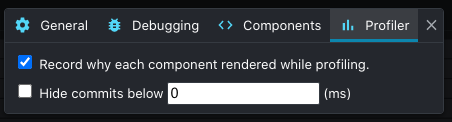
I opened the DevTools and went to the profiler.
Within the profiler settings, I enabled the “Record why each component rendered while profiling.” option.
The next step was to get the application as close to the unwanted render as possible and then clicking the “Start profiling” button.
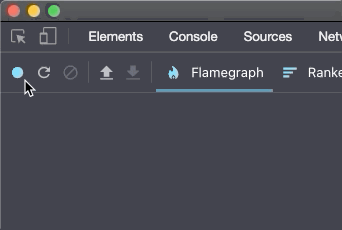
I performed the interactions that caused the unwanted render and then stopped profiling. What I saw next was a flamegraph of components rendered during the profiling session.
The DevTools made it very easy to identify the culprit. Components that did not render during the profiling were grayed out while components that did render were shown in color based on their rendering time.
Hovering over each component in the graph shows you why it rendered:
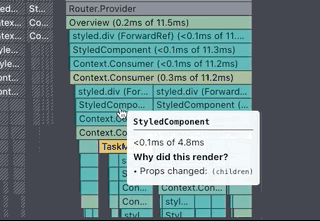
I skipped over components that rendered as a result of their children changing and continued until I found a component that changed for a different reason: props. Lo and behold, a prop change that I did not expect on a component where I did not expect to find it, caused by different objects with the same value.

I learned two things during this journey: the React DevTools can be useful if you know how to use them, and don’t ignore repeated suggestions from reputable blogs.
On visiting teams
Terence Tuhinanshu
Azavea has a number of engineering teams, which have developed expertise in different kinds of technologies, subject matters, and project formats. Typically, engineers start out on one team and stay there. From time to time, there will be an opportunity for an engineer to visit and support other teams. These visits allow for a cultural cross-pollination of ideas and practices. The visitor brings ideas and experiences of their own team, can question and learn the practices of the host team, and bring them back home.
In my five and a half years at Azavea, I’ve mostly worked on my home team of Civic Apps. We make great software, make each other laugh, feel safe to speak our minds, have traditions and mascots and inside jokes, and are always eager to support each other.

Even though I love my team, I always volunteer whenever there is a chance to visit another. I love working with people who I’ve respected from afar (from watching their lectures during Technical Staff Meetings), seeing different ways of team organization (and first-hand experience with other project managers, which is otherwise hard to come by), and gaining new technical insights (such as the benefits of having an elaborate type system in a large project, and seeing how it impacts refactoring).
One of my biggest takeaways from these opportunities is to feel like a beginner again. When working in the same environment for an extended period of time, it is easy to mistake familiarity for competence. New environments are humbling and help build empathy for others in similar circumstances. On the flip side, the experience can be revealing as well. The details of specific technologies may not cross over, but engineering best practices do (atomic design, code reuse, readability, documentation, testing, etc), and are reinforced.
This month I’ve been visiting the Geospatial Apps team, who are smart and gracious hosts. I get to work with TypeScript, see alternative React Redux patterns, dust off some of my Scala skills, and work on interesting problems with interesting people. A notable difference from Civic Apps is how during planning the entire team participates in pointing cards, even on projects that only some work on. On Civic Apps, task pointing is mostly handled by the project participants. While the Civic Apps manner is more efficient, since pointing can be parallelized between different projects and all the people involved already have the right context, the Geospatial Apps manner builds more resilience and spreads knowledge about the codebase to the entire team. This ensures that everyone has a general idea of what is going on in other projects, and the additional practice may make them better at estimating. This, and other ideas, will come with me back to Civic Apps, where we’ll discuss them as a team, and adopt the ones that make the most sense to us.
Working with other people on other projects is the best way to step out of one’s comfort zone and learn from real world experience. I would encourage all engineers to see if they can work on a different team for a brief period. And don’t limit yourself to engineering: try working on operations, or design, or research. The lessons will be invaluable, and the time spent will be cherished.
numpy tiles
James Santucci
This month I learned about numpy tiles. If you’ve served or consumed geographic data, you know there are two formats — raster data and vector data. Vector data is often served as vector tiles or GeoJSON, both of which can be styled by the client without re-requesting data. Not having to re-request the data means you can do fast styling and manipulation with complex shapes. We use these powers in DistrictBuilder to make redistricting snappy and fun.
Web maps of raster data have relied on server-rendered PNGs. Because the server renders them, if you want to change your tiles’ styles at all, you have to ask the server to draw the new tiles and send them to you. That’s a drag for servers since they have to do more work, and it’s also a drag for users since they have to wait for the servers to do work.
But what if I told you… that you could have client-side rendering of raster layers just by serving your data in a common Python data science format.

At STAC Sprint 6 I learned about deck.gl-raster, which exports a deck.gl plugin for consuming tiles in the numpy serialization format.
We haven’t yet done any work with numpy tiles, but we’re planning to add support to Franklin, our open source STAC API server that also supports raster and vector visualization. Franklin serves tiles and STAC json from the same server, so shifting the rendering work to the client for both raster and vector data will save the server a lot of work. Since numpy tiles are a binary serialization format, this work will also give us an opportunity to learn to use a new-to-us Scala library called scodec.
A few months ago we added MVT layer support for collection item footprints and STAC label item assets and I thought we were done with tiles forever, but with numpy tiles there’s new exciting tile serving work to be done.