
This Month We Learned gives us an opportunity to share short stories about what we’ve learned and to highlight the ways we’ve grown and learned both in our jobs and outside of them. In December, we learned about planning five years of a project all at once, superpowered performance debugging with tracing, and tracking down the one bad part of gigantic single line JSON documents with jsonlint.

Deb Boyer 
Peter Caisse Justin Walgran


Planning the next five years of a project
Deb Boyer
When discussing strategic planning, “This Month We Learned” is more like “This Quarter We Worked On Very Long Documents and Spreadsheets All Coming to Fruition in the Month of January.” Multi-year strategic planning is a lengthy process involving revenue and budget projections, review of past workload completion, user surveys, and a fair amount of educated prognostication. The end goal is a project that will serve its users for several years, adjusting to fit their needs while adding new services and features in a fiscally responsible and technically efficient way. So….no big deal. Totally easy.
Since late 2018, we have been proud to assist the fantastic Open Apparel Registry (OAR) team in building an open data platform that holds information on over 52,000 facilities in the apparel supply chain and improves the lives of workers around the world.
Those first two years were funded by a grant from the Laudes Foundation. The Foundation was interested in providing additional funding OAR and asked that we submit a five year strategic plan and budget for their review. Creating that plan was a simple multi-step process where we:
- Held a scenario planning session and thought broadly about our five year goals and potential global changes that could impact those goals
- Conducted user surveys and stakeholder interviews to discover what features people wanted us to add to the OAR
- Completed technical and stakeholder budgets to determine the costs required to add new features and achieve our goals
- Selected a process to evaluate the OAR’s work on an on-going basis in order to report to funders and adjust priorities as necessary
- Brainstormed possible co-funding options and API fees
- Completed a whole separate set of steps to figure out OAR API pricing
- Identified key hires, including a financial manager, a stakeholder manager, and in-country community managers, to grow the reach of the OAR into producing markets
- Planned two years of technical development and costs for general support, maintenance, and hosting
- Wrote a draft
- Wrote another draft
- Submitted everything to our OAR board chair and treasurer and adjusted based on their feedback
- Submitted everything to the full OAR board for official approval
- Talked and talked and talked and talked about key performance indicators
- Submitted everything to the grant manager for review. Cue additional edits…
There were many smaller steps along the way. I’m no stranger to budgeting, technical planning, stakeholder engagement, etc but planning on a five year level rather than for a quarter is a whole different process. It was fascinating to work through all the tasks necessary to plan for the growth of OAR as a non-profit and the website as an open data platform.
We learned in late December that the Laudes Foundation had approved our five year strategic plan. This month, we embarked on the first step in that strategic plan and kicked off hiring for the OAR team and a new set of technical tasks. We’re excited to continue our relationship with OAR and see how the platform grows over the next five years.
Tracing for debugging superpowers
Peter Caisse
Tracing is a type of instrumentation similar to logging that provides insight into where a program spends its time while executing. With tracing, you can wrap relevant parts of your code in a tracing context to measure how long each part took to ultimately answer the question “Which part is slow?” Once you have thoroughly added tracing to your code, you almost feel like you have a superpower!
We recently used tracing to help tackle a vexing performance issue in our tile server. The problem was that we would occasionally see slow tile server responses — affectionately dubbed 🐢 tiles — but we weren’t sure why it was happening and the issue was difficult to reproduce. Tracing to the rescue!
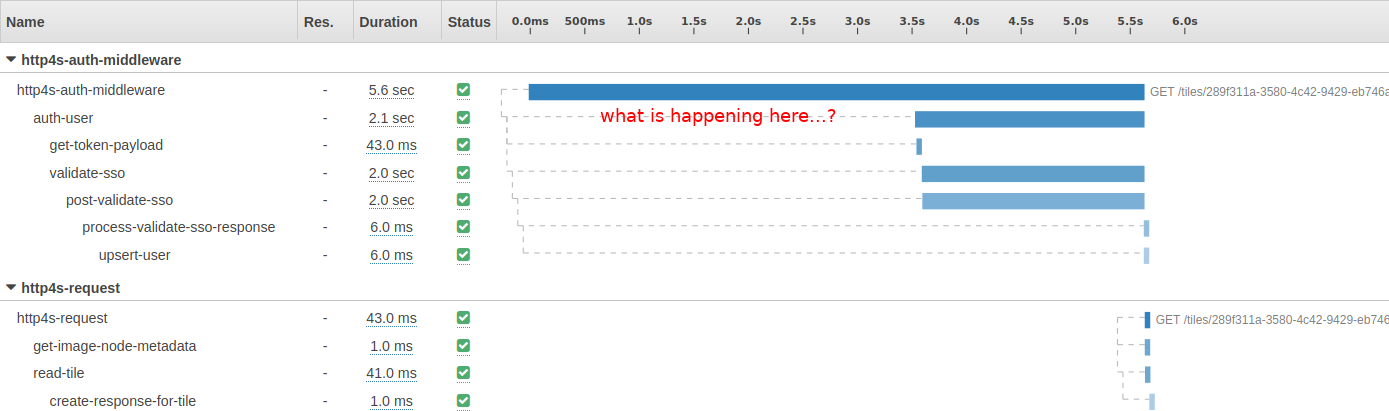
Here is an example trace in the AWS X-Ray console:
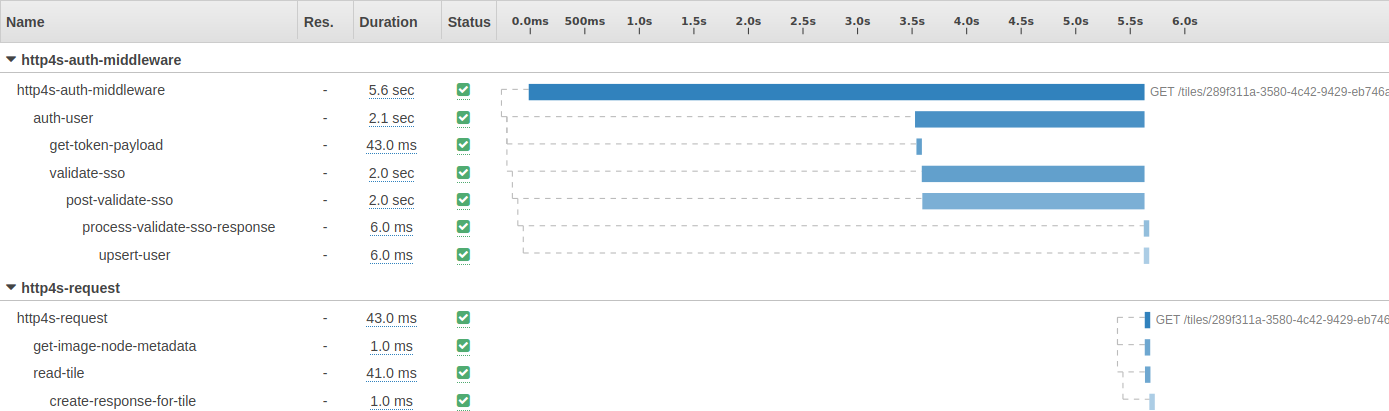
We first see the tile request pass through our auth middleware. We retrieve the user’s token from a cookie and authenticate with a third-party single sign-on (SSO) service. Once authenticated, fetching the image metadata, reading the tile, and creating the response was quick.
This brings us to the question of what exactly was happening for the first 3.5s of this request where authentication is waiting on… something!
As it turns out, we’d misconfigured our thread pool, resulting in contention when fulfilling tile server requests and the type of behavior shown in the trace. Tracing, in conjunction with logging and visualizing threads while the application was running using VisualVM, allowed us to diagnose and fix the issue. And now that we have tracing in place covering the entirety of a tile server request, we’ll be well-positioned to track down any further tile server performance issues should they arise.
Parsing and fixing bad JSON with jsonlint
Justin Walgran
At Azavea we strive to build our web services using as many of Twelve-Factor App principles as possible. As a result, in the most stressful of cases
where a feature works in development and in staging but crashes in production, we can focus our initial debugging efforts on the areas where there are differences by design, data, and configuration.
When I recently encountered a production-only crash in a React/Redux application, I used the Redux DevTools to find a fail event being dispatched even though the JSON API call to which it was related was successful. By setting a breakpoint in the debugger I was able to inspect the JSON response and, using JSON.parse, I determined that the JSON was invalid.
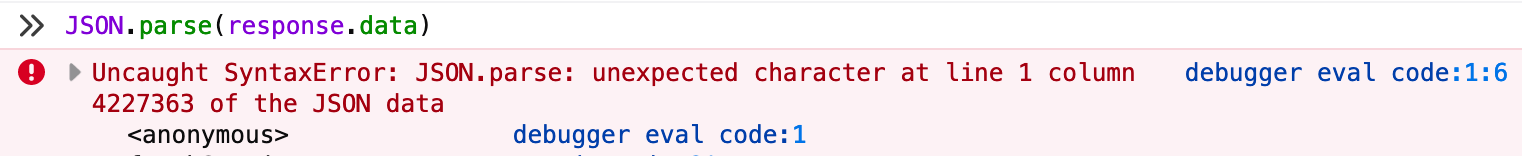
This was a good start, but the fact that JSON.parse does not display any
context for the error and the fact that this API response is a non-pretty
printed single line left me without a clear explanation of what was wrong.
JSON Lint is a web service and a node-based command line tool that
validates JSON data and provides helpful error messages with context. In the Firefox console I used copy(response.data) to get the malformed JSON on my clipboard so I could paste it into a file. After installing jsonlint with npm install -g jsonlint, I
was able to inspect my file and get a more helpful error message:
$ jsonlint badjsonstring.json
Error: Parse error on line 1:
...8665699999999, "x": NaN, "spatialReferen
-----------------------^
Expecting 'STRING', 'NUMBER', 'NULL', 'TRUE', 'FALSE', '{', '[', got 'undefined'
    at Object.parseError (/usr/local/lib/node_modules/jsonlint/lib/jsonlint.js:55:11)
    at Object.parse (/usr/local/lib/node_modules/jsonlint/lib/jsonlint.js:132:22)
    at parse (/usr/local/lib/node_modules/jsonlint/lib/cli.js:82:14)
    at main (/usr/local/lib/node_modules/jsonlint/lib/cli.js:135:14)
    at Object.<anonymous> (/usr/local/lib/node_modules/jsonlint/lib/cli.js:179:1)
    at Module._compile (internal/modules/cjs/loader.js:1137:30)
    at Object.Module._extensions..js (internal/modules/cjs/loader.js:1157:10)
    at Module.load (internal/modules/cjs/loader.js:985:32)
    at Function.Module._load (internal/modules/cjs/loader.js:878:14)
    at Function.executeUserEntryPoint [as runMain] (internal/modules/run_main.js:71:12)
JSON Lint had revealed the issue. An invalid numeric value in the application database had been serialized as NaN, which is not a valid JSON value. I had found the column I needed to fix, but not the row. To quickly find the whole object containing the NaN and get the record ID I was able to use another previously unknown feature of JSON Lint. Running a file through jsonlint with the -p option will pretty print the JSON even though it is invalid. A simple search for : Nan in the pretty printed version of the file revealed the problematic record, and, one quick trip to the database console later, production functionality was restored.