
This Month We Learned (TMWL) is a recurring blog series highlighting what we’ve learned in the last month. It gives us an opportunity to share short stories about what we’ve learned and to highlight the ways we’ve grown and learned both in our jobs and outside of them. This month we learned about Google Earth Engine apps, authenticating with the Google Sheets API, and making smaller tiffs for debugging with gdal_calc.py.

Ross Bernet 
Tyler Gilcrest James Santucci


Google Earth Engine Apps
Ross Bernet
Google Earth Engine (GEE) is a game-changer for analyzing and visualizing earth observation data. Google provides access (FOR FREE!) to petabytes of data AND the cloud-based computation resources to process the data. It does so at speeds that feel magical to someone used to chunking through a single Landsat scene on desktop software. Exactly how they do this and how long they plan to provide this service is not something I learned this month. Rather, I learned how to expose data from GEE to a publicly available URL and share my findings with the world.
GEE provides a web-based code editor that enables a few lines of JavaScript to perform advanced remote sensing operations.
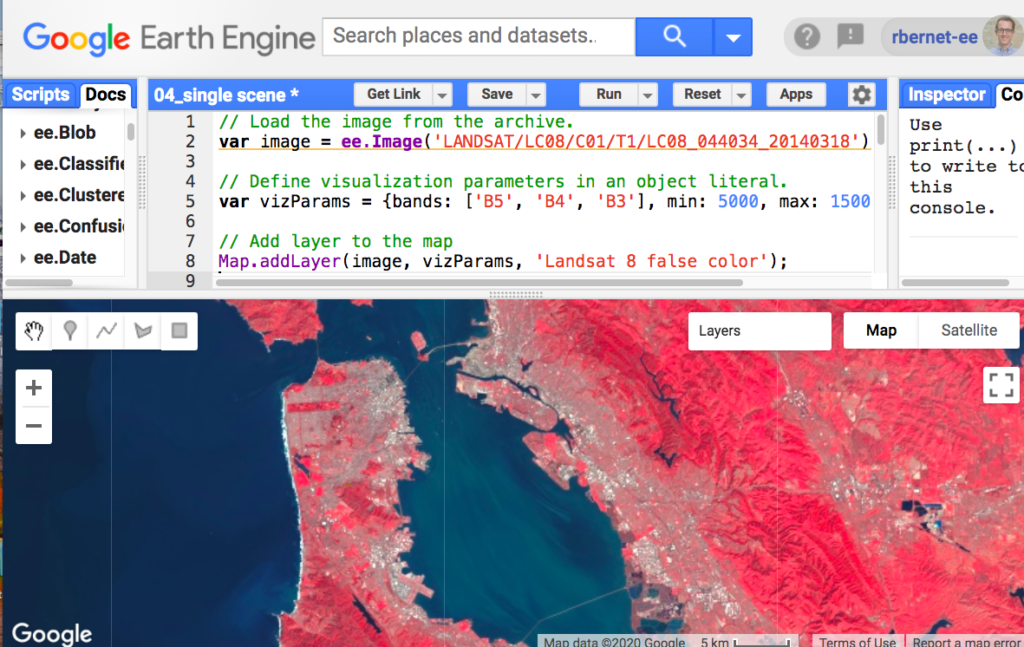
Until the introduction of Earth Engine Apps, I had no way to share the results beyond a screenshot or GeoTIFF export. But now I can share a link directly to the resulting layer — you can see the Landsat layer from the screenshot here. It also supports widgets and additional UI functionality, but that will be for my next TMWL.
A few button clicks in the code editor let you export a script as an Earth Engine App. It took about 45 seconds of button clicking to create the app, and then another couple minutes of Google Earth Engine server magic to expose the layer at the URL. I used GEE’s documentation on Earth Engine Apps to learn it quite quickly.
Why did I learn this now?
A potential client for Azavea shared data with us that contained the locations of farms in Africa. They wanted to know what insights they could derive from satellite imagery. Well. Free satellite data is a blessing for many reasons. But image resolution is often a limiting factor — it’s hard to identify objects smaller than a football field (or so) with free satellite data. Here is a comparison of my high school’s football field with Sentinel-2 imagery and imagery from Google Maps via MAXAR for comparison.
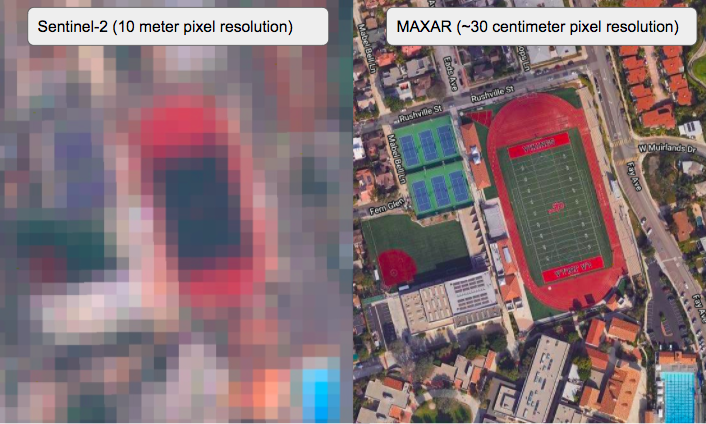
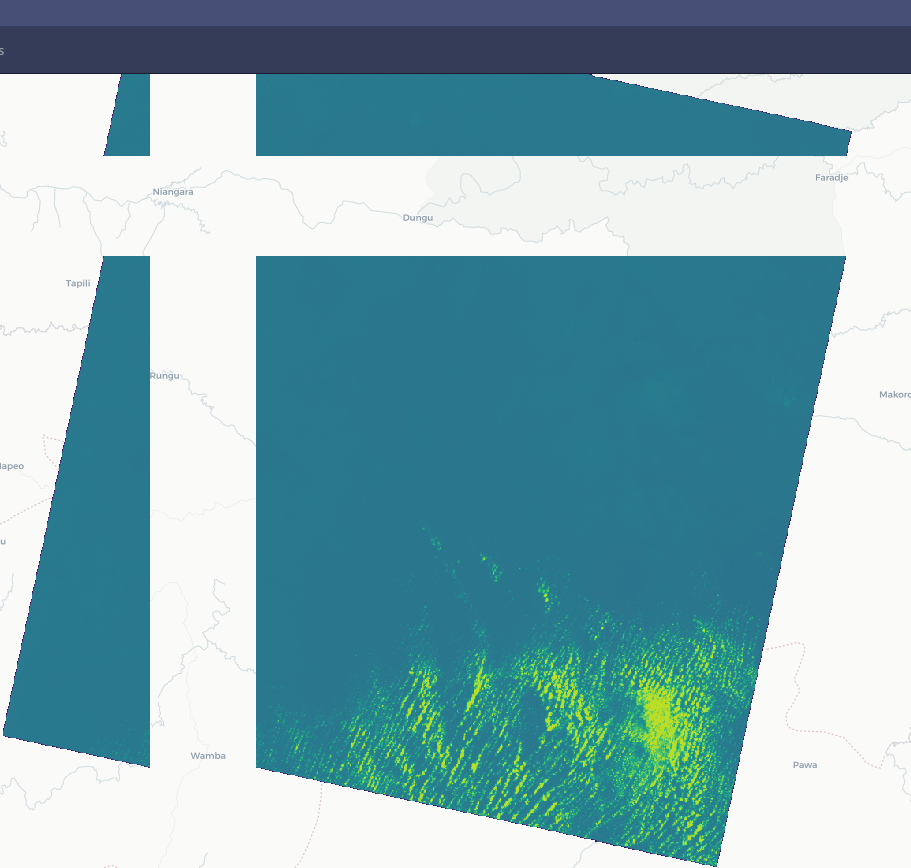
The two most resolute public satellites in the world, Landsat 8 and Sentinel-2, have a resolution of about 30 meters and 10 meters respectively. That means it’s hard or downright impossible to identify things like cars, boats, small buildings, and even small agricultural fields. It’s valuable to set expectations around what’s possible with a potential client by showing them their data alongside the imagery. In this case, the client shared a spreadsheet that contained farms with GPS coordinates. I was able to upload the data into GEE and display it on a map with a cloud-free mosaic of Sentinel-2 images.
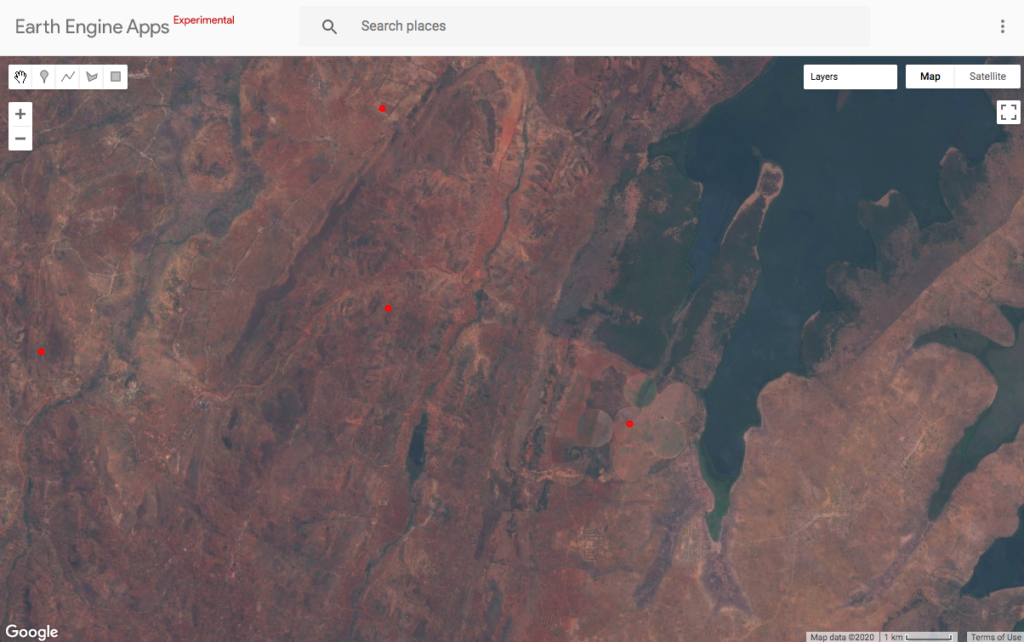
There is so much more to do with Earth Engine Apps. But this was an itch I longed to scratch, and thanks to GEE’s excellent documentation, I was able to learn how to upload the points, generate the cloud-free mosaic, and share the link in a couple of hours. Next time it will take me 30 minutes or less to repeat the process. I look forward to learning more about Earth Engine Apps.
Authenticating with Google Sheets API
Tyler Gilcrest
Google Sheets is a critical part of our project management tooling. It provides a powerful, flexible way to store and analyze data. As part of a personal Azavea 10% time project, I am working on extracting data contained in Google Sheets to be inserted into a PostgreSQL database to do deeper analysis than is possible in Sheets. Luckily, Google offers a robust API for interfacing with data stored in Sheets.
Before I could do any data munging, however, I first had to learn how to authenticate to the Sheets API. Google provides good quickstart tutorials for various languages (I’m using Python), but it fell short for my needs because it only describes an interactive (command-line) use-case. This requires the browser to prompt you to enter Google credentials to authenticate to the Sheet you’re trying to access. I’d rather not come back every month to re-authenticate to the sheet. I wasn’t sure what I needed for a server-based solution, and Google’s link to this documentation wasn’t particularly helpful. After a lot of Googling, I was able to piece together what we need for server-based authentication to Google Sheets.
First, we need to start in the Google Cloud Platform console. Even free Gmail accounts can sign into GCP and the free tier has access to all the resources needed with generous limits. In the navigation menu, create a Project to contain your server credentials.
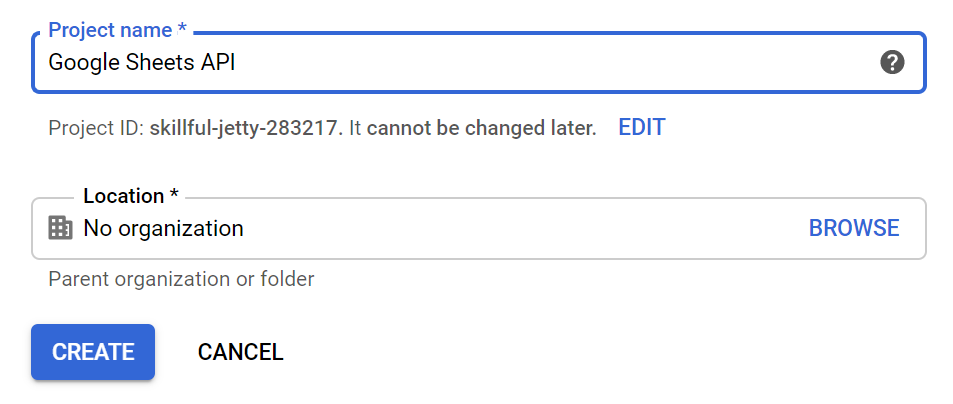
After you’ve created a project, your top bar will look like this:
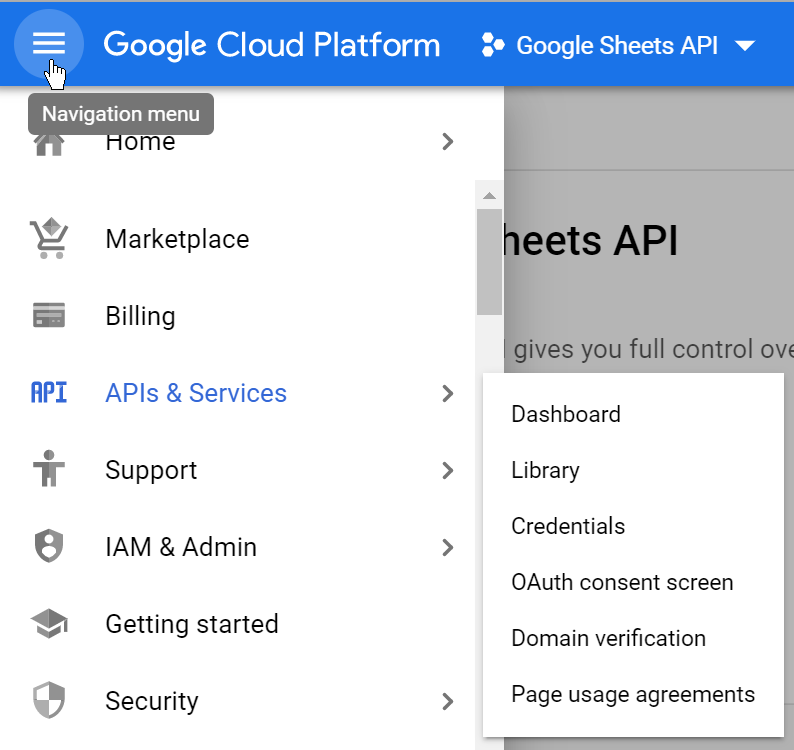
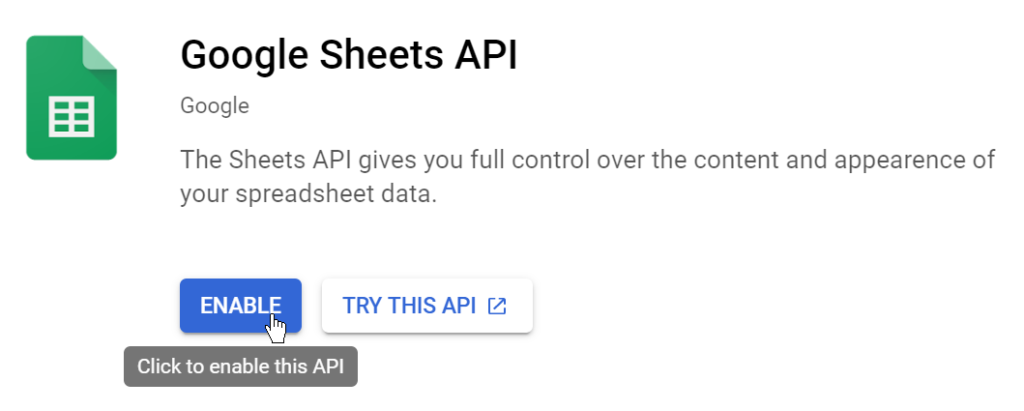
Once created, we need to enable the Google Sheets API for the project. In the navigation menu, go to APIs & Services > Dashboard, and click “Enable APIs and Services”. Search for the Google Sheets API and enable it for this project.
Now we need to create a “Service Account”, which will govern the credentials for our server’s authentication. In the navigation menu, go to IAM & Admin > Service Account and click “Create a Service Account”.
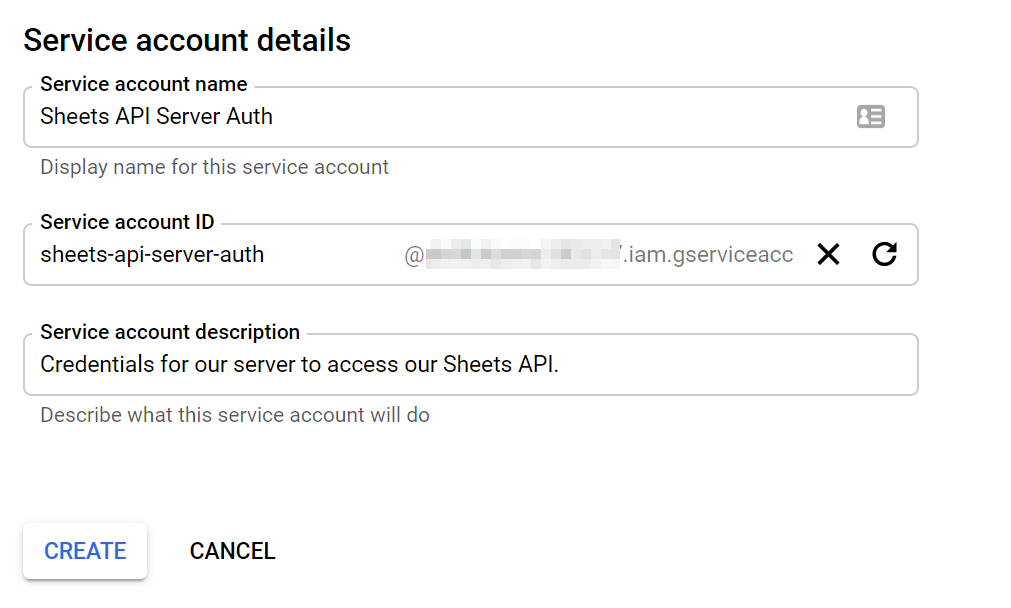
Give the Service Account a name and description. Note that the “Service account ID” field hints at an email address. We will use this email later to grant the server access to the Google Sheet.
Assign a role (Project > Editor is sufficient for our needs), skip the step to grant users access to the Service Account, and hit Done to finish the Service Account setup.
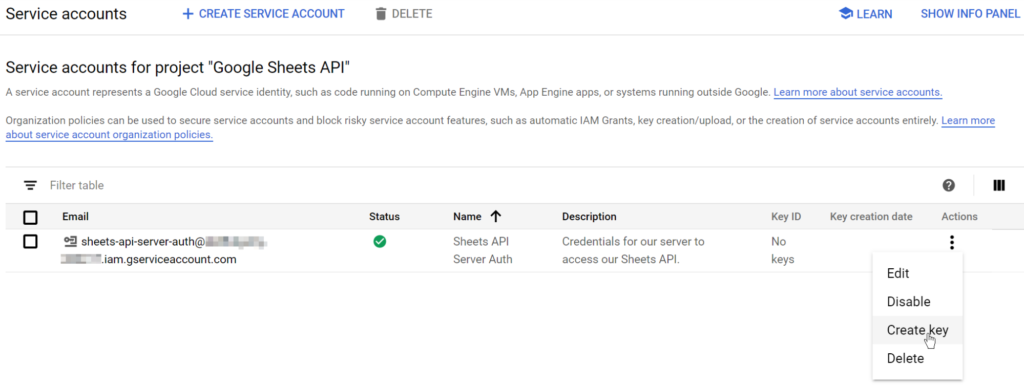
Now that we’ve created our Service Account, we need to create a key that our server can use to identify as the Service Account. From the Service Account page, we find the Service Account we just created and select “Create Key” from the Actions menu. Create a JSON key and save it to your local machine (e.g. to the working directory with our python script).
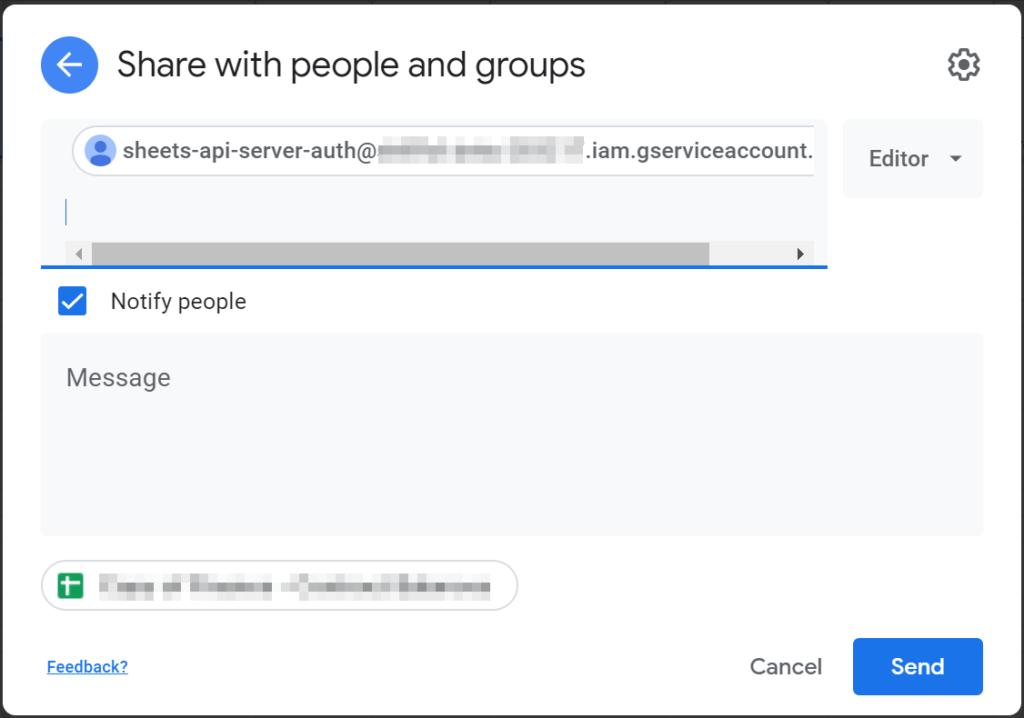
We also need to add the Service Account email to the Google Sheet we want it to access. Copy the email address from the Service Account page and paste into the Share dialog for the Google Sheet, just as you would if you were sharing the document with another user.
While we’re here, let’s grab the document ID from the URL. It can be found here in any Google document (Sheet or otherwise):

Now we’re finally ready to write some code! And we don’t need very much to authenticate and start getting some data out of our spreadsheet. This snippet of code grabs all the data from our Sheet and returns a count of the rows:
import os.path
from googleapiclient.discovery import build
from google.oauth2.service_account import Credentials

scopes = ['https://www.googleapis.com/auth/spreadsheets']

sheet_id = 'your-sheet-id'
range_name = 'Sheet1'
secret_file = os.path.join(os.getcwd(), 'your-secrets-file.json')

creds = Credentials.from_service_account_file(secret_file, scopes=scopes)
service = build('sheets', 'v4', credentials=creds)

result = service.spreadsheets().values().get(spreadsheetId=sheet_id, range=range_name).execute()
rows = result.get('values', [])

print('{0} rows retrieved.'.format(len(rows)))
First, we specify the scopes of Google APIs we want access to. Next, we provide the Sheet ID, range (which Sheet tab), and the key file we downloaded from GCP. Then we use the credentials we provide to authenticate to the spreadsheet and get the values from the spreadsheet.
We can alter this script to transform the data any way we want. But this also works for more than just reading data, and the API offers several different methods that can be called on spreadsheets.values. This approach means our server can communicate with Google Sheets without needing to ask our permission!
Shrinking Tiffs with gdal_calc.py
James Santucci
Groundwork depends on our ability to take imagery from users and transform it into something we know we can tile efficiently. To do this, we rely on some asynchronous processing jobs and GeoTrellis to produce cloud-optimized GeoTIFFs (COGs) and then read tiles from those COGs.
Sometimes everything goes perfectly. Other times, processing will fail in a surprising way. Still other times, processing will succeed and the tile server will happily give us tiles, but something will seem not quite right.
Usually, it’s not the data in the source imagery — the values in its raster cells — that causes these problems. Instead, it’s frequently something with the image’s metadata or how we’re handling that metadata — its extent, overviews, or projection, among other things. This means that we should be able to nurble most of the tiff’s data to make it much more compressible and work with a much smaller tiff while debugging. But how can we replace all the tiff’s data efficiently?
Recently I learned about the gdal_calc.py command-line tool. Using this tool, you can express transformations you’d like to apply to an image’s data in a terminal. I think the intended use of this tool is to do complicated map algebra, but that doesn’t need to limit our imaginations.
Because I only cared about preserving geographic metadata and which cells had data, and because I was lucky enough to have a tiff where the no-data value was zero, I could apply a function that checks whether a cell is greater than zero to get a tiff full of only zeros and ones. Then I added compression back to get a much smaller image to work with.
$ gdal_calc.py -A foo.tif --calc="A > 0" --quiet --outfile=small.tif
$ gdal_translate.py -co COMPRESS=DEFLATE -co PREDICTOR=2 small.tif smaller.tif
With this strategy, I shrunk a roughly 600-megabyte multi-band tiff to a one-megabyte single-band tiff that preserved all of the information that I cared about.