
This Month We Learned (TMWL) is a recurring blog series highlighting what we’ve learned in the last month. It gives us an opportunity to share short stories about what we’ve learned and to highlight the ways we’ve grown and learned both in our jobs and outside of them. This month we learned about the PostgreSQL citext extension, safe fuel and air mixture adjustment at altitude while flying airplanes, fast time-series visualization with vector tiles, and pushing refinement types into the database.

Mike Maurizi Jeff Frankl 
Peter Caisse


citext in PostgreSQL
Mike Maurizi
For Temperate, Azavea’s climate change adaptation and planning tool, many recent support requests shared a theme: users of the site had forgotten how to spell their email addresses! Or rather, they’d spelled it the same, but changed the case, using something like name@companyfruit.edu during signup but name@companyFRUIT.edu when trying to login.
After we determined that there were no duplicate users sharing the same email address, we decided it was safe to expand our email address uniqueness constraint to be case insensitive. By doing this and changing our code to query for users in a case insensitive way we’d eliminate these kinds of login and registration confusion.
We considered changing all of our users email addresses to be stored only in lowercase, and converting all email addresses to lowercase during registration, but we felt that would provide a poor experience to those whose addresses are meant to have certain letters capitalized.
Luckily, there is a PostgreSQL extension that came to our rescue, citext. By using citext and a few wrapper fields provided by Django to change our email field to a CIEmailField, all calls using it automatically call LOWER() on both strings in comparison or sorting operations without any impact on the values presented to users.
We made the following code change, generated migrations, and were good to go!
index 3df00199..f1357548 100644
--- a/src/django/users/models.py
+++ b/src/django/users/models.py
@@ -8,6 +8,7 @@ from django.contrib.auth.models import PermissionsMixin
 from django.contrib.gis.db import models
 from django.contrib.gis.geos import Point
 from django.contrib.postgres.fields.array import ArrayField
+from django.contrib.postgres.fields.citext import CIEmailField
 from django.db import transaction
 from django.db.models.signals import post_save
 from django.dispatch import receiver
@@ -348,7 +349,7 @@ class PlanItUser(AbstractBaseUser, PermissionsMixin):
     USERNAME_FIELD = 'email'
     REQUIRED_FIELDS = ['first_name', 'last_name']

-    email = models.EmailField('email address', unique=True)
+    email = CIEmailField('email address', unique=True)
     organizations = models.ManyToManyField('PlanItOrganization',
                                            related_name='users',
                                            blank=True)
Now in all of our login and registration user email addresses are case insensitive, with just a few small code changes and a database migration.
Aircraft piston engine performance
Azavea
When flying a piston-powered, fixed-pitch propeller airplane, there are two basic engine controls: throttle and mixture. For combustion to occur, you need fuel and air. A carburetor is a device that mixes air with fuel and delivers it to the engine cylinders. With a carbureted engine, the throttle controls how much of the fuel-air mixture is delivered to the cylinders. The mixture controls the amount of fuel added to the airflow, or the ratio of fuel to air.

You’d never think about this when driving a car, but at higher altitudes, air is less dense. Let’s say you begin a climb and you don’t adjust the mixture. With fewer particles of air floating around as you climb but the same amount of fuel, the mixture being delivered to the cylinders will get richer and richer.
I had a discussion with some folks about power management. I realized that, despite my planning for “best economy” mixture, when I reached cruise in flight I would just pull the mixture control back far enough to say “hey, that feels right.”
This led me down a rabbit hole of interesting research, including watching two talks from Mike Busch, a well-known A&P/IA and founder of an aircraft maintenance company.
I learned that there are a range of mixtures where the engine is able to achieve combustion. However, there are a few really interesting mixtures.
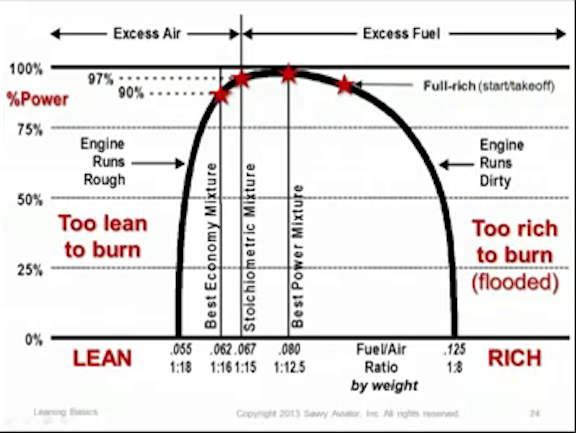
Stoichiometric Mixture is the chemically perfect ratio. At this mixture, all the fuel and oxygen that are part of the combustion reaction are completely consumed. Running this mixture also happens to put the engine in a very abusive operating zone.
Best Power Mixture is richer and uses 20% excess fuel for about 3% more power (1.5% true airspeed). To find this mixture, lean until RPM peaks.
Best Economy Mixture is leaner and uses 20% less fuel for about 10% less power (5% true airspeed). To find this mixture, quickly lean the mixture until the engine runs rough (because the mixture is too lean to burn) and slowly richen, just enough to make the engine run smooth.
Full Rich Mixture occurs when the mixture is wide open. It uses 50% excess fuel and yields the same power as stoichiometric mixture, but it has an increased margin against the occurrence of detonation during full power operation. We use this during takeoffs, landings, and maneuvers because it is simple, it will provide adequate cooling for the engine, and it provides acceptable performance.
This research emphasized how important it is to understand everything that’s going on with your airplane. You could run out of fuel, without adequate margins, if you plan for fuel burn at best economy mixture but fly the plane at best power. Also, around stoichiometric mixture, cylinder head temperatures peak, which reduces their tensile strength. So, there are safety and engine longevity reasons for why you’d want to be careful in how you lean.
I went flying to apply some of what I learned on a cross country flight. On takeoff, I realized I was barely climbing out of the airport. I leaned for best power mixture, performance was restored, and I continued my climb as usual. It was awesome to see things work in practice.
I left out some really cool information for the sake of brevity, so I’d highly recommend watching Mike’s talks or reading his article from the EAA Sport Aviation.
High performance time series maps with vector tiles
Jeff Frankl
Since March, I’ve worked on several map visualizations related to Covid-19. One common aspect of these maps is time-series data. Readers and decision-makers want to explore how data, such as case count or mobility, are changing over time. Many of these maps allow the user to change the date represented in the visualization by using a date picker or date slider.
The ideal date slider interaction feels seamless. There should be no detectable lag between user input and data updates. I wanted to find the best technique for creating a fast time series choropleth map using Mapbox GL JS and vector tiles that we could use across these kinds of projects in the future.

This example will show a map of cases at county level in the United States. I downloaded a Confirmed Cases CSV from USAFacts and a County Geometry shapefile from the United States Census Bureau. I used QGIS to join the Confirmed Cases with the County Geometry shapefile, Mapshaper to convert the shapefile to geojson, and Tippecanoe to convert the geojson to vector tiles.
Each county feature contained a property for each date, which looked something like:
"1/22/20": 0,
…
"5/15/20": 45,
"5/16/20": 48
"5/17/20": 50
Attempt 1
I had vector tiles loaded with case data. I used Mapbox GL JS’s setPaintProperty method to set a color scheme for the most recent date:
map.setPaintProperty("county-fill", "fill-color", [
    "step", ["get", "5/17/20"], "#f6eff7", 5, "#bdc9e1", 24, "#67a9cf", 114, "#02818a"
]);
This technique adds the correct colors to the map, but with a noticeable input lag. Mapbox GL JS updates features one tile at a time, which feels slow and reduces the ability to visually follow changes.
setPaintProperty method.Attempt 2
I had used Mapbox GL JS’s setFeatureState method in the past to make quick changes to the map for hover effects, and I wanted to investigate whether it would work well for changing data across several thousand features.
I stripped all properties from my vector tiles except for a FIPS code (unique ID representing a county). Instead of reading Confirmed Cases from the vector tiles, I imported the CSV directly into my application. I modified my Mapbox style expression from above to instead apply color based on the feature-state:
map.setPaintProperty("county-fill", "fill-color", [
    "step", ["feature-state", "value"], "#f6eff7", 5, "#bdc9e1", 24, "#67a9cf", 114, "#02818a"
]);
To change the data on the map, I needed to loop through each county and run the setFeatureState method for each one:
const updateMap = date => {
  caseData.forEach(county => {
    map.setFeatureState(
      {
        source: "composite",
        sourceLayer: "us_county_albersusa",
        // Set for the feature with the matching FIPS code
        id: county.countyFIPS
      },
      // Set feature state value to the cases count for the selected day
      { value: parseInt(county[date]) }
    );
  });
};
This technique successfully eliminates the input lag, resulting in a smooth map transition between dates.

setFeatureState method.You can view a live demo or check out code for the demo on GitHub.
Pushing type refinement to the database
Peter Caisse
We make extensive use of PostgreSQL (and the excellent PostGIS extension). PostgreSQL supports constraints that you’ll likely be familiar with such as PRIMARY KEY, NOT NULL, and UNIQUE. For example, say we have the following users table:
CREATE TABLE users (
 id uuid PRIMARY KEY,
 email_address text NOT NULL UNIQUE,
 name text NOT NULL
);
Names cannot be null, but they can be the empty string. What if we want to ensure that names are not empty? We can add a CHECK constraint to enforce this:
ALTER TABLE users
 ADD CONSTRAINT non_empty CHECK (name <> '');
PostgreSQL also allows us to abstract constraints into a reusable type called a DOMAIN. For example, the name constraint above could instead be enforced as a non_empty_text type:
CREATE DOMAIN non_empty_text AS text
CHECK(
  VALUE <> ''
);
For the email address, we can define a DOMAIN that requires email addresses conform to a given regex so we don’t accidentally insert strings that aren’t emails:
CREATE DOMAIN email AS text
CHECK(
  -- must start with a non-@ character, followed by an @ symbol, and then more non-@ characters
  VALUE ~ '^[^@]+@[^@]+$'
);
and use it like so:
ALTER TABLE users
 ALTER COLUMN email_address TYPE email;
Once defined, our domains are reusable across tables. Here we reuse the email domain for a new table:
CREATE TABLE emails (
email_address email NOT NULL
);
INSERT INTO emails VALUES ('hi@bye.com');
INSERT INTO emails VALUES ('hi'); -- error!
If you’d like to play around with these examples, check out this DB fiddle.