Attachment
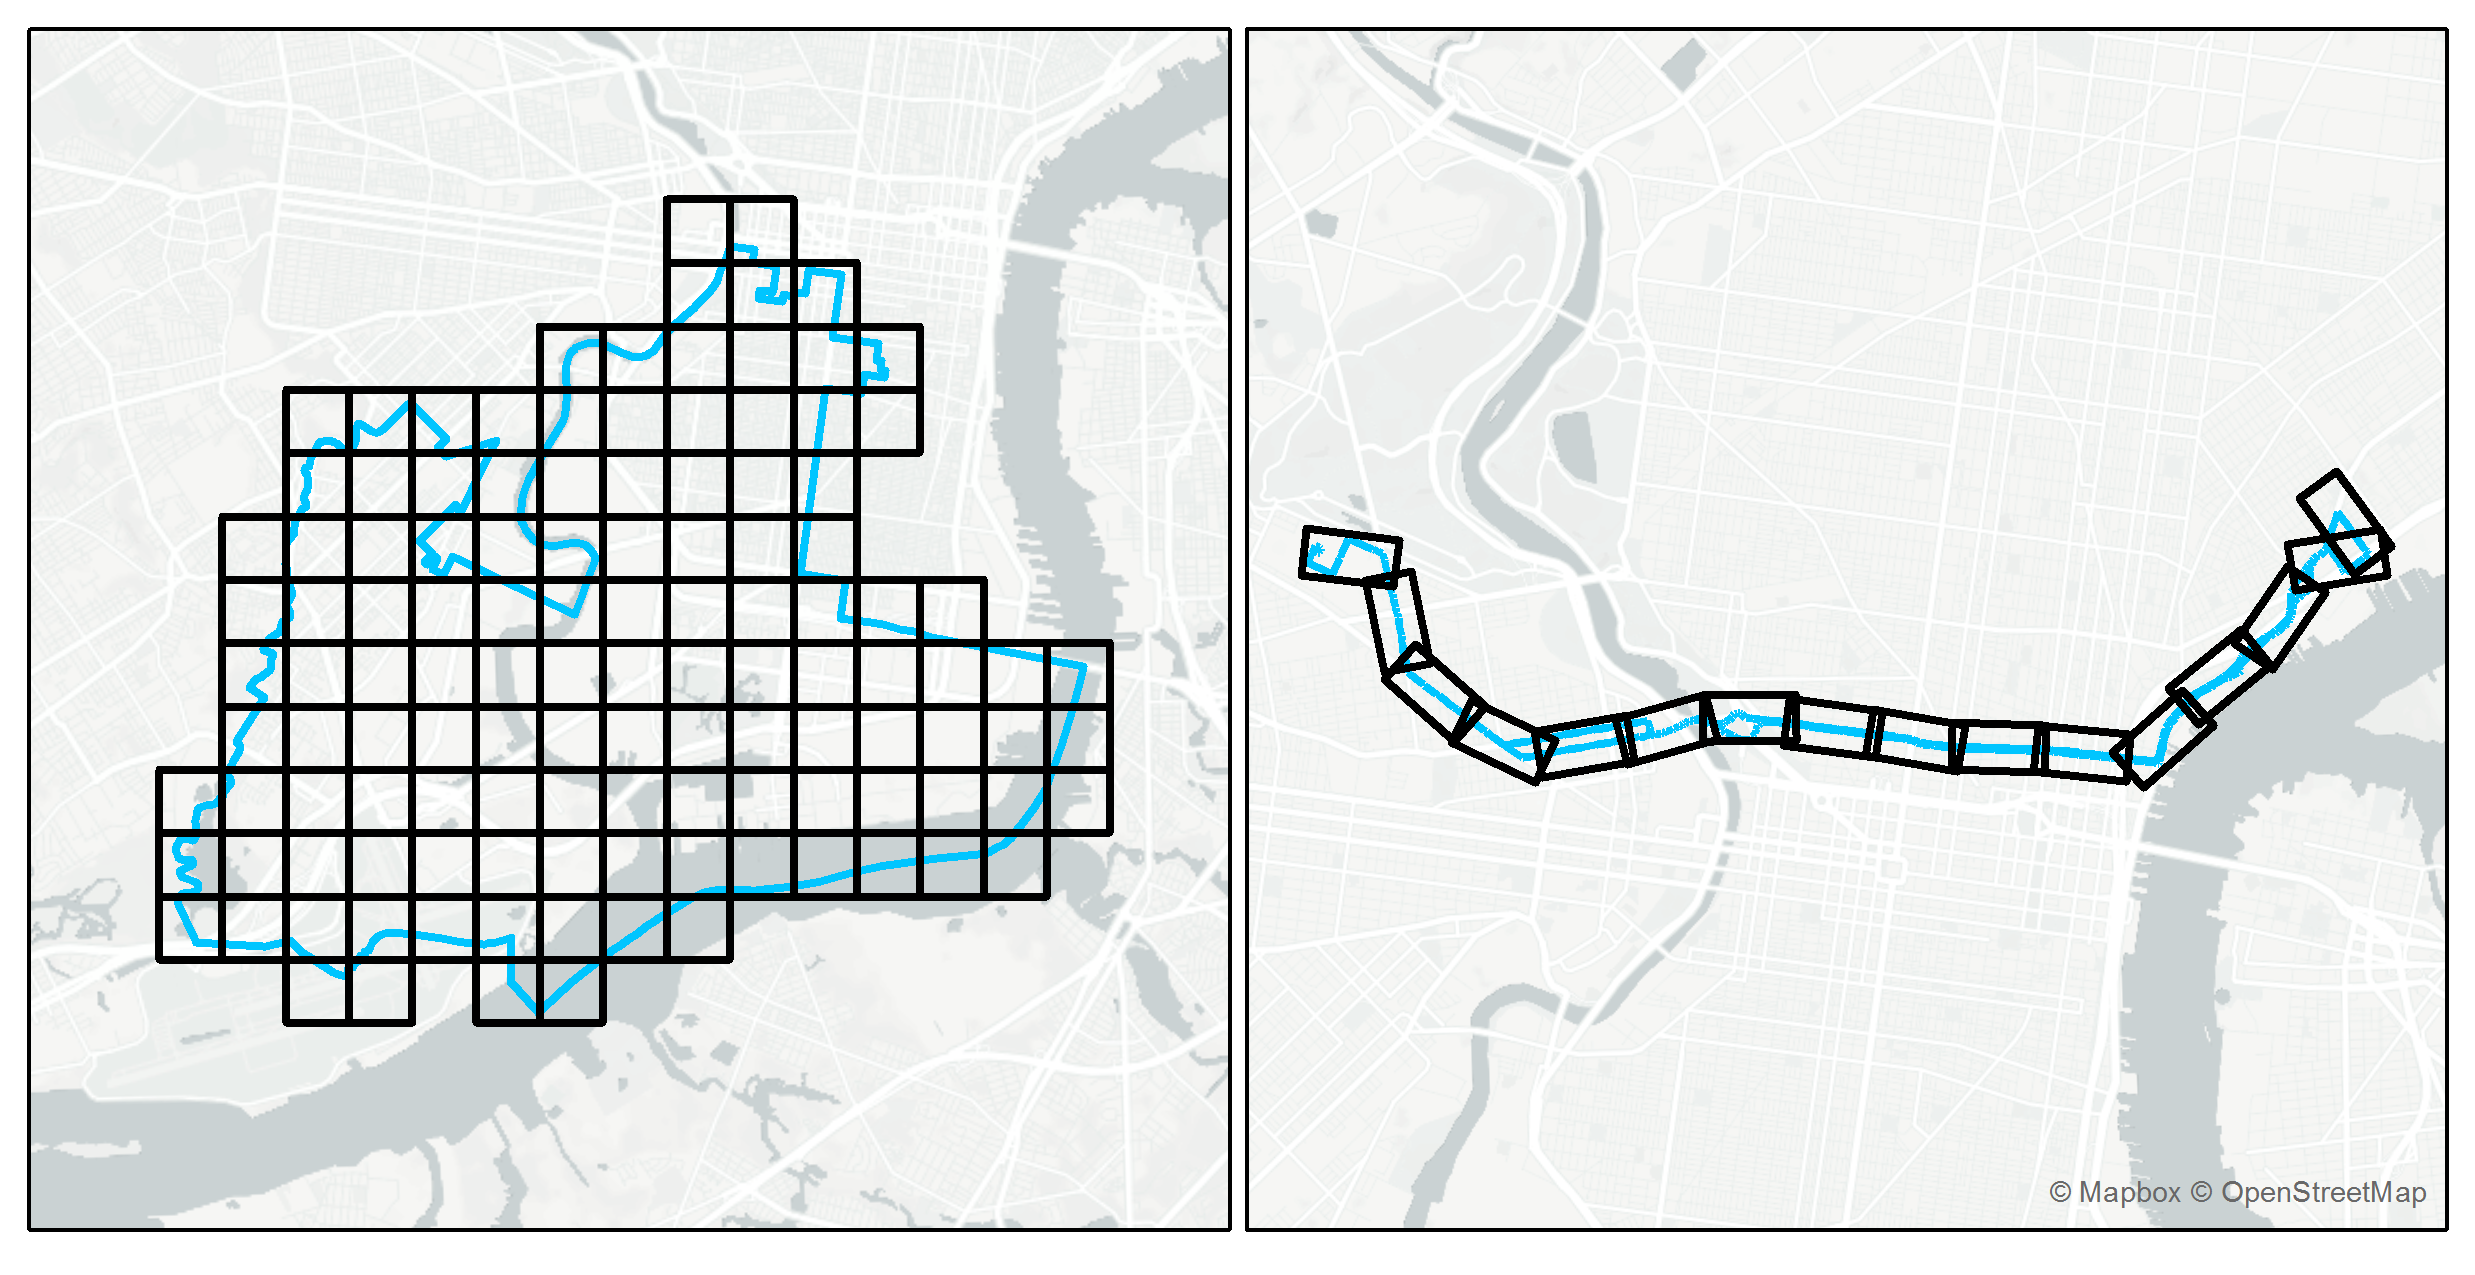
figure02-index-layer-output-examples
Published at 2475 × 1275 in Using ArcMap, R, and Adobe Illustrator to Create Data Driven Infographics
Attachment
Published at 2475 × 1275 in Using ArcMap, R, and Adobe Illustrator to Create Data Driven Infographics