
In December of 2017, Azavea supported a challenge to the Pennsylvania Congressional districts in U.S. Federal Court. The challenge in the case, Agre v Wolf, rests on the idea that partisan gerrymandering disenfranchised Democratic voters in Pennsylvania from being able to elect a representative of their choice. The plaintiffs cite the Elections clause of the U.S. Constitution, Article 1., Section 4., which states:
The Times, Places, and Manner of holding Elections for Senators and Representatives, shall be prescribed in each State by the Legislature thereof; but the Congress may at any time by Law make or alter such Regulations, except as to the Places of chusing Senators.
This clause gives state’s certain authority to choose when and how to hold elections. However, the plaintiffs argue it does not allow states to engage in partisan gerrymandering which, in essence, rig election outcomes. Unfortunately, the case was not successful in Federal Court. In a decision earlier this month, the Court ruled in a 2-1 decision in favor of the defendants, saying the issue is not justiciable under the Elections clause.
However, a similar case in the Pennsylvania Supreme Court just succeeded in overturning Pennsylvania’s notoriously gerrymandered districts. That case argues the plan violates the state constitution. In this article, I explore the gerrymandered nature of Pennsylvania’s soon-to-be-defunct Congressional districts. Much of the following is from the expert witness reports I prepared for the Agre case.
Gerrymandering of Pennsylvania’s current Congressional districts
In 2011, the Pennsylvania legislature apportioned the current boundaries of the 18 Congressional districts. In Pennsylvania, like most states, the legislature must pass a redistricting plan as an act of legislation. While there are requirements for state legislative districts to be compact and contiguous, Pennsylvania enforces no special stipulations for how Congressional districts are drawn. Therefore, the legislature has a lot of leeway into the outcome of the map. In the Agre case, the plaintiff’s asked Azavea to produce an expert witness report showing how the Pennsylvania Congressional districts were drawn as a partisan gerrymander.
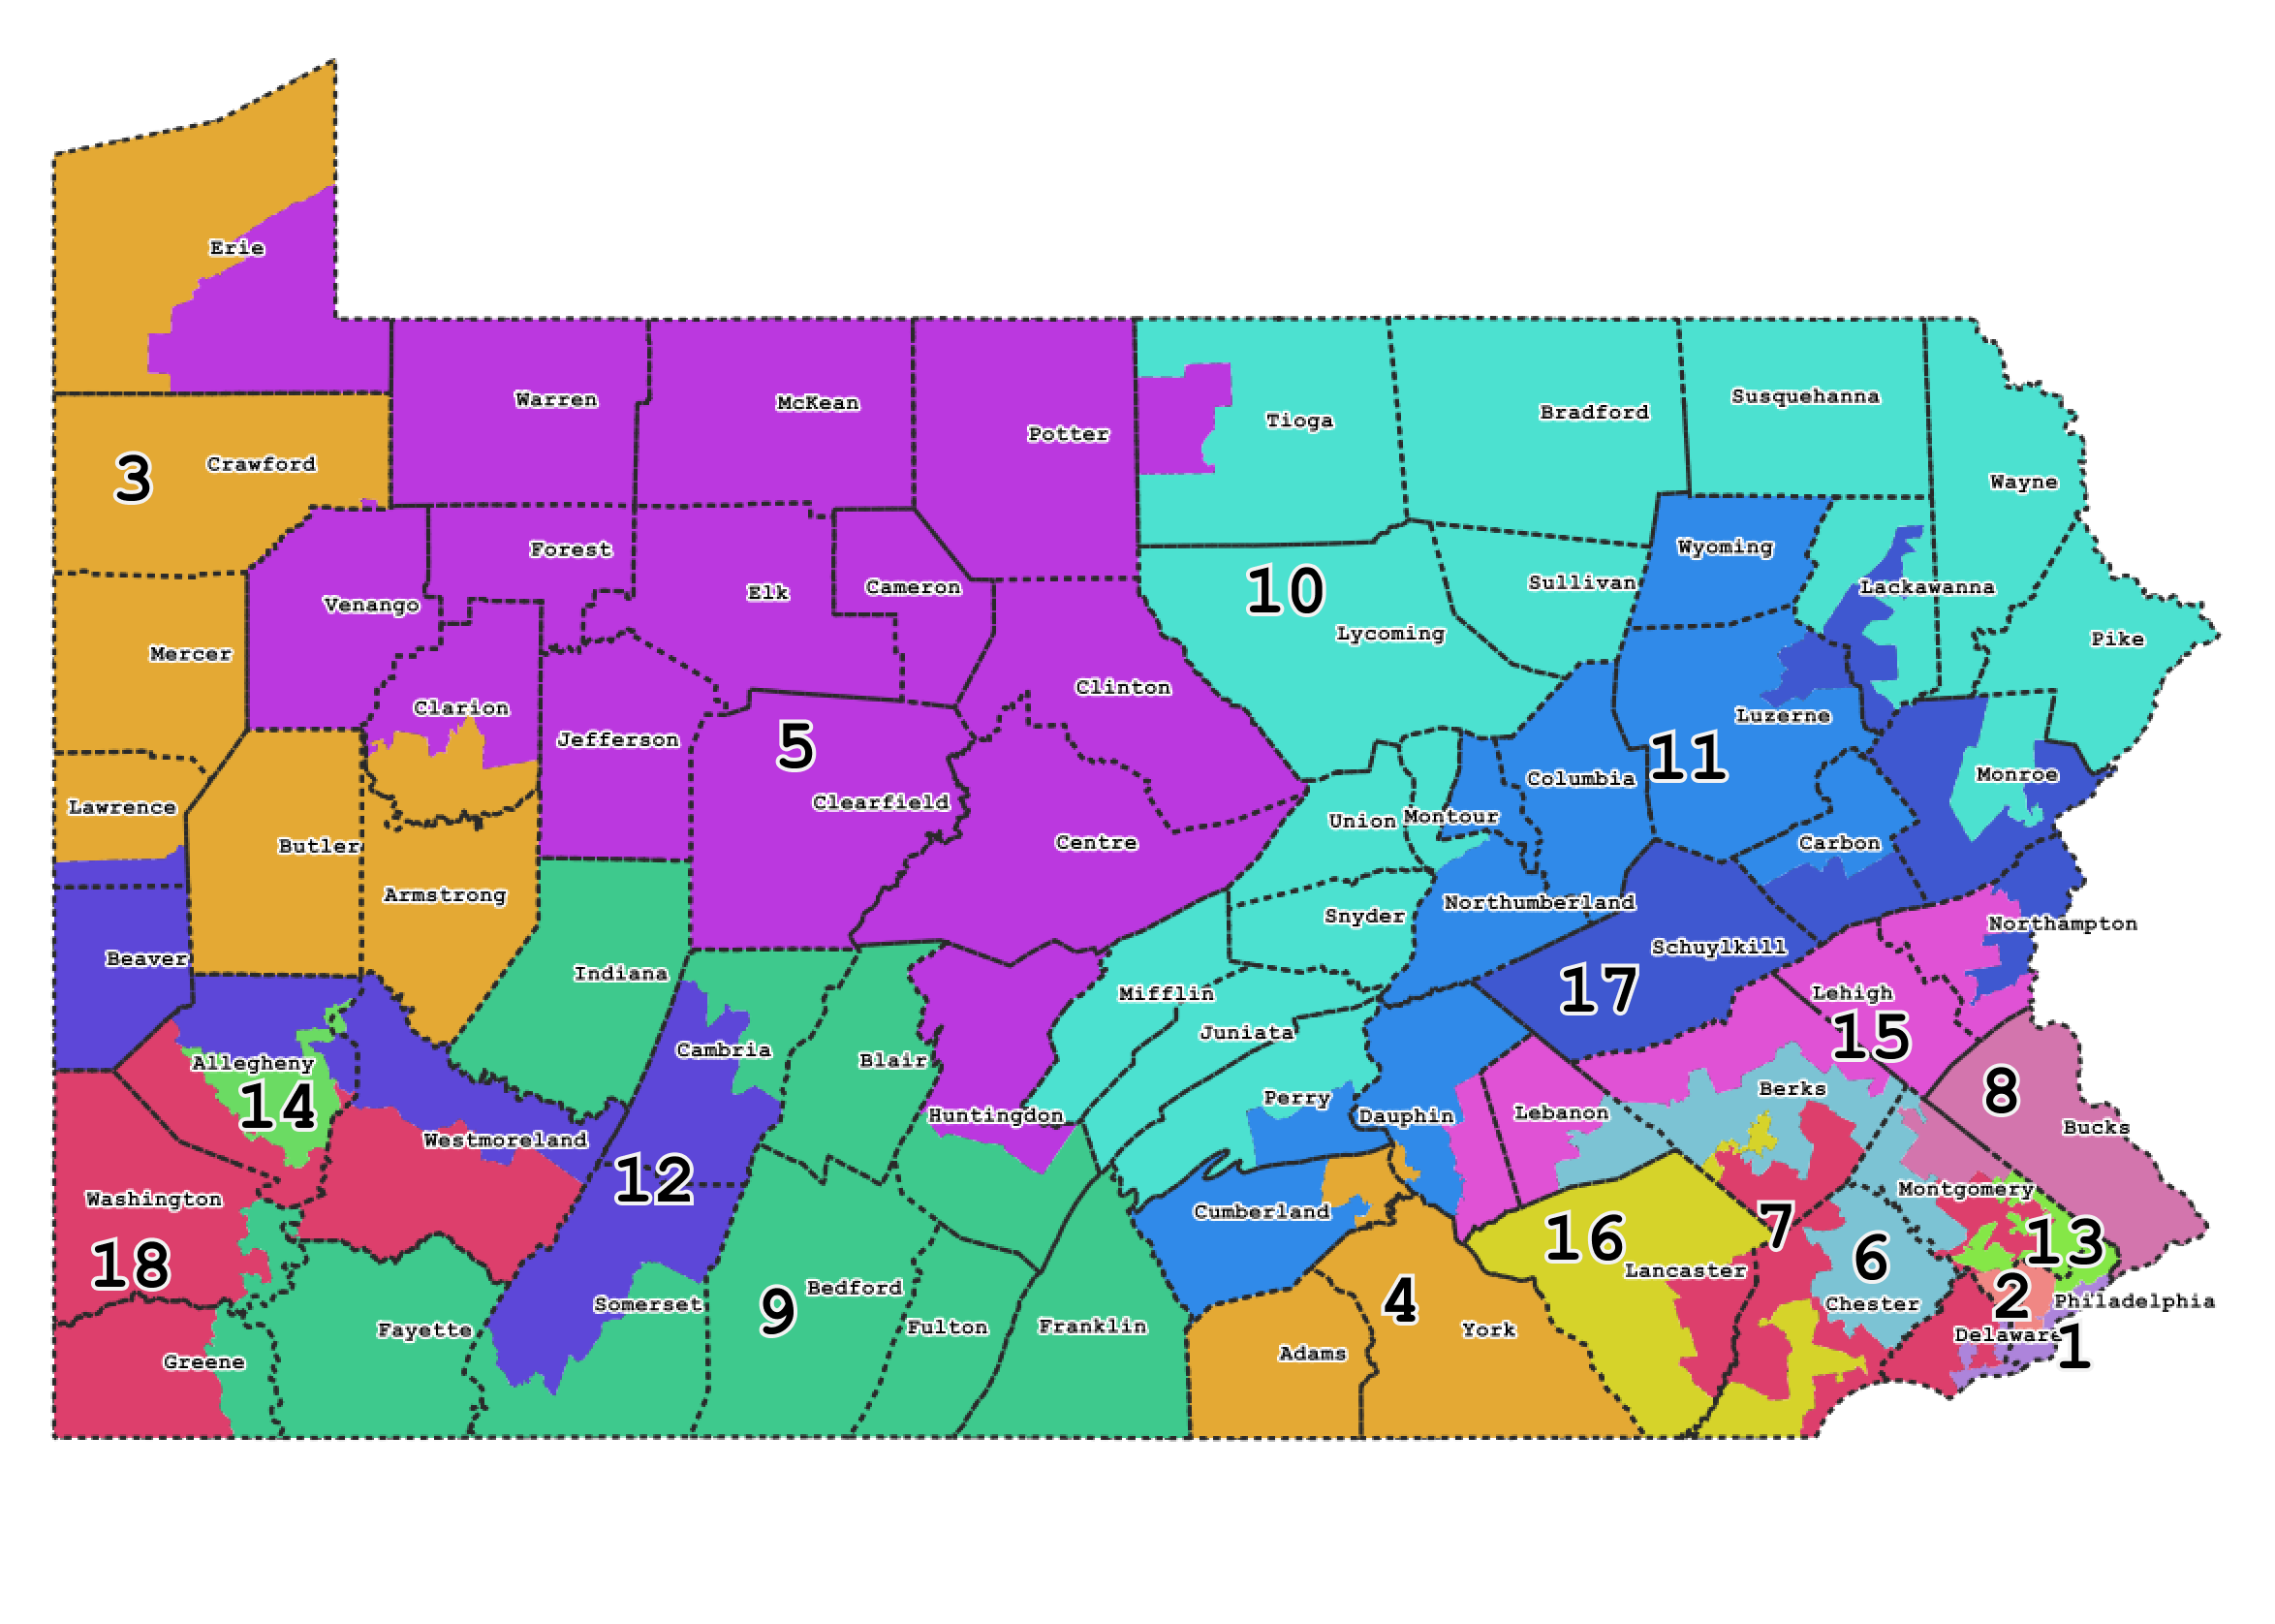 Pennsylvania Congressional Districts (2012-2018)
Through my analysis, it became clear that districts were drawn with an intent pack Democrats into “supermajority” districts in Philadelphia, Pittsburgh and the Scranton area and efficiently distribute Republicans among the remaining districts. In addition, the many smaller to medium sized cities which comprise parts of the state outside of the three aforementioned cities with higher concentrations of Democrats were efficiently and meticulously cracked. This was done in an effort to split any concentration of Democratic voters that could present a threat to the continued election of Republicans.
By and large, I note a westward shift from the previous plan in Congressional districts in southeastern Pennsylvania – with districts such as the 6th, 7th and 15th containing branches which pick up voters towards Central Pennsylvania. It’s hard to conclude that this is absolutely necessary considering the population growth during the past decade was centered on southeastern Pennsylvania, the Lehigh Valley and South Central Pennsylvania. It is clear the intent was to make the districts more Republican through very efficiently cracking and packing Democratic performing geographies.
Maps showing partisan performance at the voting precinct level clearly show the effort mapmakers took to purposely allocate voters into just the right proportions to produce a 13-5 Republican advantage in the Pennsylvania Congressional Delegation. You’ll find those maps below.
Note in the table below that with the large swing from voters towards Democrats in 2012, there was actually a gain in Republican seats, while Democrats lost two seats. Even with large partisan swings in subsequent years, the breakdown of Pennsylvania’s Congressional delegation sees no change after 2012.
| Year | 2010 | 2012 | 2014 | 2016 | ||||
| Party | GOP | Dem | GOP | Dem | GOP | Dem | GOP | Dem |
| Percent | 51.4% | 47.6% | 48.8% | 50.3% | 55.5% | 44.5% | 53.9% | 45.6% |
| Seats Won | 12 | 7 | 13 | 5 | 13 | 5 | 13 | 5 |
| Seat Change | +5 | -5 | +1 | -2 | – | – | – | – |
Source: Ballotpedia
Partisan vote share data
I used the Harvard Election Data Archive election results and partisan voting index for my charts below. This dataset provides election results for 2000-2010 along with “average” Democratic vote and Republican vote for each voting precinct. The average vote is simply the mean of all the votes for each party between 2004-2008 for all National and Statewide elections. This average encompasses two very strong years for Democratic performance, 2006 and 2008. It would be logical to assume this is exactly what partisan Republican mapmakers would want to model – what peak performance would look like for Democrats, so they could craft districts still Republican performing at that level. As it turns out, the Turzai production dataset – released a week after I submitted my first report – contained data just like that.
Turzai production data
Map of Turzai production voting precinct data. Click on a voting precinct to view some of the data fields from the legislature’s partisan data file. Scroll down for description below map.
Click here for a full-screen version of the map.
As a result of requests by the plaintiffs, we obtained the actual data that was used in production of the 2011 map. It became known as the Turzai production data, named after State Representative Mike Turzai. Turzai was House Majority Leader at the time the map was being drawn. The dataset encompasses a series of GIS shapefiles for Pennsylvania Counties, Municipalities, Voting Precincts, and Census Blocks. Each geographic unit shapefile contains fields for election results (total votes) for Democratic, Republican and Other for all state (House, Senate, Executive positions) and national elections (President, Senate, US House) for 2004-2010 in even-numbered years. The data files contain all these fields aggregated to the county, municipality, voting precinct and Census Block level. Census Blocks are the smallest statistical geographic unit and are bounded by visible (streets, railroads, etc.) or non-visible (property lines, city limits, etc.) lines. There are also fields for registered voters for each party (and Other) for Spring and Fall of each year.
A key point here is that all these partisan data fields have actually been disaggregated into Census Blocks. A special level of effort was taken to take this data – which is not available at the block level from any public source – to this level of precision.
A partisan “index” is also calculated for each geographic unit in the dataset, with the exception of Census Blocks. This index is available for both 2008 and 2004. While difficult to reverse engineer, it is clear this index is related to the total D and R vote fields for each election and registered voters totals. It appears to be some sort of weighted arithmetic mean of some or all of those fields for each election for the year. This method could be used to estimate the partisan performance, perhaps by weighting certain elections more important than others or accounting for turnout. I calculated various iterations of the mean of some and all of the elections to try to achieve the same value as the INDEX field in the dataset, but was unable to achieve the precise numbers. Without knowing the exact weights, it’s very difficult to get the same numbers. Nevertheless, I understand the INDEX field is very clearly the partisan performance data with the “secret sauce” being the weights they used to calculate the final value. The value in INDEX08, for voting precincts, ranges from -1,376 to 2,957. The numbers can be thought of as a difference between Republican and Democratic vote, which negative numbers indicating more Democratic votes than Republican. Positive numbers indicate more Republican votes than Democratic.
As a simple exercise to show there is a relationship between the INDEX08 field and the D and R vote and registered voters fields is an Ordinary Least Squares regression. Results show an Adjusted R-Squared of 0.999998, indicating there is clearly a relationship between the election data, voter registration data and the INDEX08 field.
The dataset also contains “diff” fields for major races, simply the difference between Republican and Democratic votes. These “diff” fields can be used to map or examine the difference between Republican and Democratic votes for some of the major races in the data.
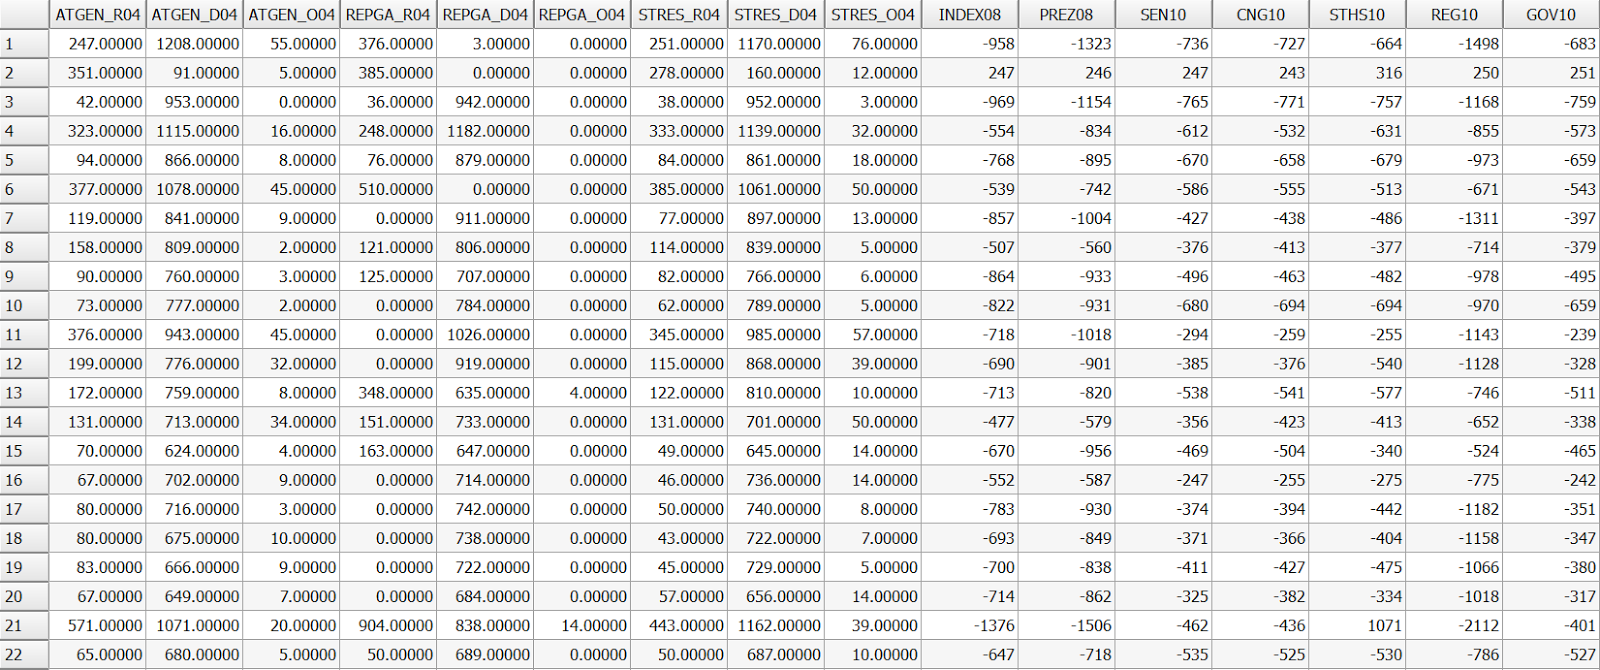
Turzai Production voting precinct shapefile attributes with partisan data
Sophisticated partisan preference data based on actual election results, averaged or indexed over time or for multiple elections, (such as the Harvard dataset and the Turzai production) can hint at how a geography (in this case, precincts) will perform in future elections. The combination of partisan performance data as well as an incumbency effect, which has been noted to have a strong influence on elections, would have been known when the districts were being drawn. I would point out that though the Harvard average vote share data presented in the previous report is only based on elections from 2004-2008, with data from 2006 and 2008 (both years with strong Democratic performance turnout) present, this would actually represent near “peak” performance for Democrats. It would be logical to assume this is exactly what partisan Republican mapmakers would want to model – what peak performance would look like for Democrats, thus to craft districts still Republican performing at that level.
Key Terms: Packing and Cracking
Packing and cracking are common methods of gerrymandering, used to minimize the impact of a voting bloc. These methods are frequently used in conjunction with each other.
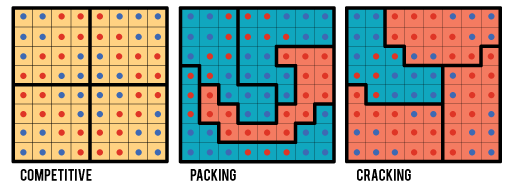
Packing concentrates members of a group in a single district, thereby allowing the other party to win the remainder of the districts because the members of the packed group have less influence in the rest of the districts. In Pennsylvania, where Republicans are a minority in registered voters and average vote share, they effectively used packing to group high concentrations of Democratic voters into five Democratic districts. By “forfeiting” those districts as guaranteed Democratic wins, the Republicans were able to achieve 13 districts with a Republican advantage by carefully cracking the remaining Democratic concentrations across the state.
Cracking splits a bloc among multiple districts, so as to dilute their impact and to prevent them from forming a majority. As mentioned above, cracking was used by Republican line-drawers to split the Democratic concentrations across the state outside the five Democratic districts to dilute their vote in the 13 remaining districts. In four out of the five Democratic districts, Democrats won by a larger margin than any Republican in the last election.
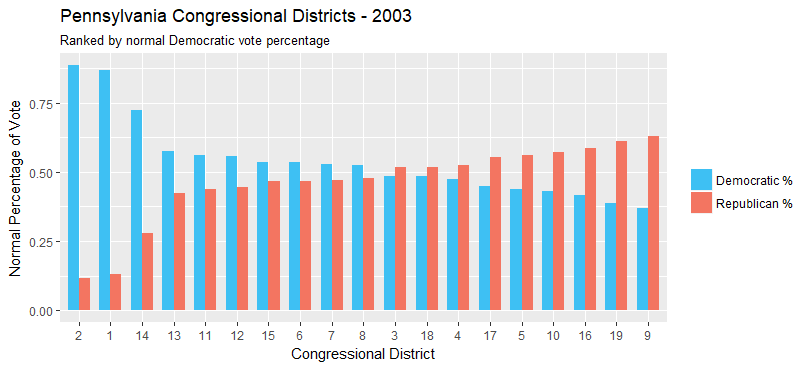
Packing and cracking were very effectively used to create the districts. In the chart below, using the Harvard Election Dataset, I show the Democratic and Republican partisan vote share by Congressional district. Note the four super majority Democratic districts on the far left, with a huge share of Democratic voters, while there are 12 districts with a majority Republican partisan vote share. But it’s notable that many of the Republican districts are only marginally so – this shows the efficiency of the Republican gerrymander.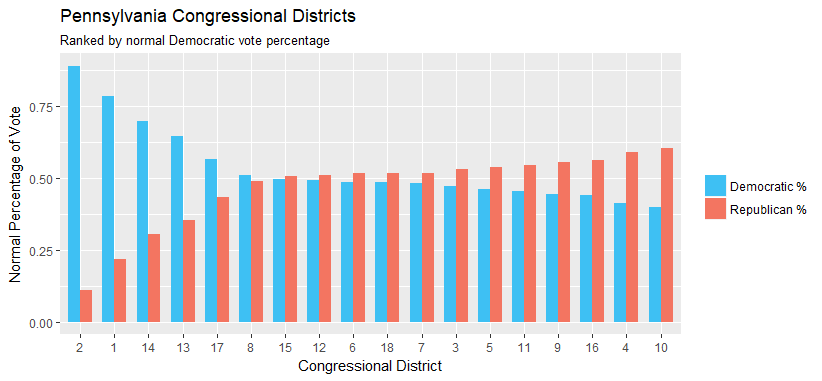
Harvard Election Data Partisan Vote Share by Congressional District
The next chart shows the same election data vote share but using the 2004 Congressional district boundaries. Note that the districts on the far left (1st, 2nd, 14th) still seem to be packed – but note how many more districts seem to have a small Democratic edge, much more in line with the statewide vote share.
Harvard Election Data Partisan Vote Share by 2004 Congressional District
Furthermore, I find that some districts in Pennsylvania follow a strategy of Optimal Gerrymandering, referenced in a paper by Friedman and Holden (2008). They observe that “The optimal strategy creates districts by matching increasingly extreme blocks of voters from opposite tails of the signal distribution. Intuitively, extreme Democrats can be best neutralized by matching them with a slightly larger mass of extreme Republicans.” To put into context with Pennsylvania, mapmakers efficiently packed Democrats into a few districts to minimize their effect on the overall plan, and neutralized the remaining Democrats by placing other heavily-Democratic concentrations (Reading, Harrisburg, Lancaster, West Chester, Allentown, Erie) into districts with slightly more Republicans. This, in effect, preserved Philadelphia’s suburban districts (6th, 7th, 15th) as Republican dominated districts.
Exploring some of Pennsylvania’s most gerrymandered districts
In this next section, I describe packing and cracking techniques used in several of Pennsylvania’s Congressional districts. Maps are of voting precincts with County and Municipal outlines. Voting precincts are shaded red to blue (Republican = red, Democratic = blue) using the INDEX08 field in the Turzai dataset.
1st Congressional District
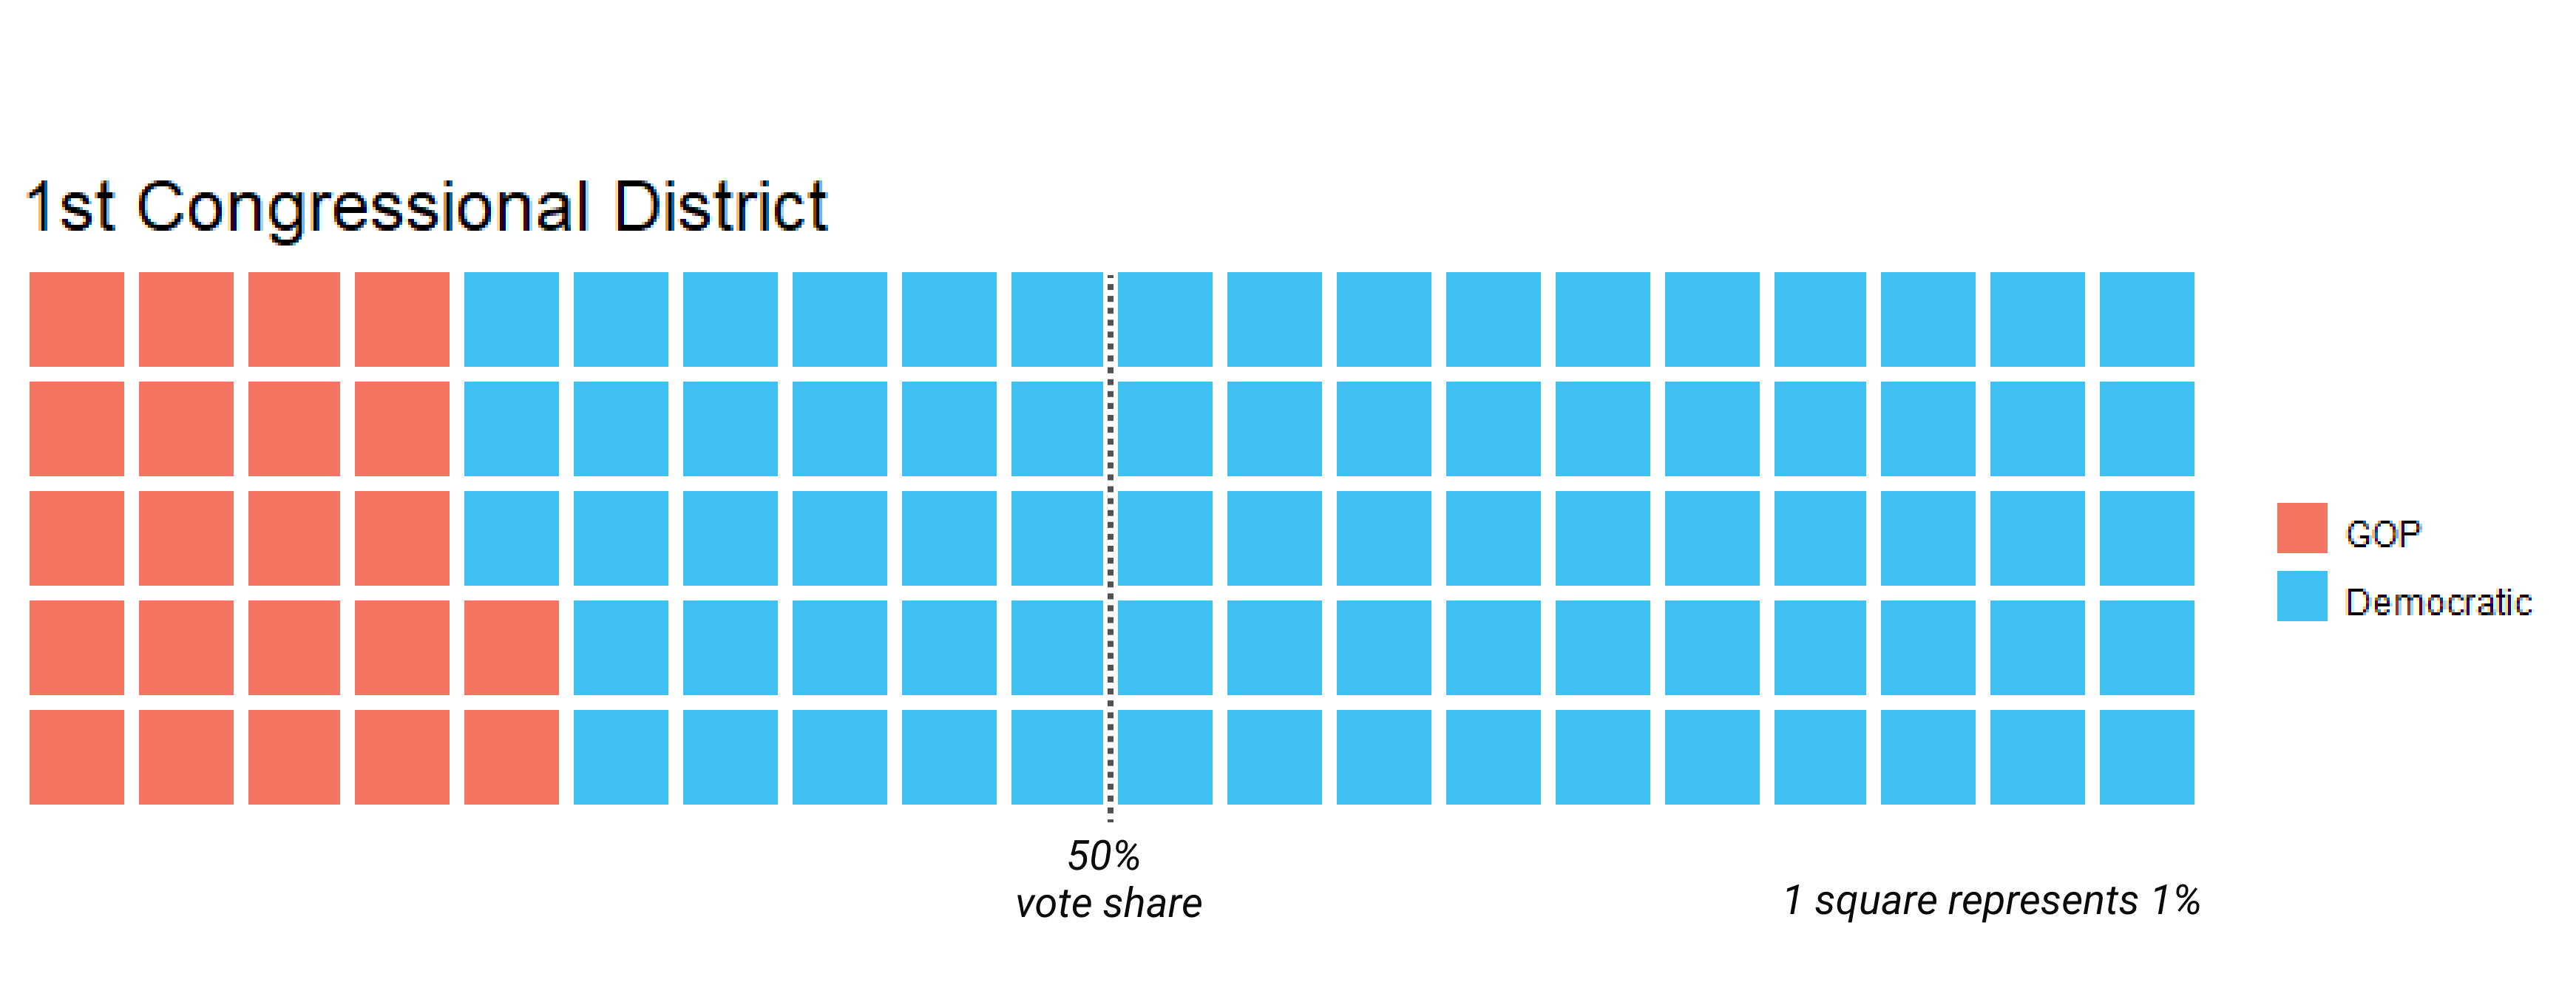
1st Congressional District Partisan Vote Share
The 1st Congressional District is drawn as a packed Democratic district snaking along the Delaware River from Northeast Philadelphia’s immigrant enclaves, through the blue-collar and gentrifying River wards of Northern Liberties and South Philadelphia, down through Delaware County and the City of Chester.
The map below demonstrates the 1st District’s packing techniques by evidence of the districts westward appendage from the highly Democratic City of Chester, in which it grabs the borough of Swarthmore. Note the district is drawn to include the more Democratic performing borough while excluding nearby more Republican performing areas. Note that the only Republican precincts are in Tinicum township and locked against the state boundary inaccessible from the 7th.
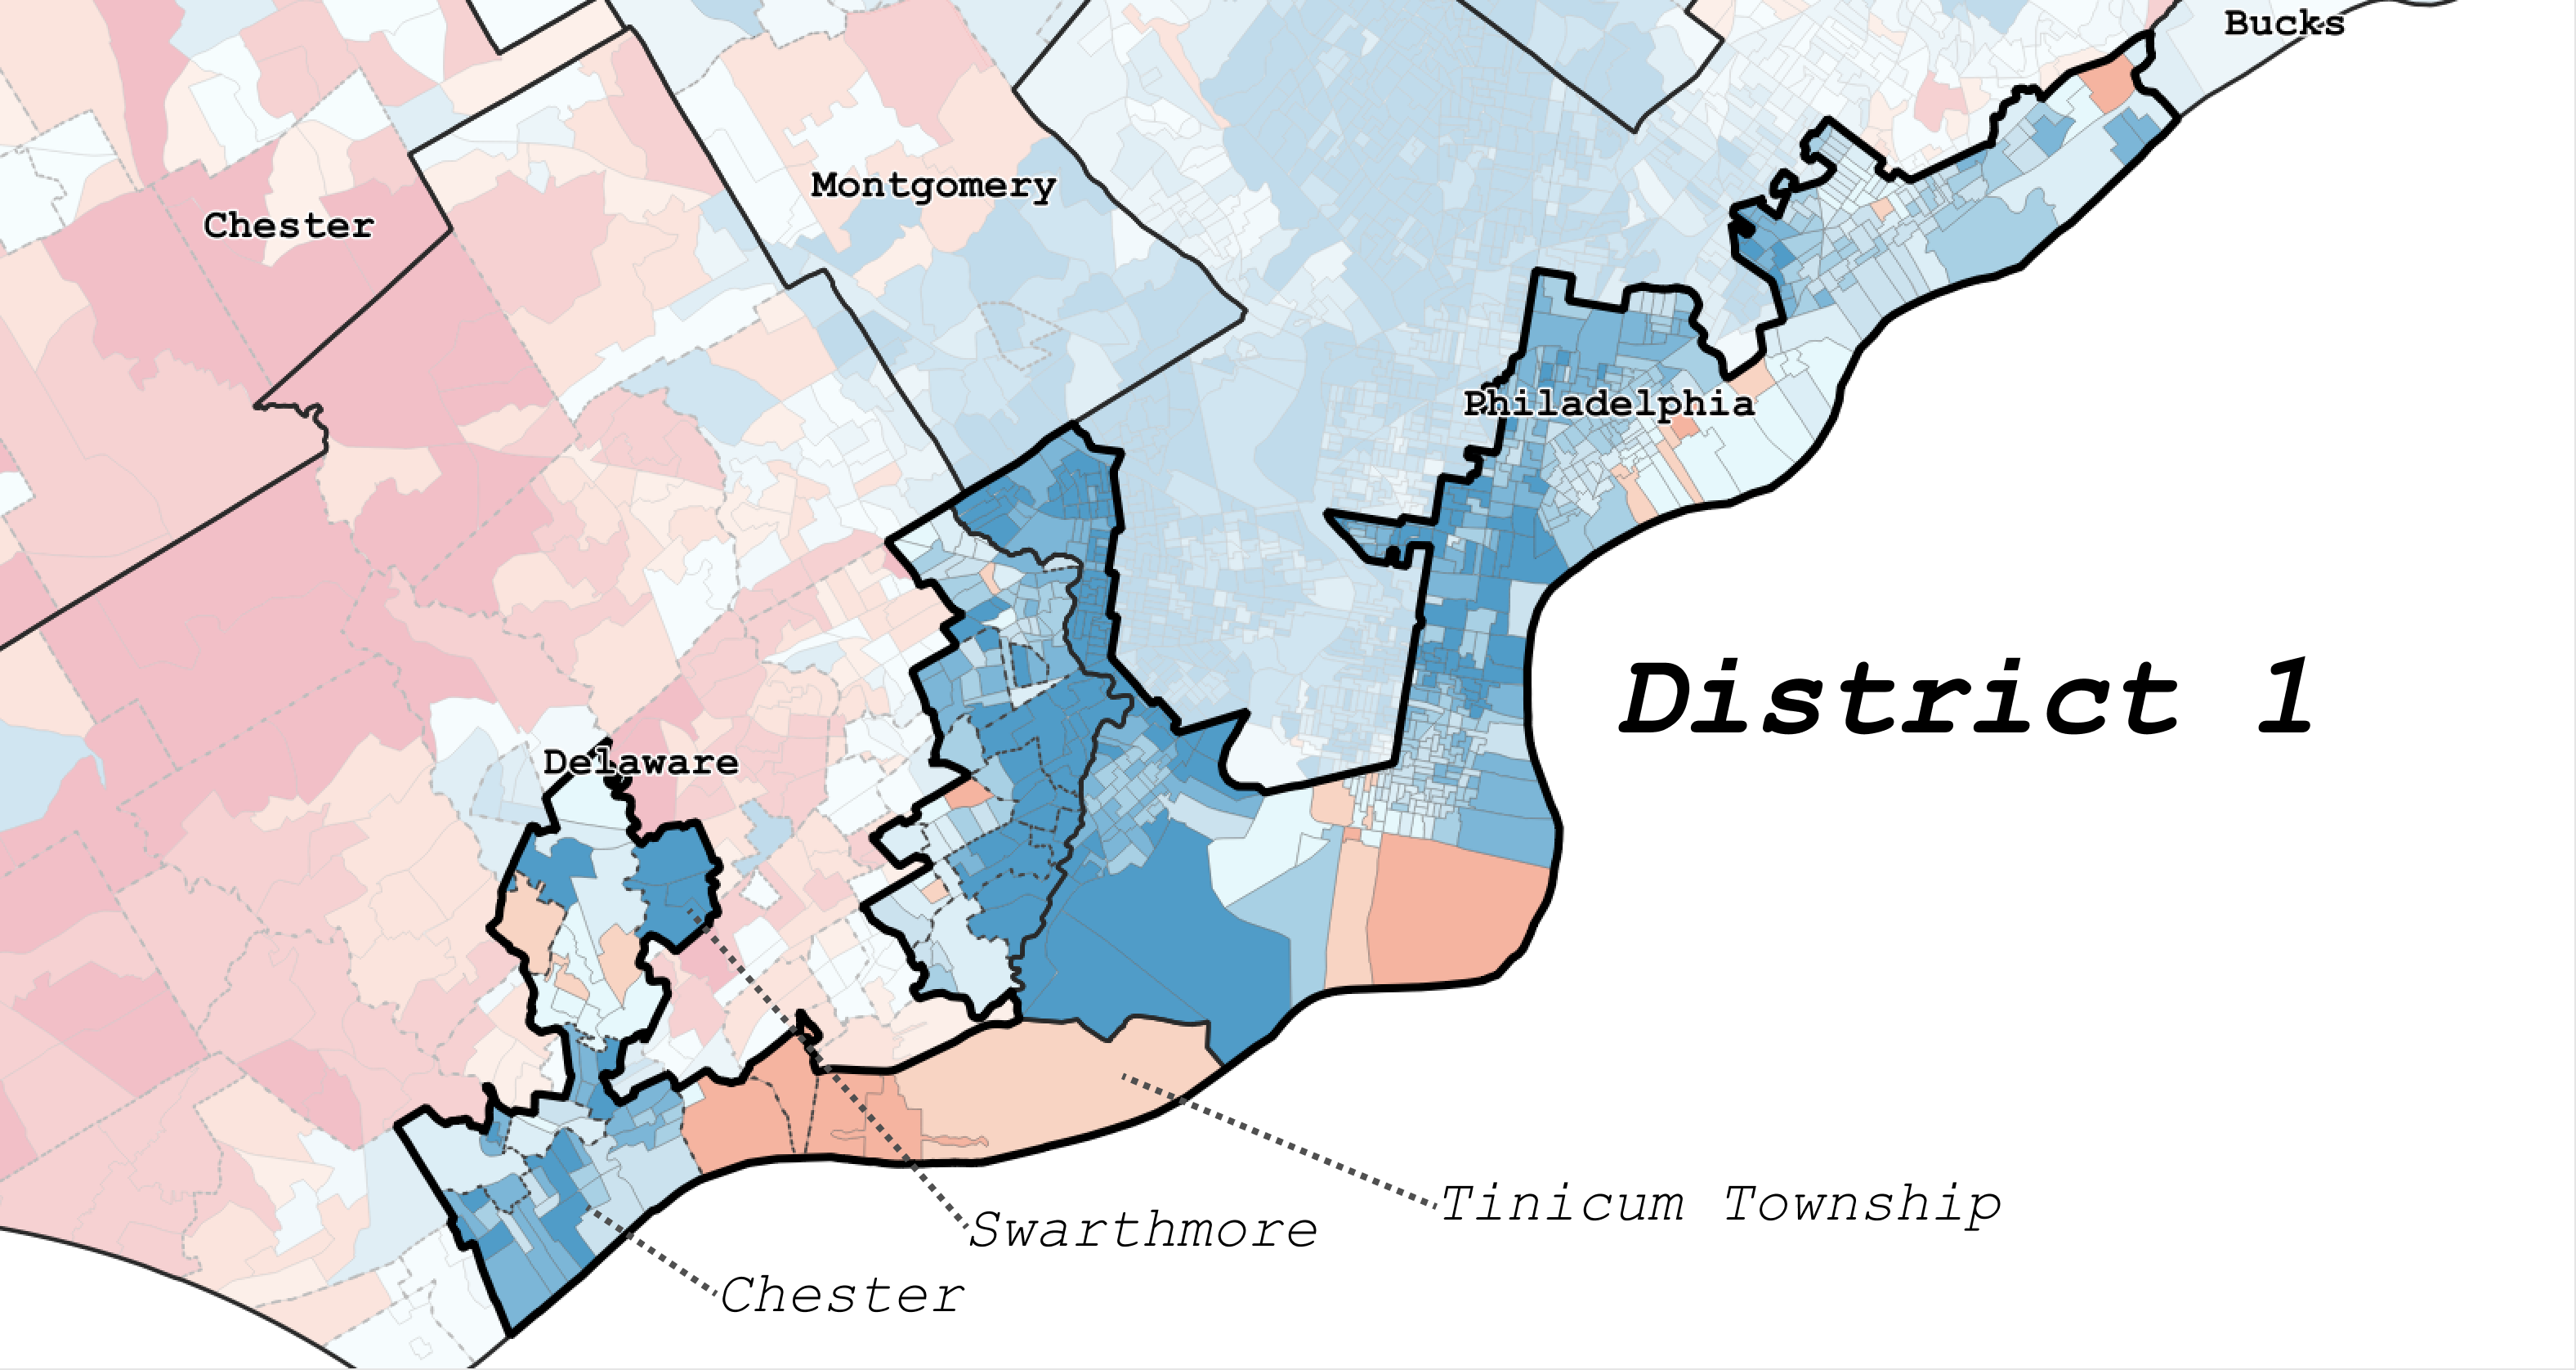
1st Congressional District
In one of the defendant’s expert witness reports, the author takes issue that I interpret Swarthmore as being “packed” into the 1st District. This presents a false equivalence as if the only other option is to split Swarthmore between multiple districts. The problem is placing Swarthmore into the 1st District – it seems to have less in common with Chester, South Philadelphia, Port Richmond or any number of communities in the 1st District than simply the rest of Delaware County. The fact that an appendage extends out from the bulk of 1st District to pick up Swarthmore is indeed an example of packing – the addition of 3,622 registered Democrats into the 7th would have been problematic for maintaining the 7th’s Republican advantage. Putting those voters in the 1st District merely pads the already supermajority status of the 1st District.
3rd Congressional District
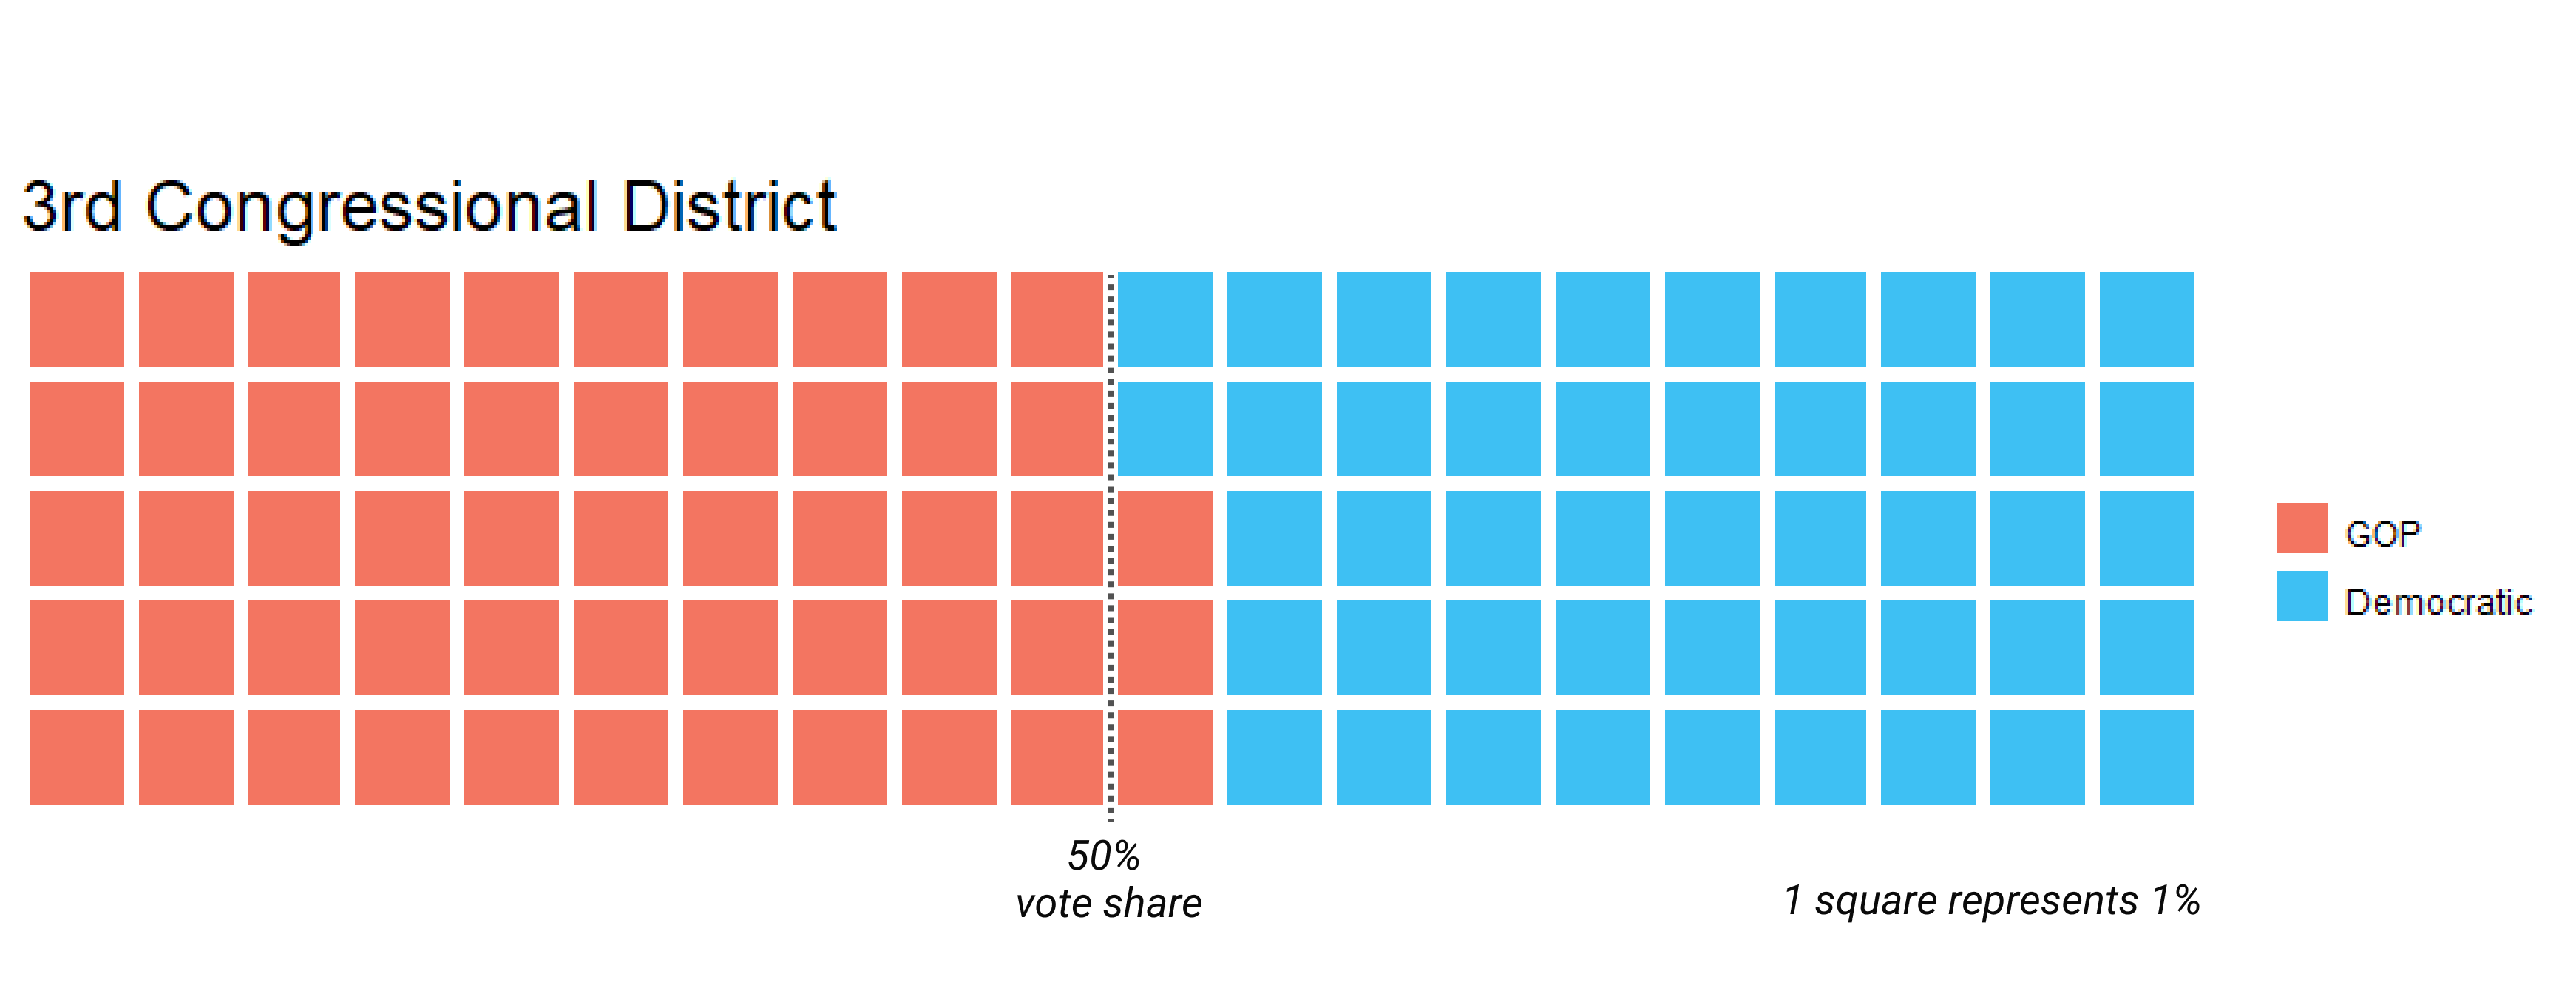
3rd Congressional District Partisan Vote Share
The 3rd district stretches from the City of Erie in the state’s northwest corner, along the border of Ohio, to Pittsburgh’s northern suburbs. Note that the third district cuts off Erie from its immediate suburbs and negates the vote of the Democratic centers in Mercer County with the heavily Republican northern Pittsburgh suburbs. Erie County was never split in a previous plan. In fact, a previous Representative of District 4 was Kathy Dahlkemper, former Erie County Executive. It’s probable that Republicans split Erie County with the intention of making it less likely to elect someone like Dahlkemper or another Democrat from the county.
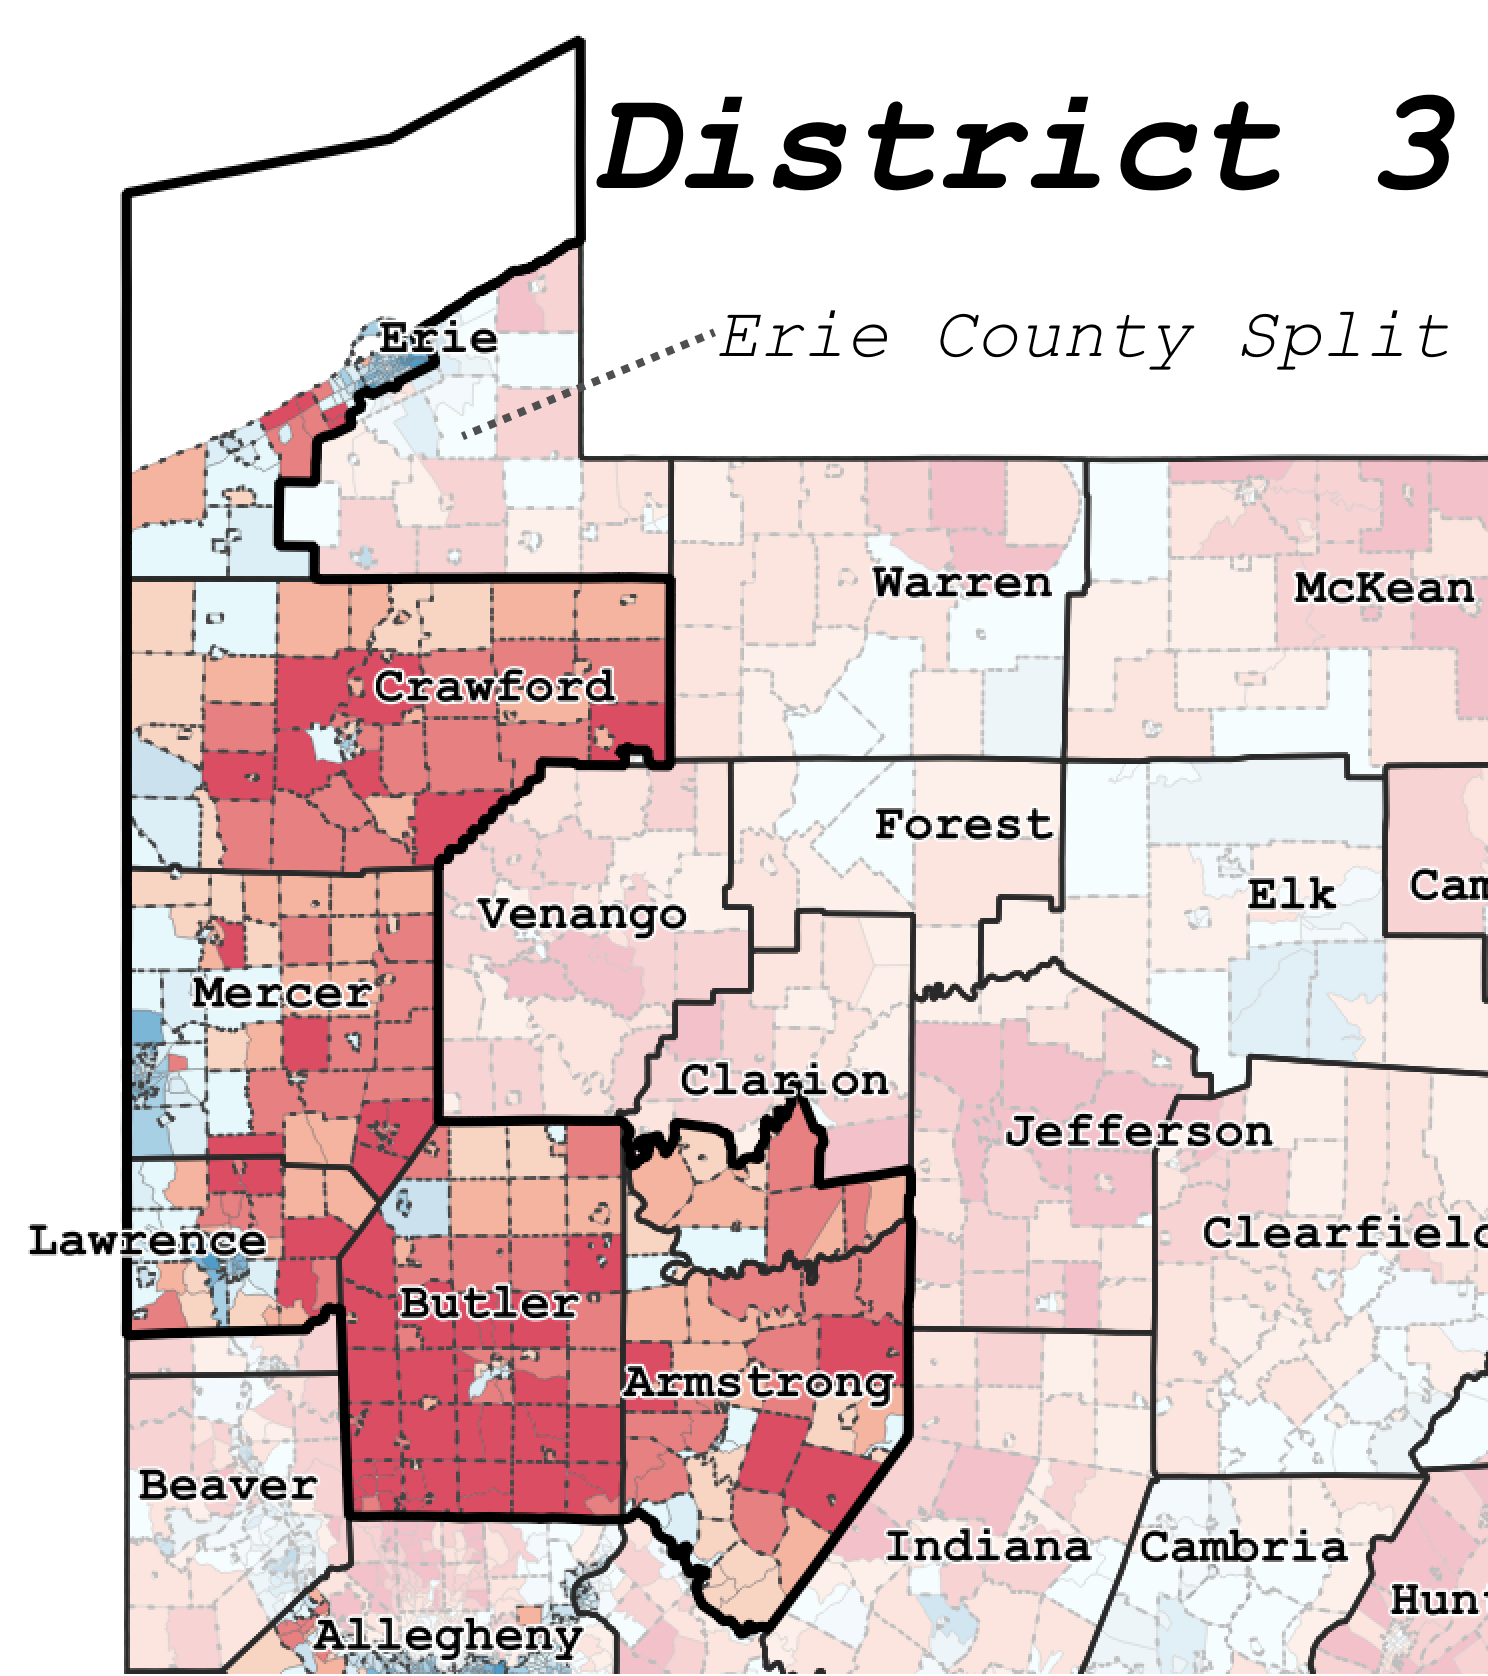
3rd Congressional District
4th Congressional District
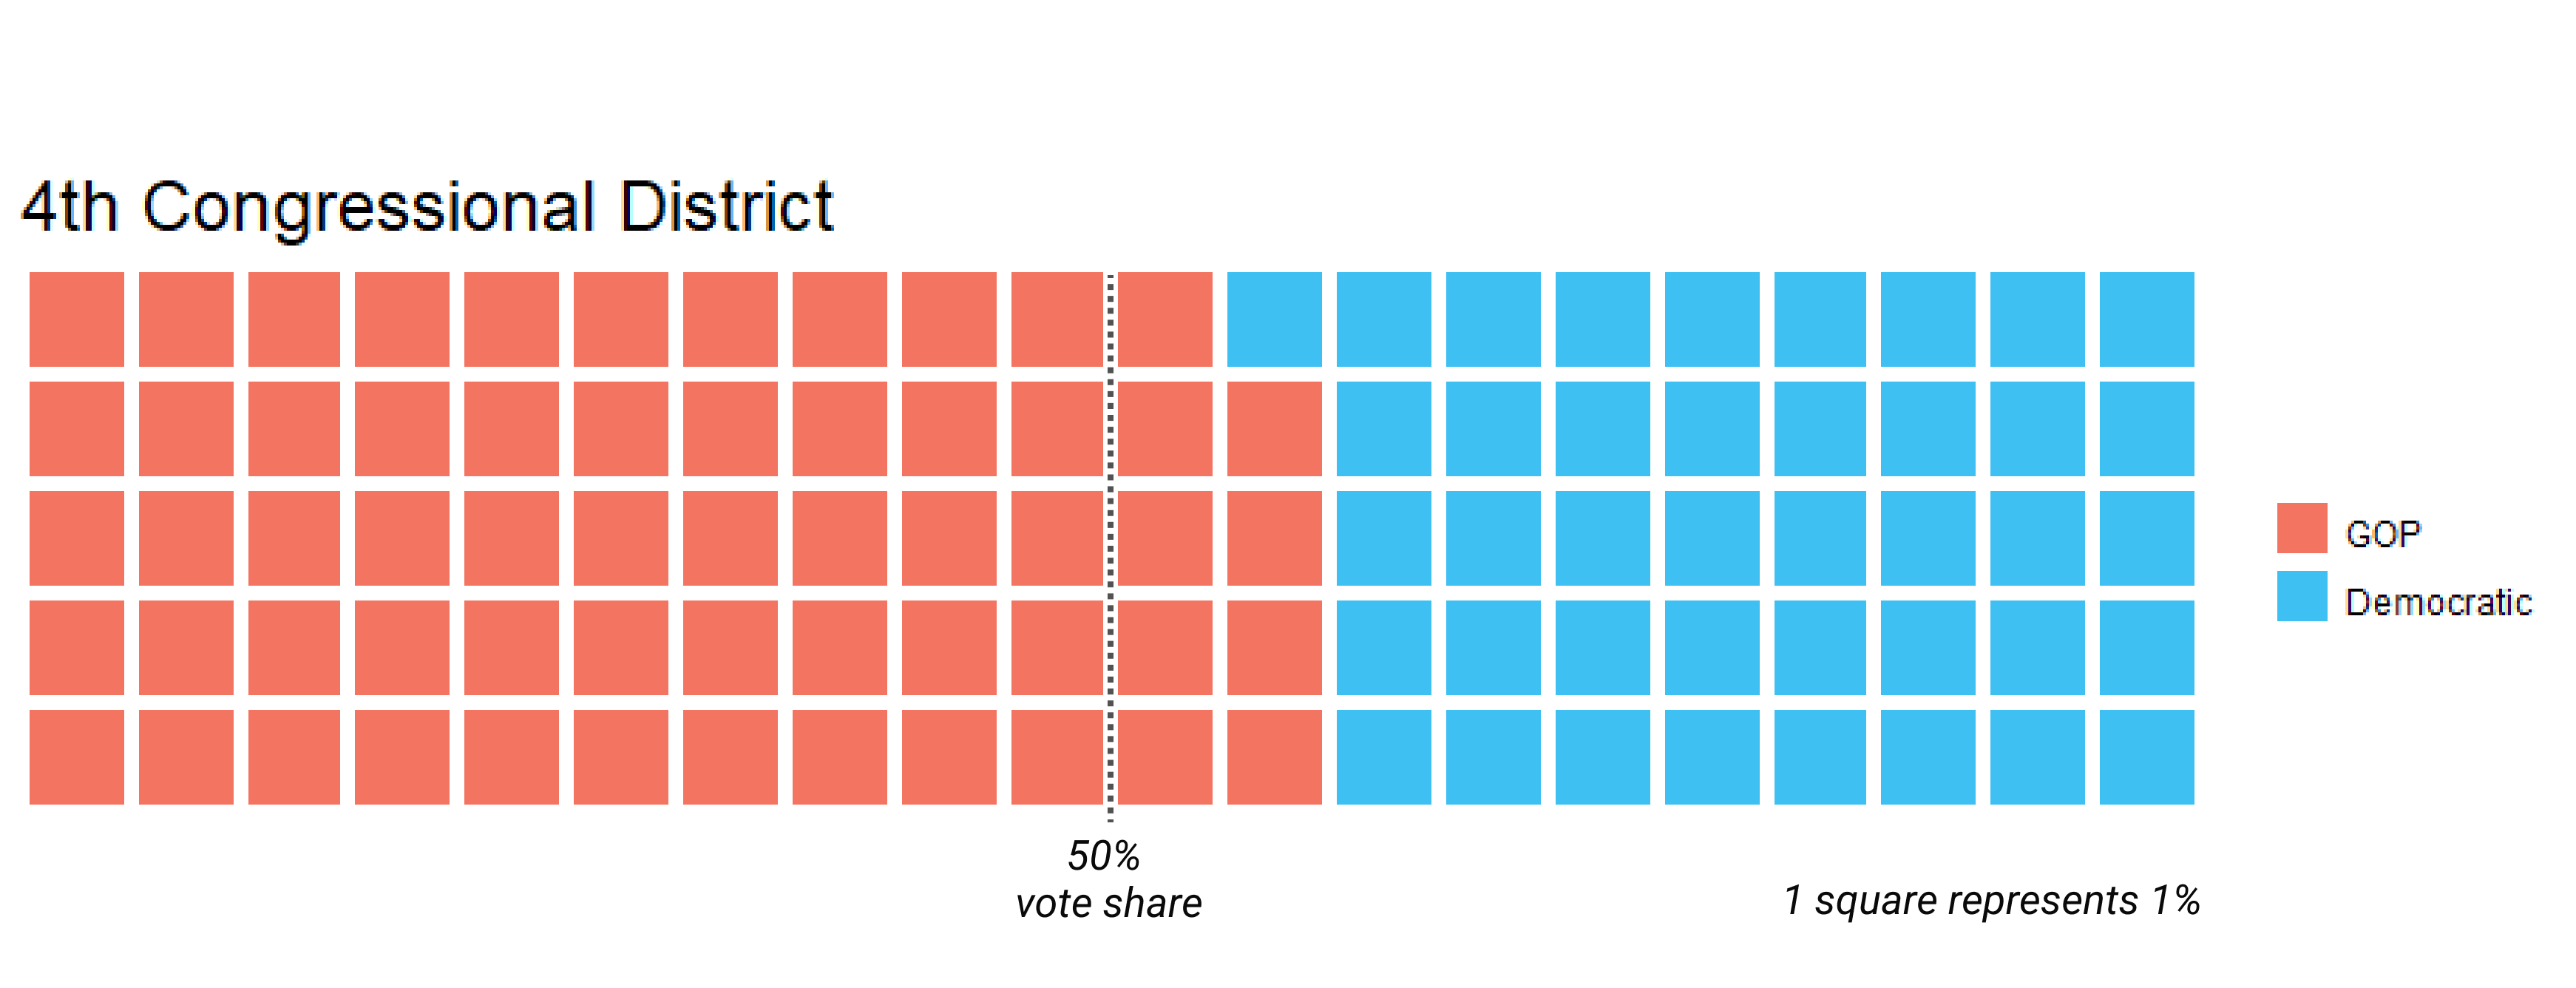
4th Congressional District Partisan Vote Share
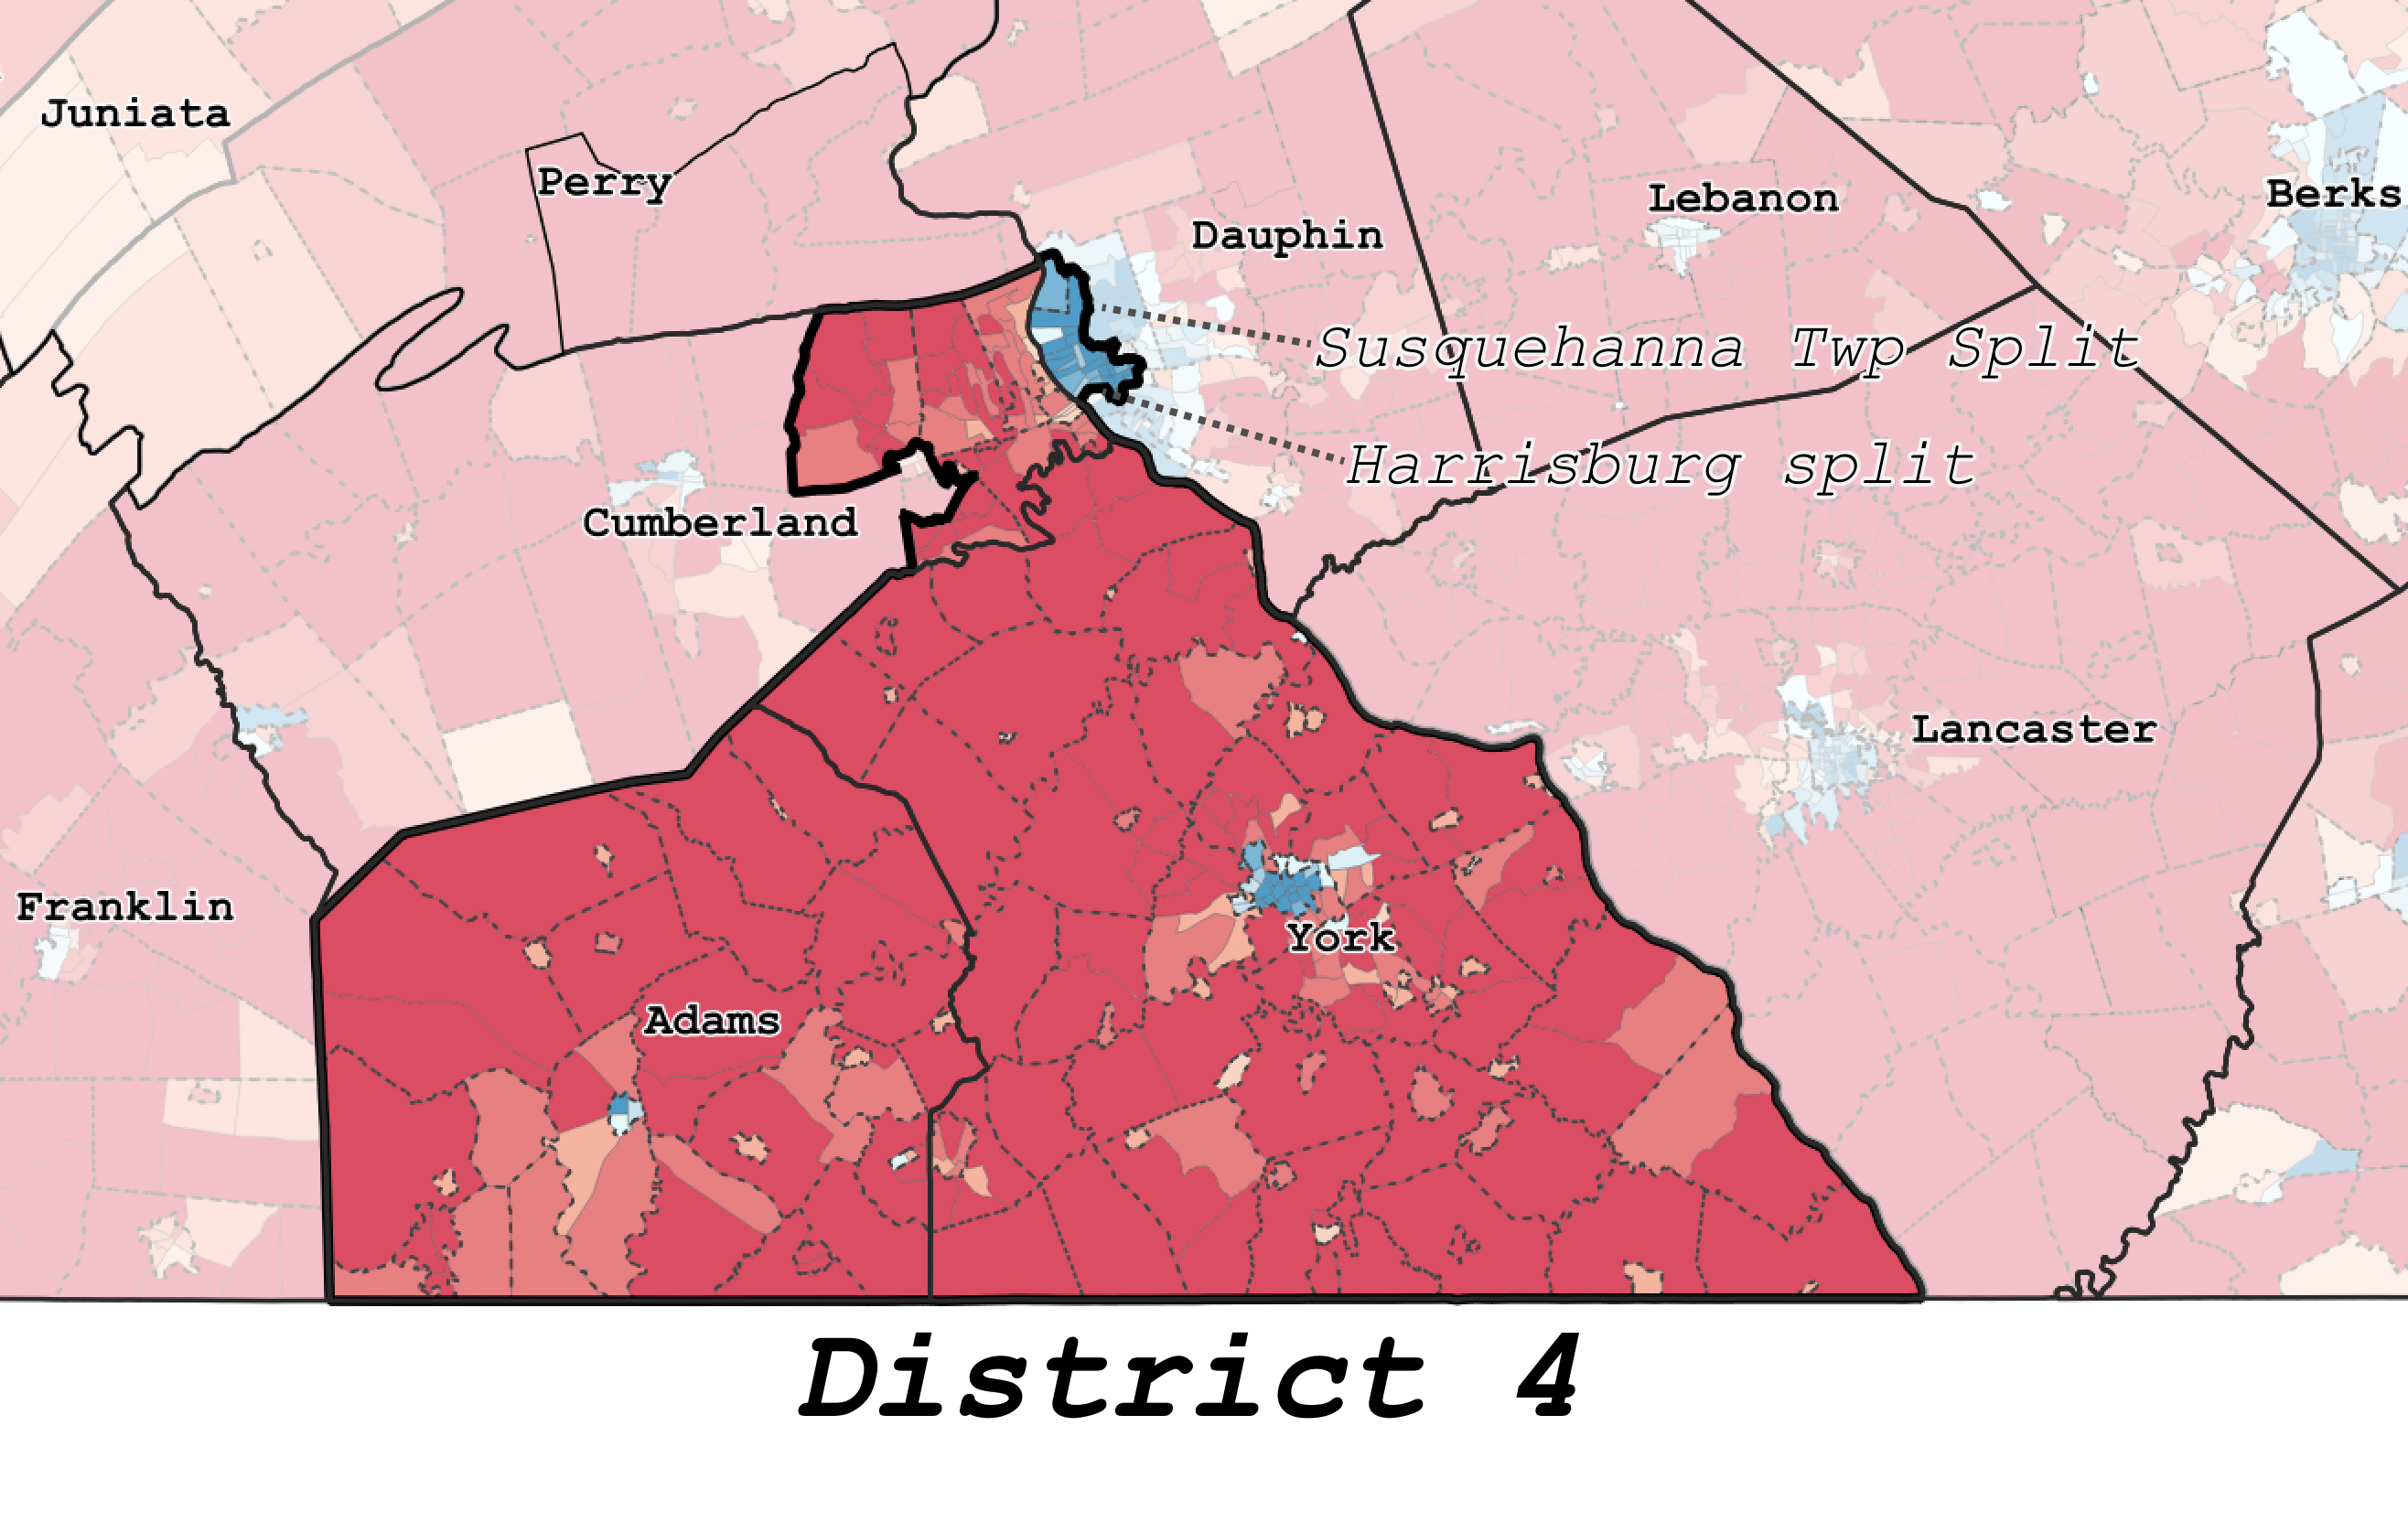 4th Congressional District
The 4th Congressional district in the South Central part of the state deliberately splits Harrisburg from its immediate suburbs, cracking the metropolitan area into five separate congressional districts (4th, 6th, 10th, 11th, 15th). The population of the Harrisburg-York combined statistical area (as defined by the U.S. Census Bureau in 2010) is only 1,219,422, which would necessitate the need for only two Congressional districts at most. By splitting the immediate Harrisburg area into three districts, while keeping the most heavily Democratic area within the city limits in the heavily Republican 4th district, the 11th District is kept from picking up tens of thousands more Democratic voters.
6th Congressional District
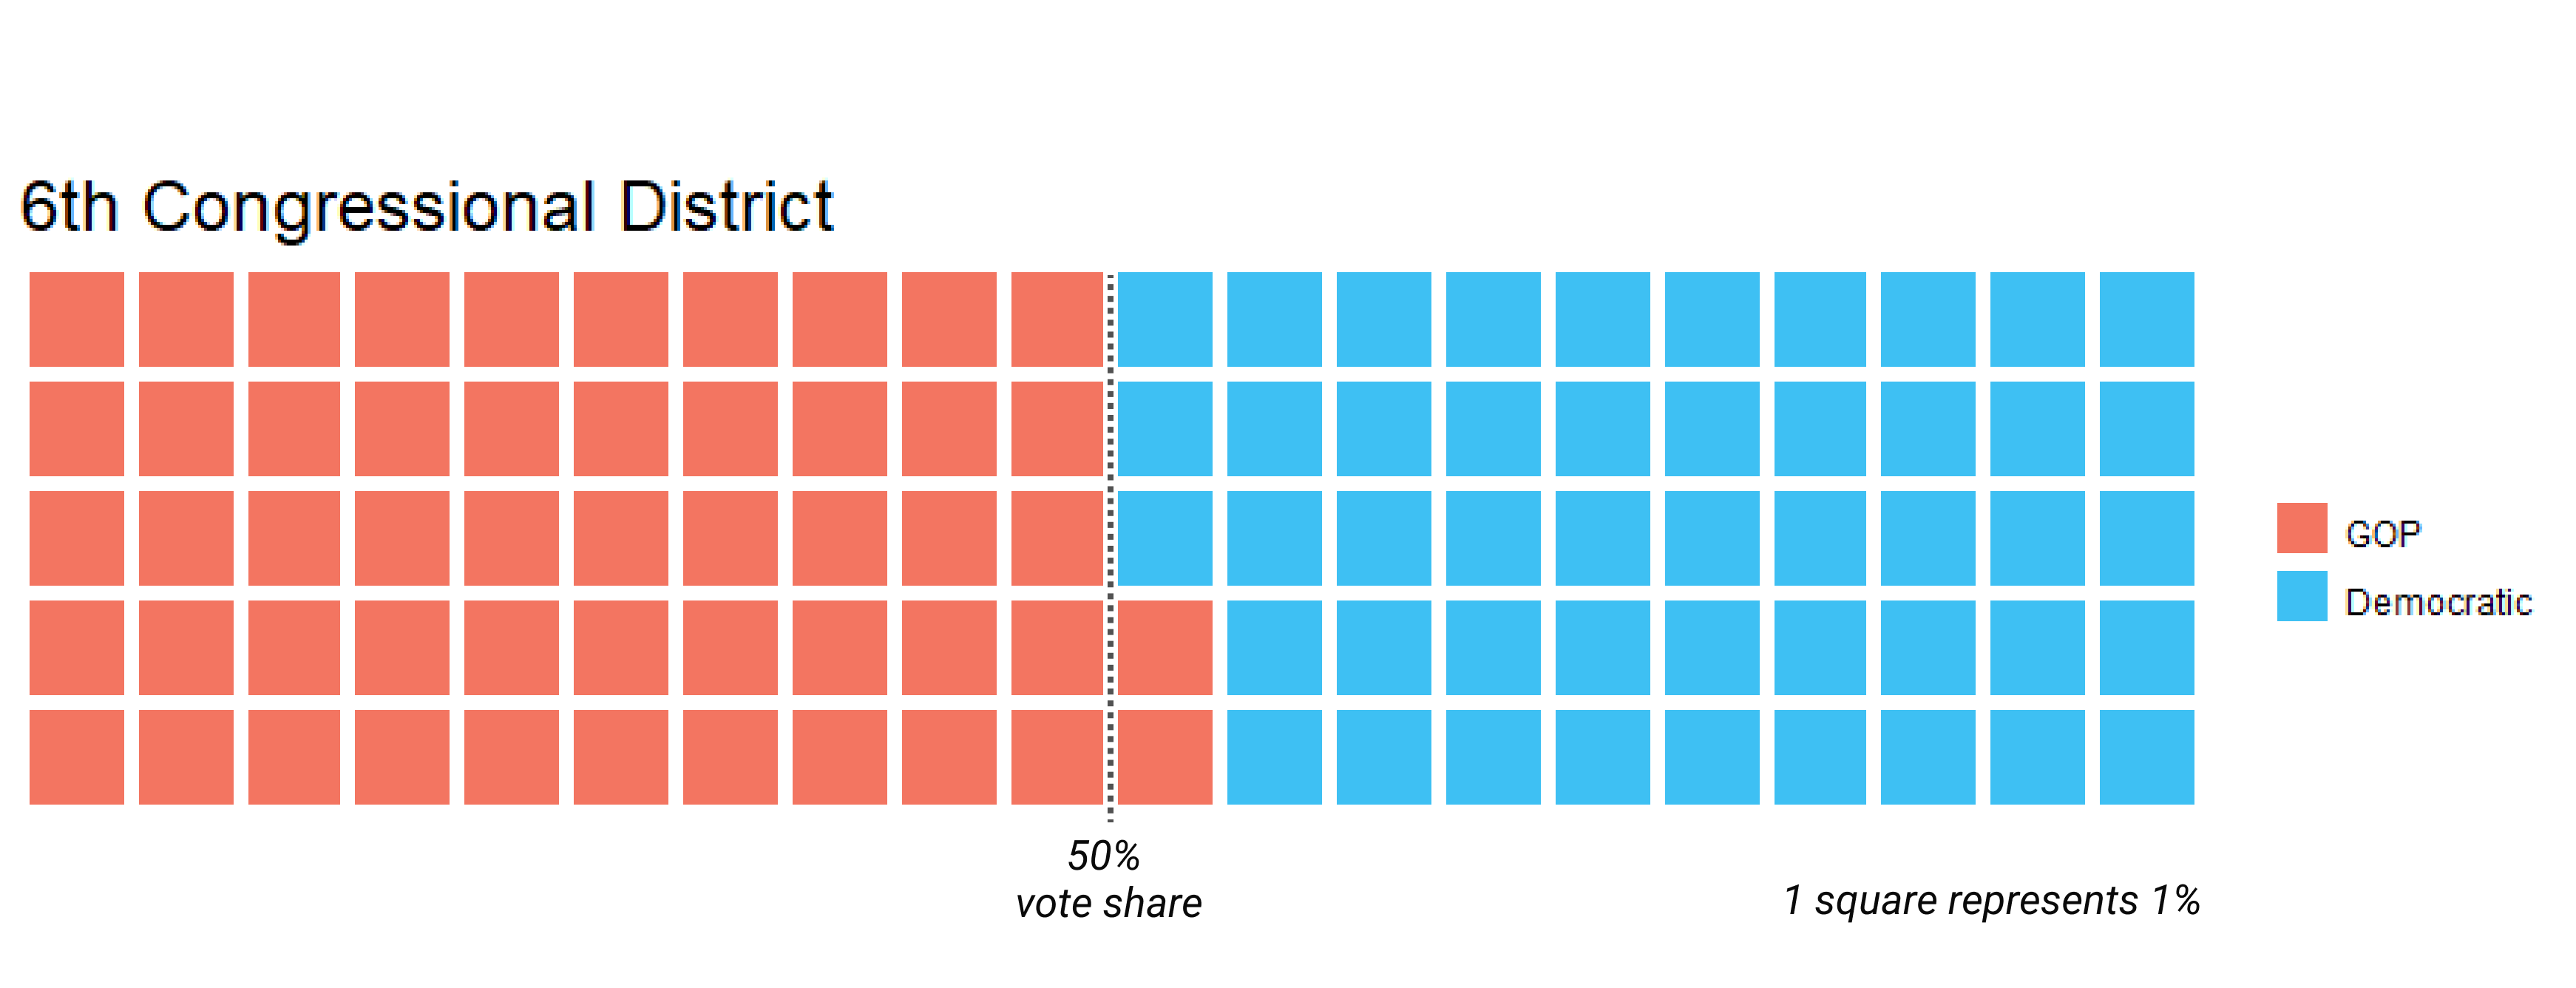
6th Congressional District Partisan Vote Share
6th Congressional District
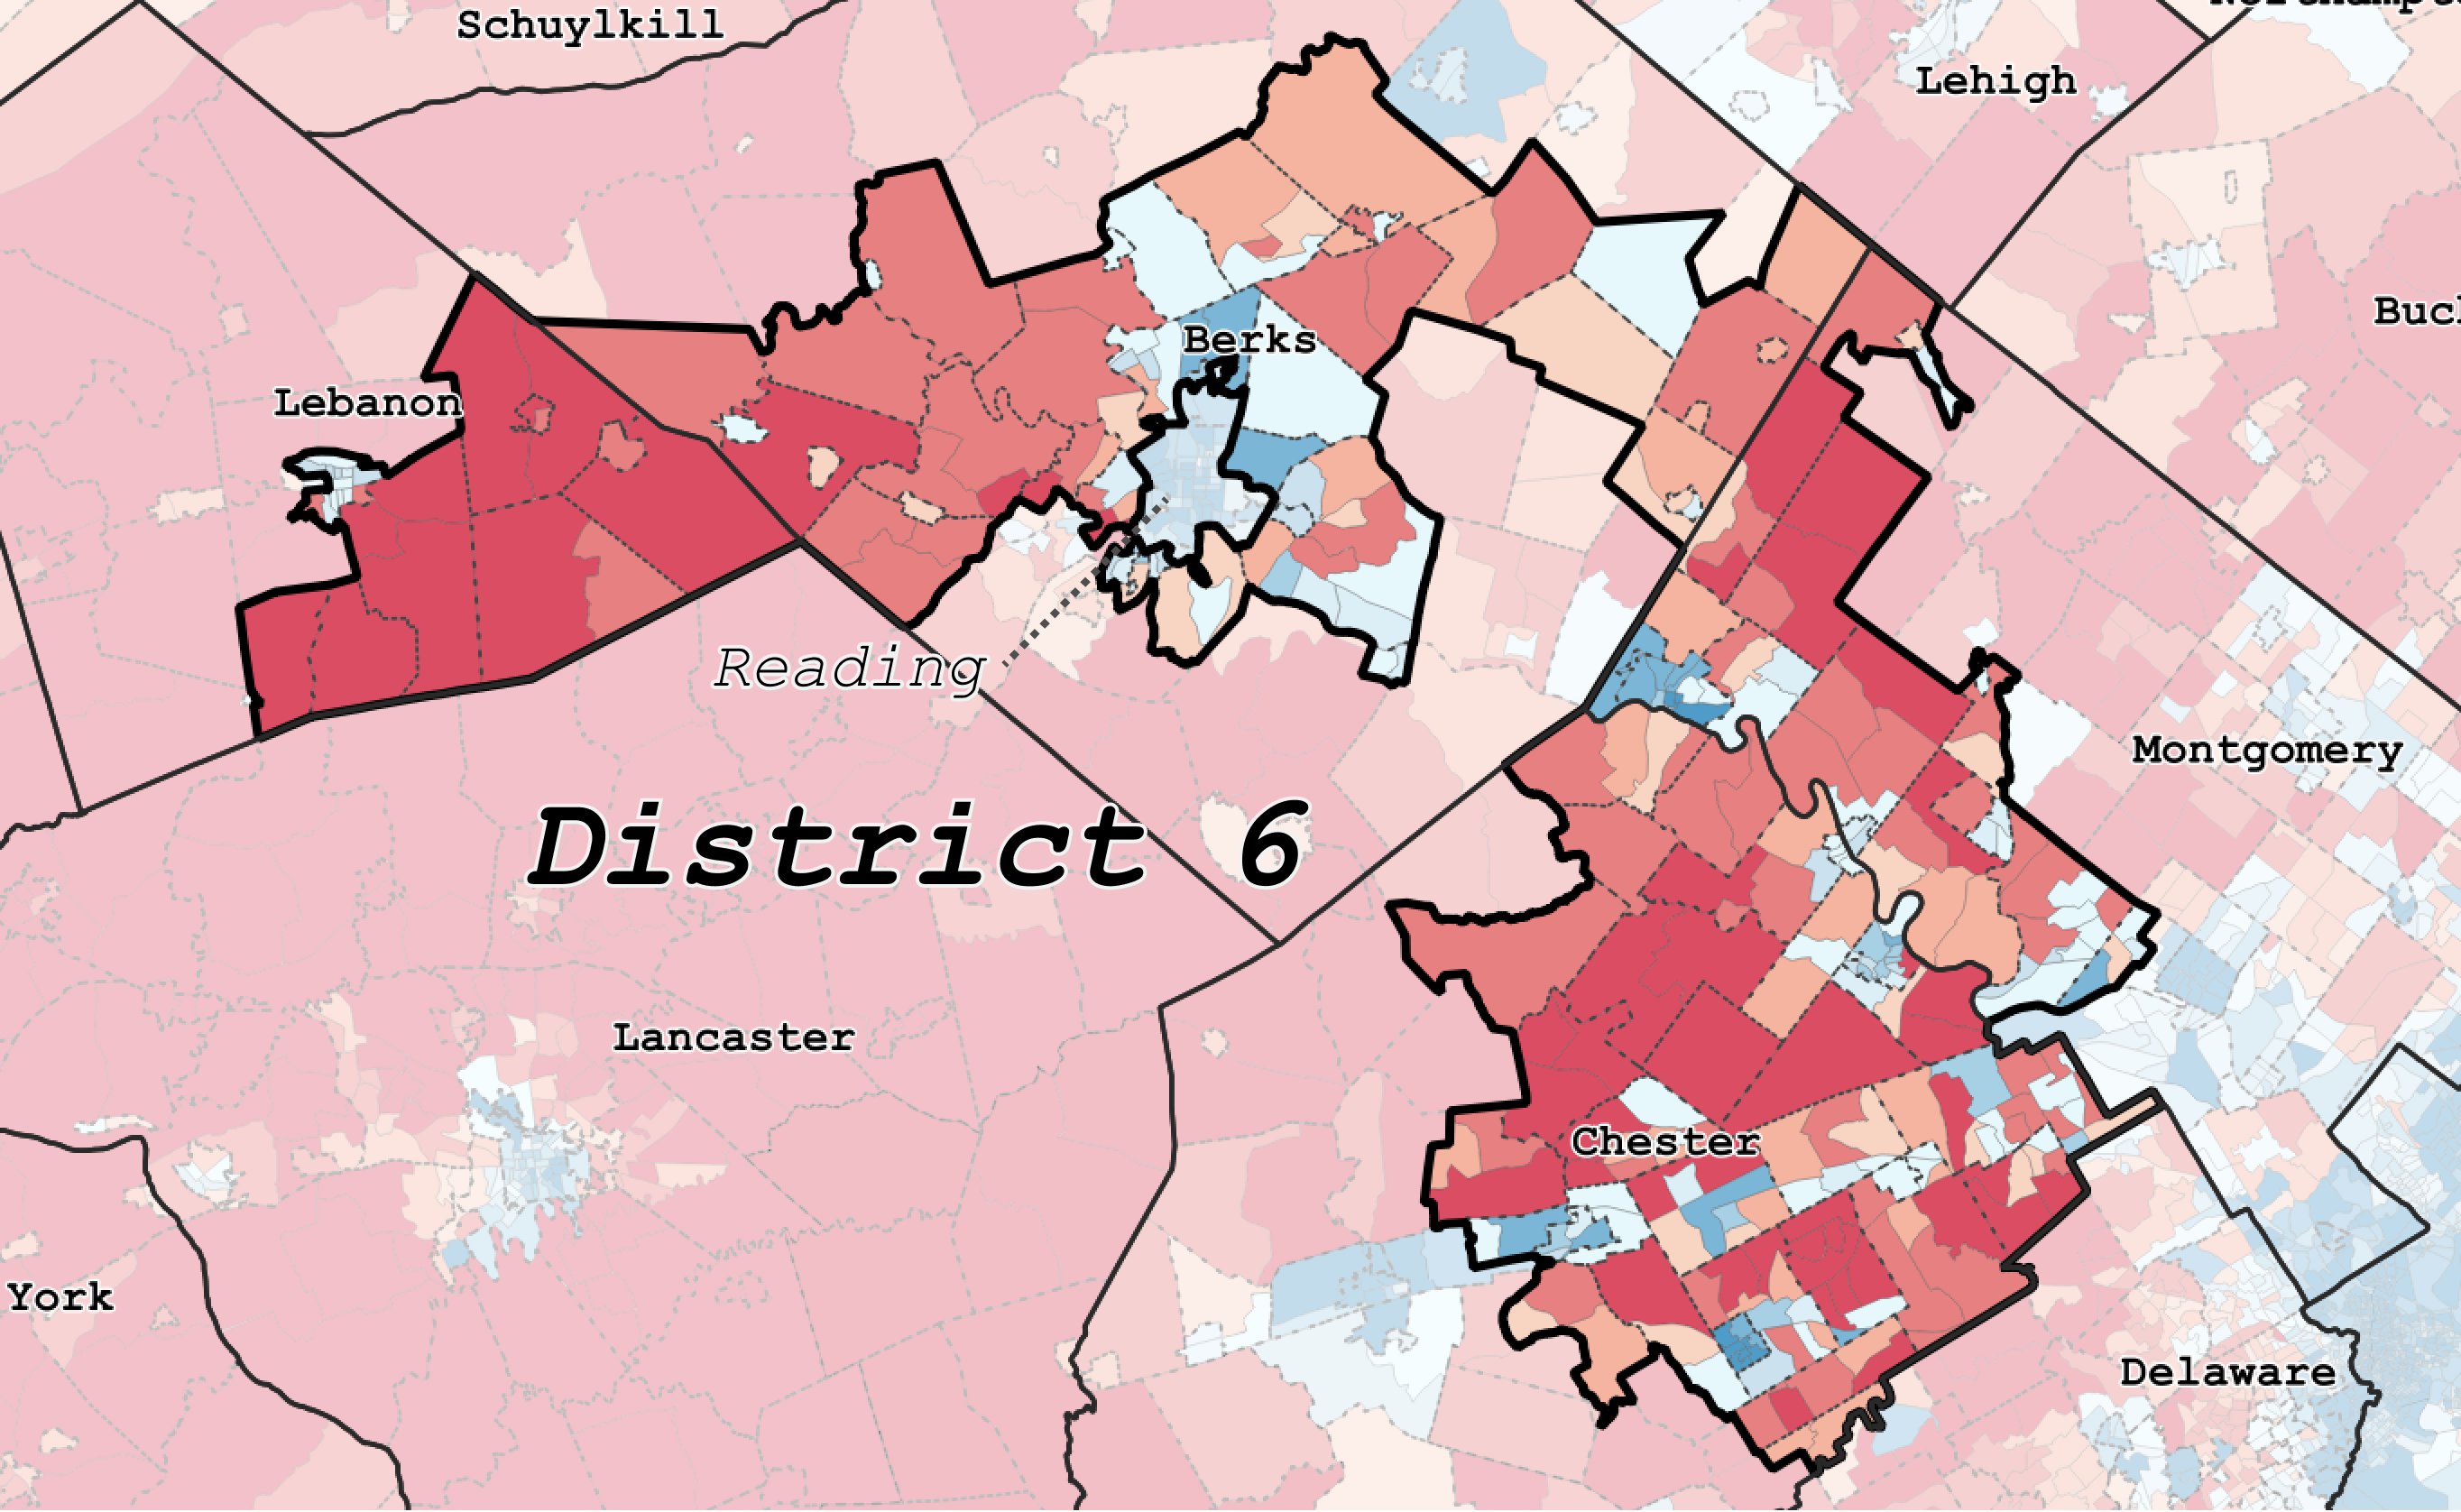
The 6th Congressional District stretches from northern Chester County, through southwestern Montgomery County, into Berks and Lebanon County. This is a classic case of cracking. The bulk of the 6th district, and its previous incarnation, was located in the Philadelphia suburbs. As they have trended more Democratic, the 6th district was clearly redrawn with an appendage north and westward to pick up more reliable Republican voters in suburban Berks and rural Lebanon County.
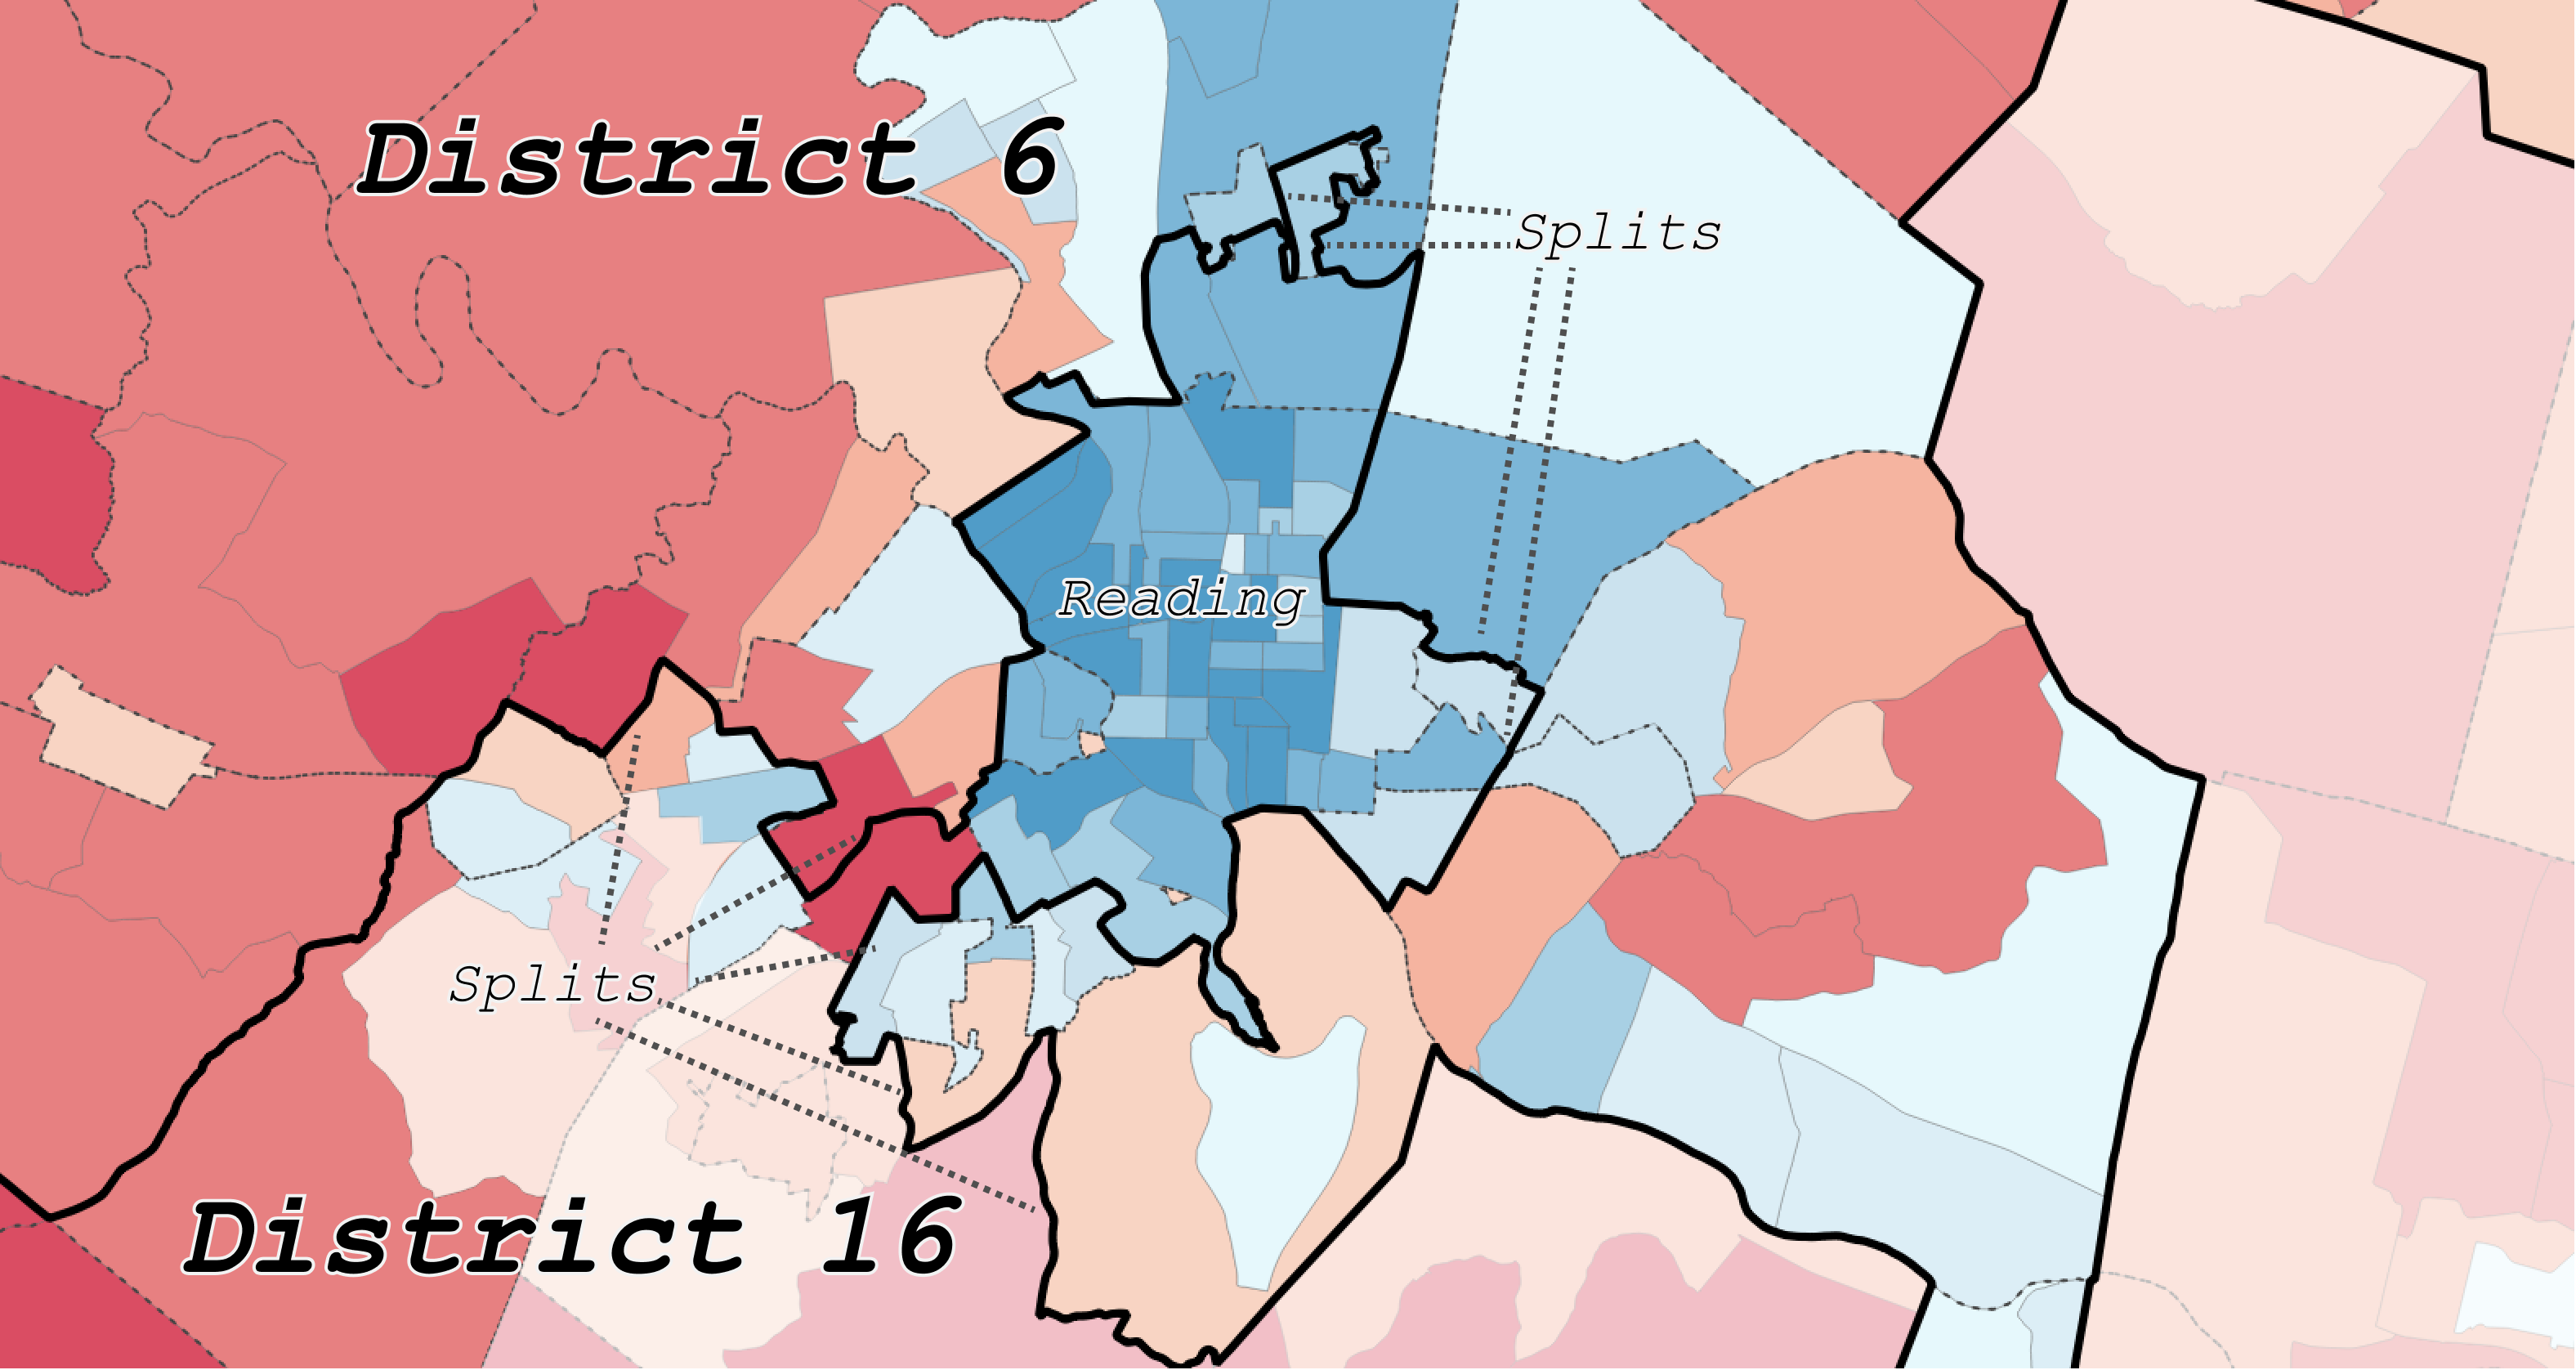
6th Congressional District surrounding Reading
Note how the appendage conveniently avoids picking up the heavily Democratic city of Reading in Berks County and instead encompasses as many Republican voters as possible west to Lebanon County. Several municipalities outside of Reading are also split. The 6th District also splits two Democratic leaning precincts from the rest of Lebanon city, in an effort to crack a Democratic-leaning area.
7th Congressional District

7th Congressional District Partisan Vote Share
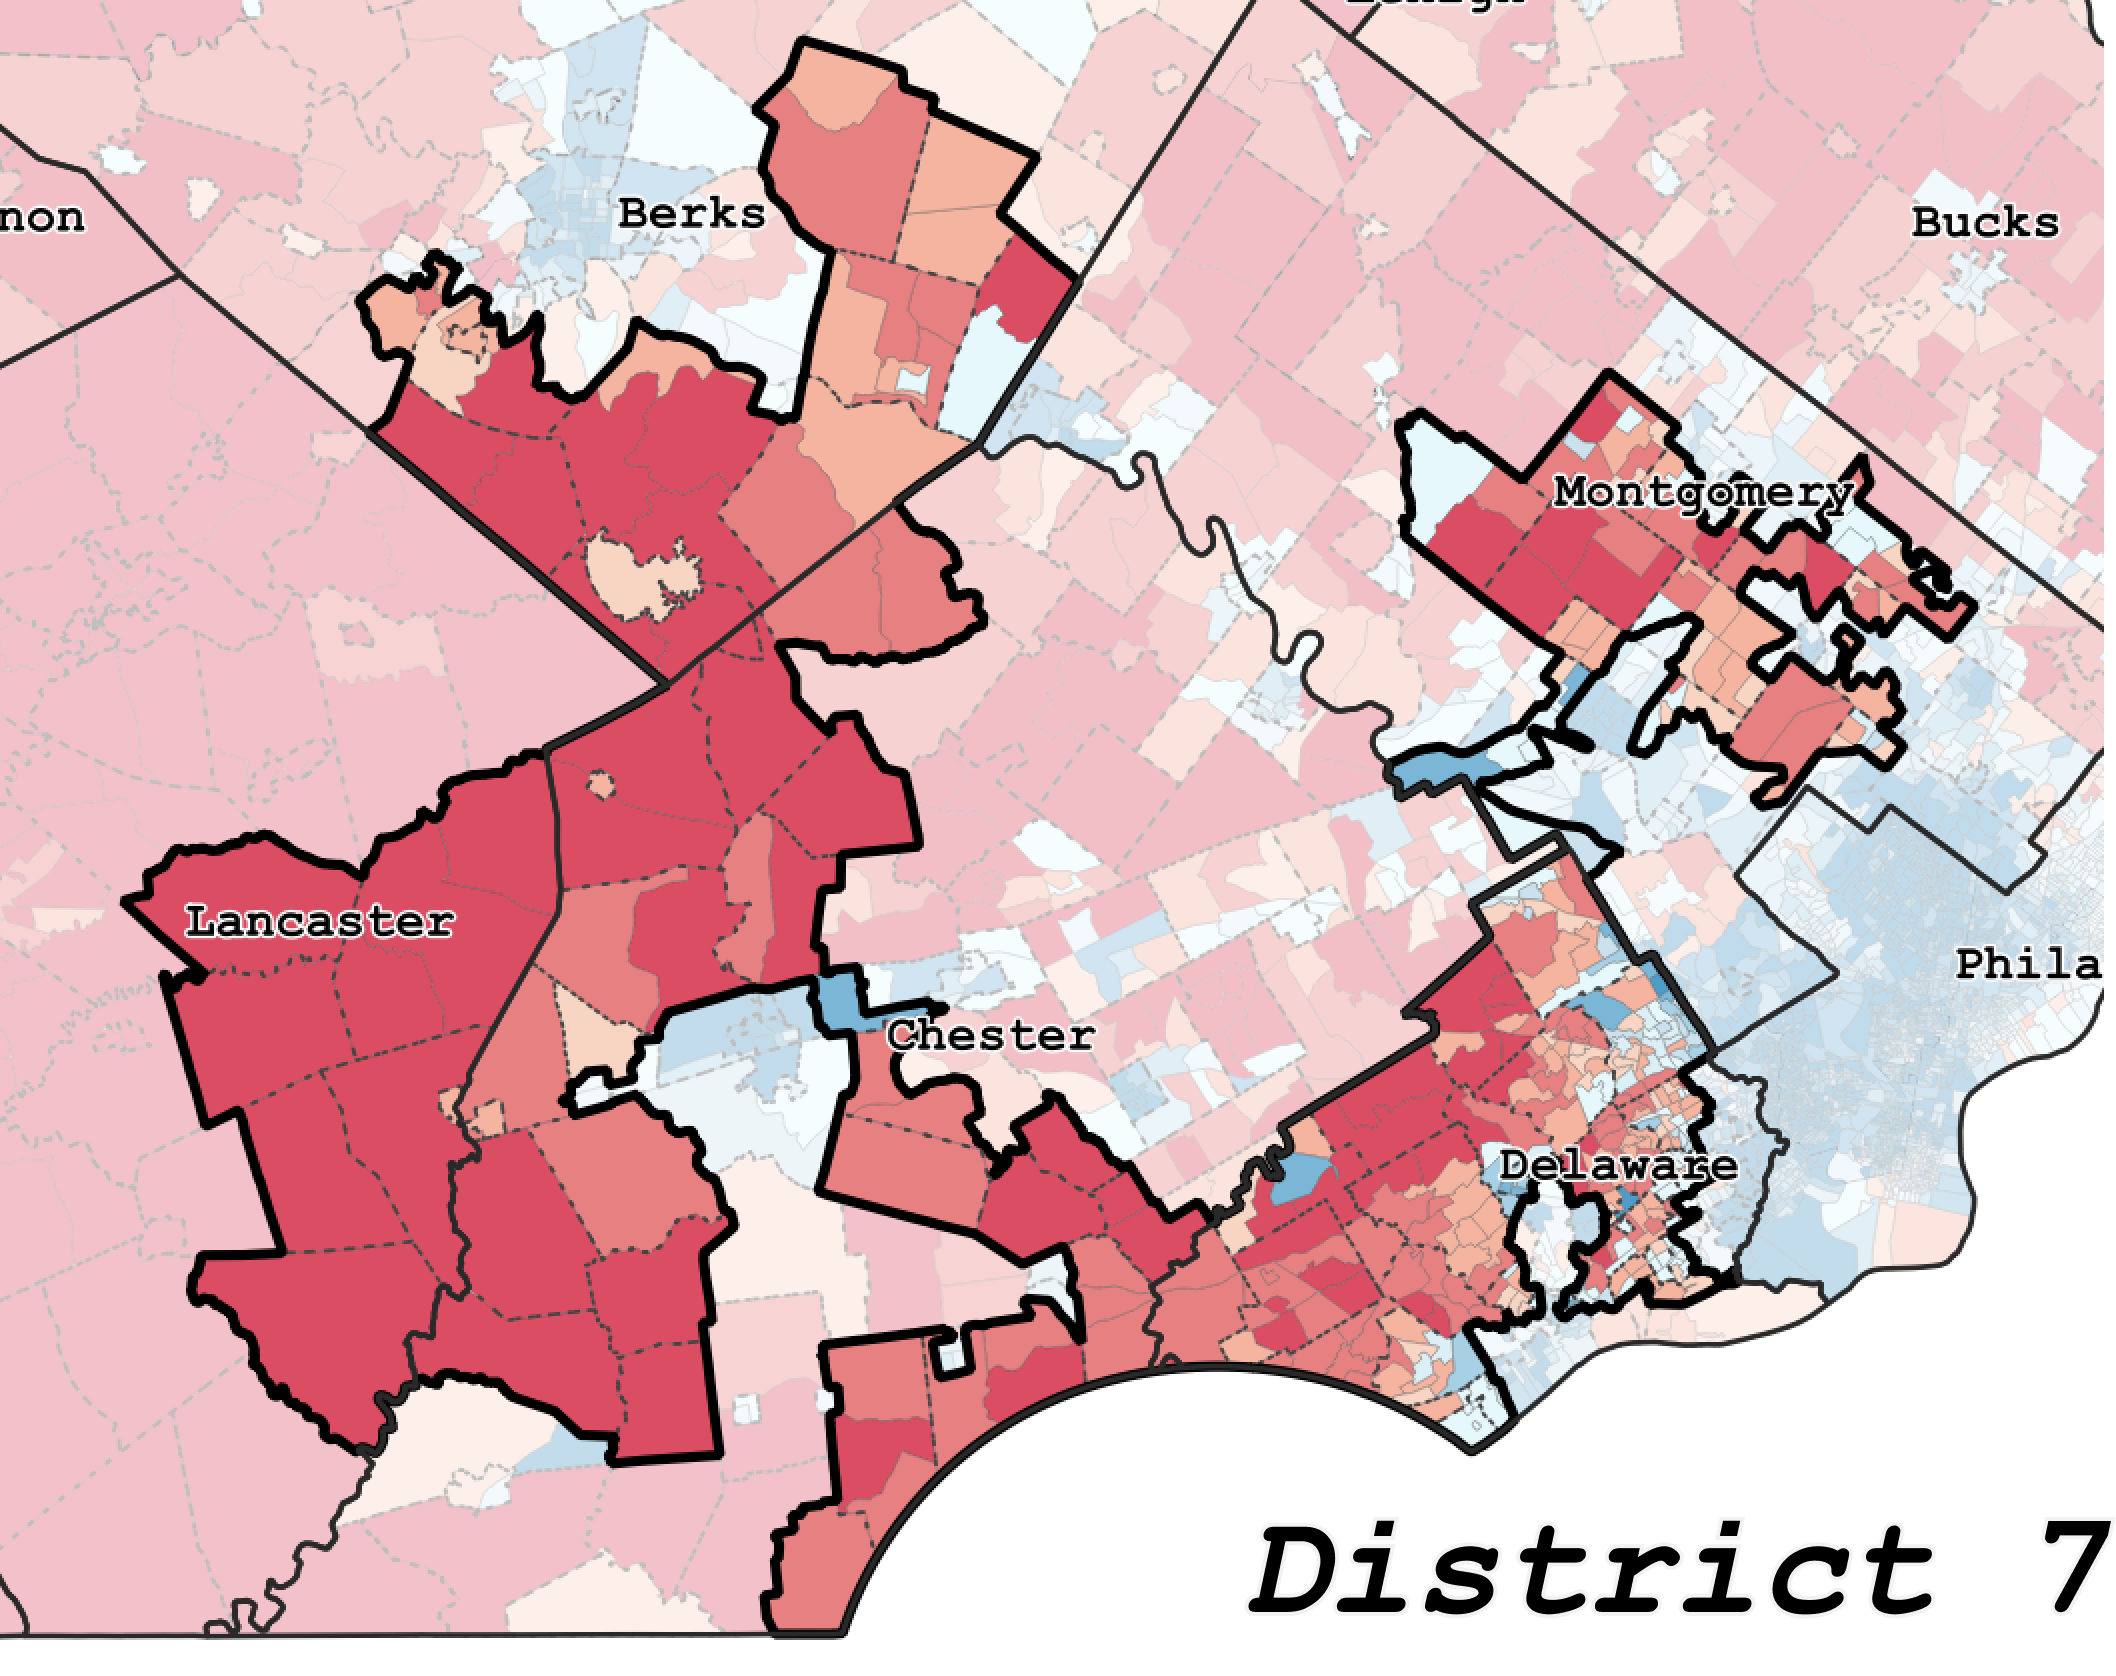
7th Congressional District
The 7th Congressional district is widely considered to be a posterchild for gerrymandering due to its shape. The district stretches from Delaware county, with a thin appendage – only one voting precinct wide near Coatesville – then expands again in western Chester county, picking up precincts in eastern Lancaster County while also picking up parts of southern Berks County. Like the 6th, the previous version of the districts was centered in the Philadelphia suburbs, but the latest iteration pushed the district westward to pick up more Republican territory.
This district is the most visibly extreme case of the mapmakers attempting to create a safe Republican district by avoiding the numerous Democratic pockets of southeastern Pennsylvania.
In one of the defendent’s expert witness reports, the witness states the district “is described as a distortion only because of the way the population is settled in the underlying grid.” But, the author fails to provide any evidence that the underlying geography of the 7th district in any way necessitates a meandering shape. It is true that measuring gerrymandering using only a compactness calculation that takes into account district boundary length, for example, would be a poor way to assess gerrymandering in such a case. However, it can be quite suitable here. The 7th district does not need to curve, twist, and contain multiple centers of gravity because of natural or physical features. In contrast, I note that partisan considerations at the voting precinct level have clearly played a part in the crafting of this district and its intended outcome.
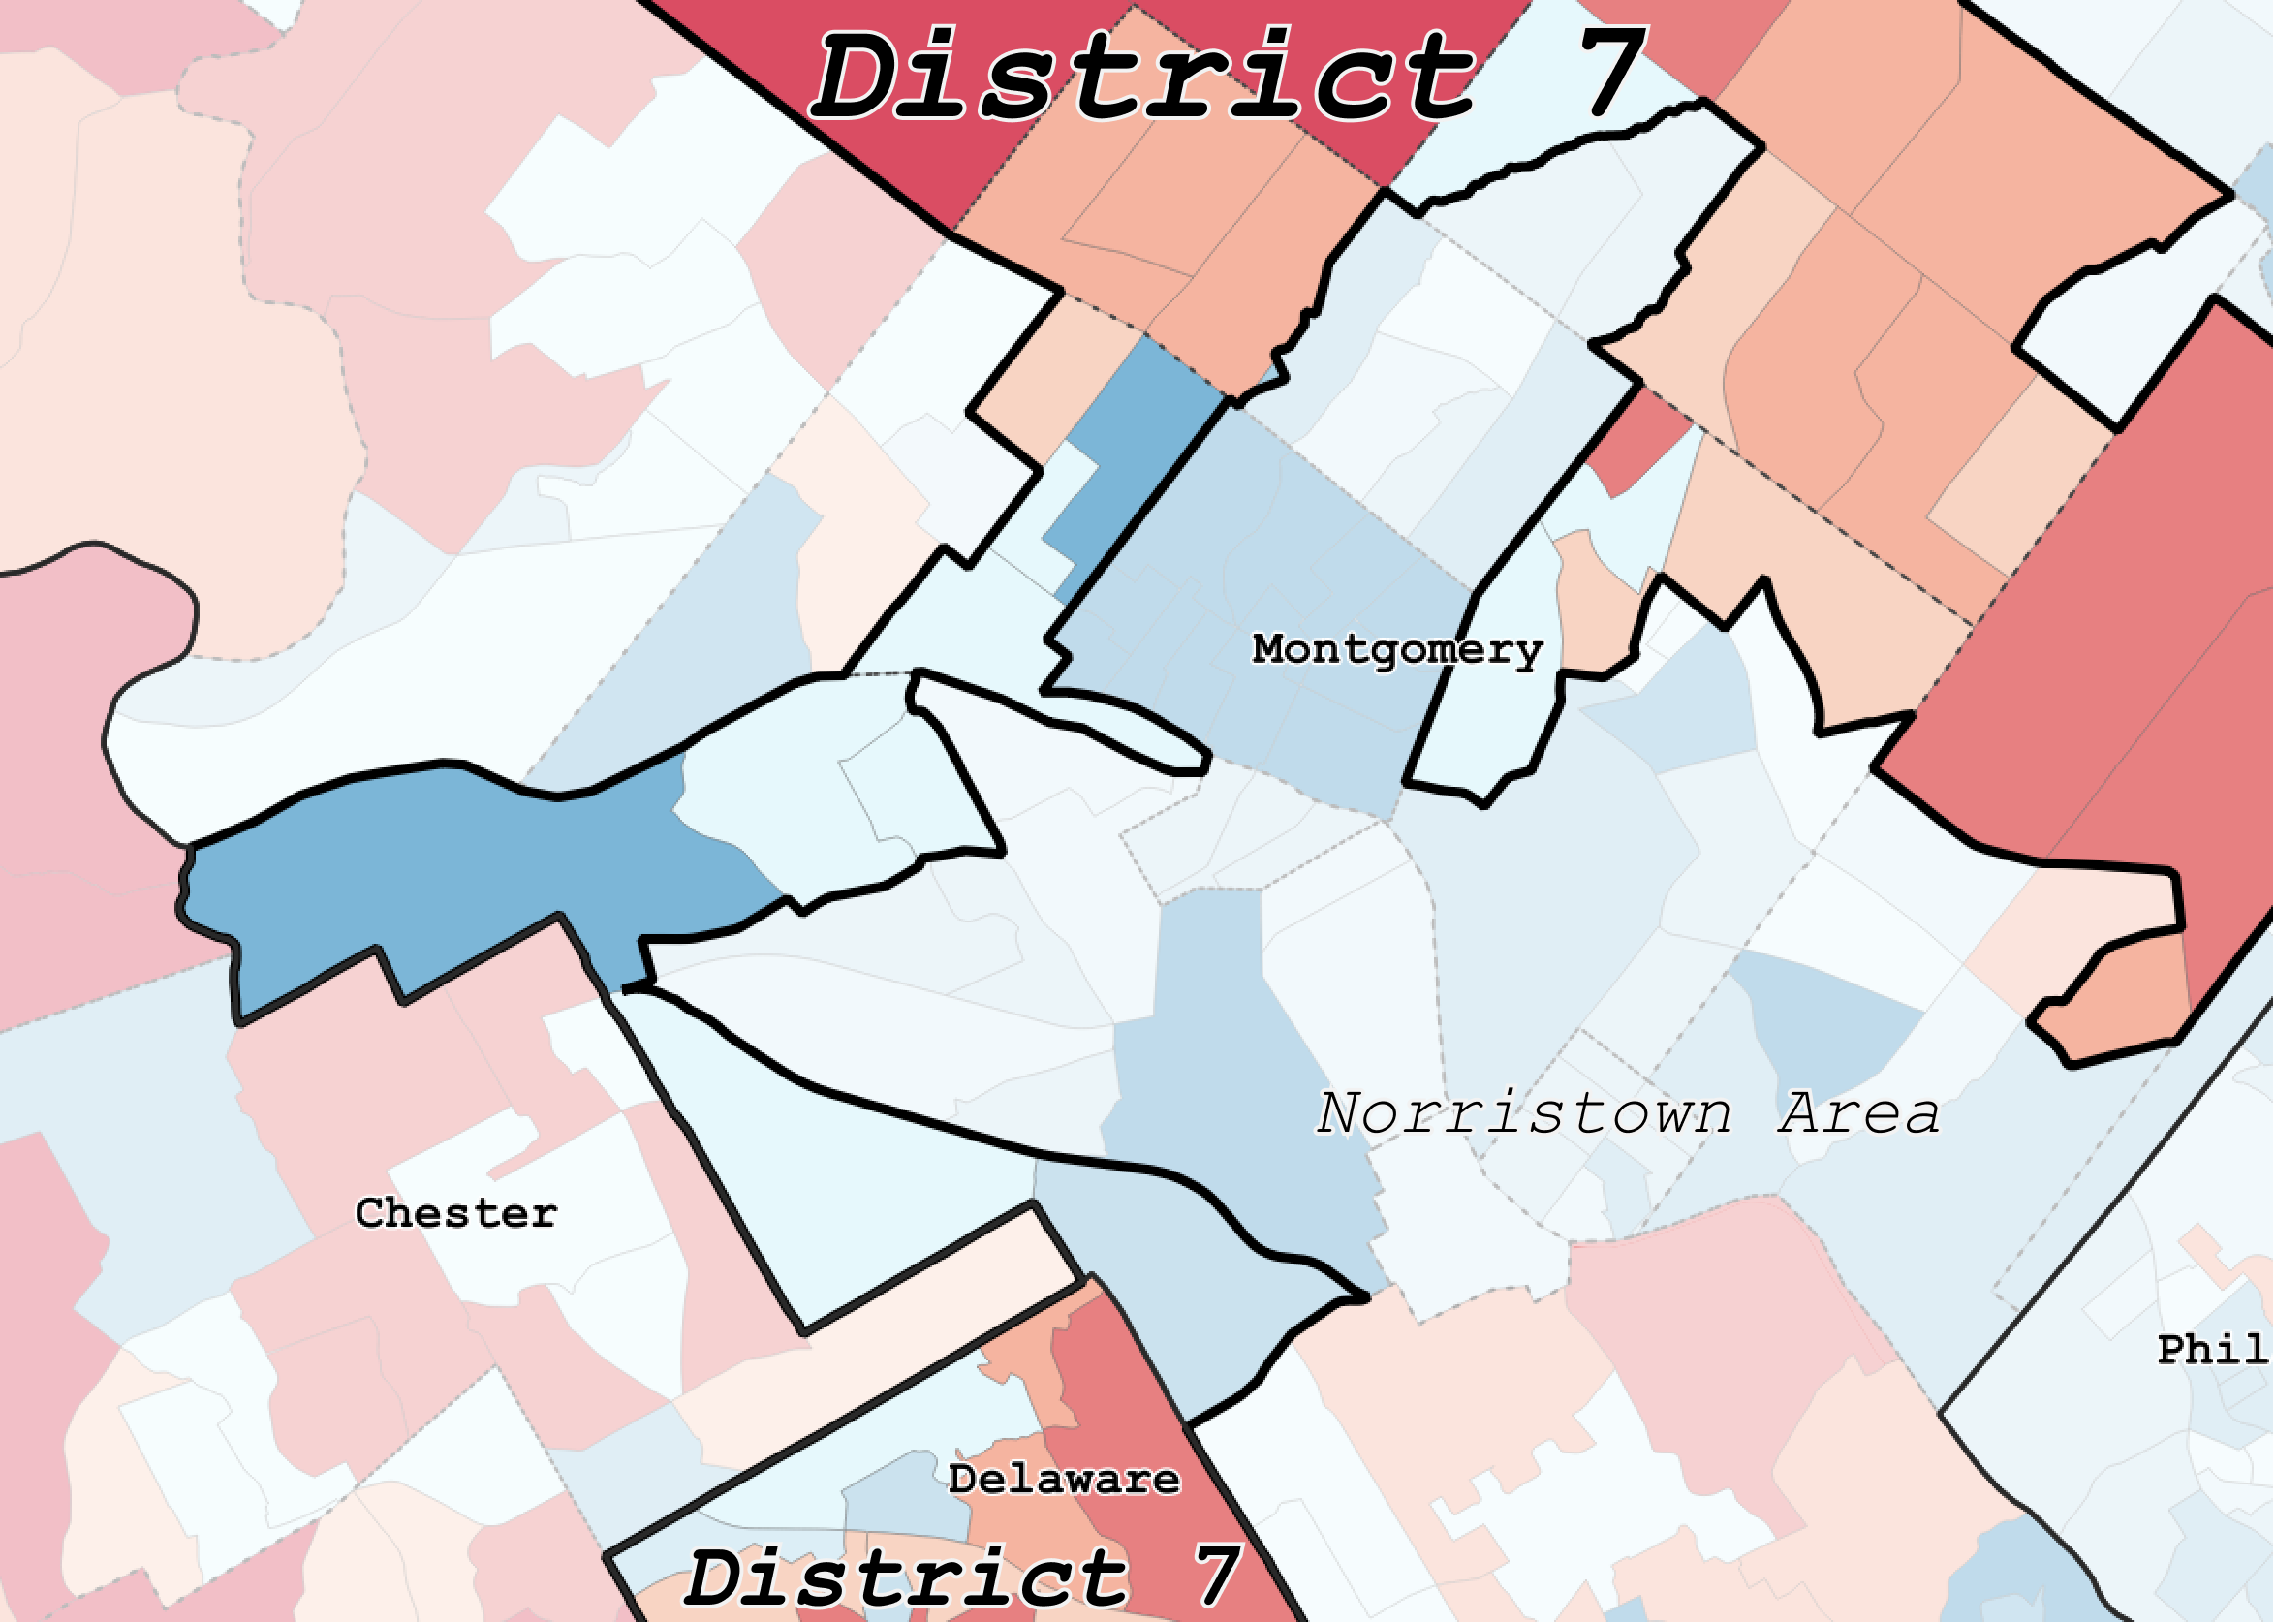
7th Congressional District near Norristown
It can be clearly seen how the 7th district avoids the heavily Democratic center of Norristown, which is given to the safe 13th district. The 7th contains the Republican areas of central Montgomery County, but must also connect to the Republican areas of Delaware County. This connection, at times only as wide as an interstate freeway, connects the two as it avoids the Democratic city of Norristown. The 7th snakes through Upper Merion township there, without expanding or picking up too many Democratic voters, in an attempt to pack them into the 13th.
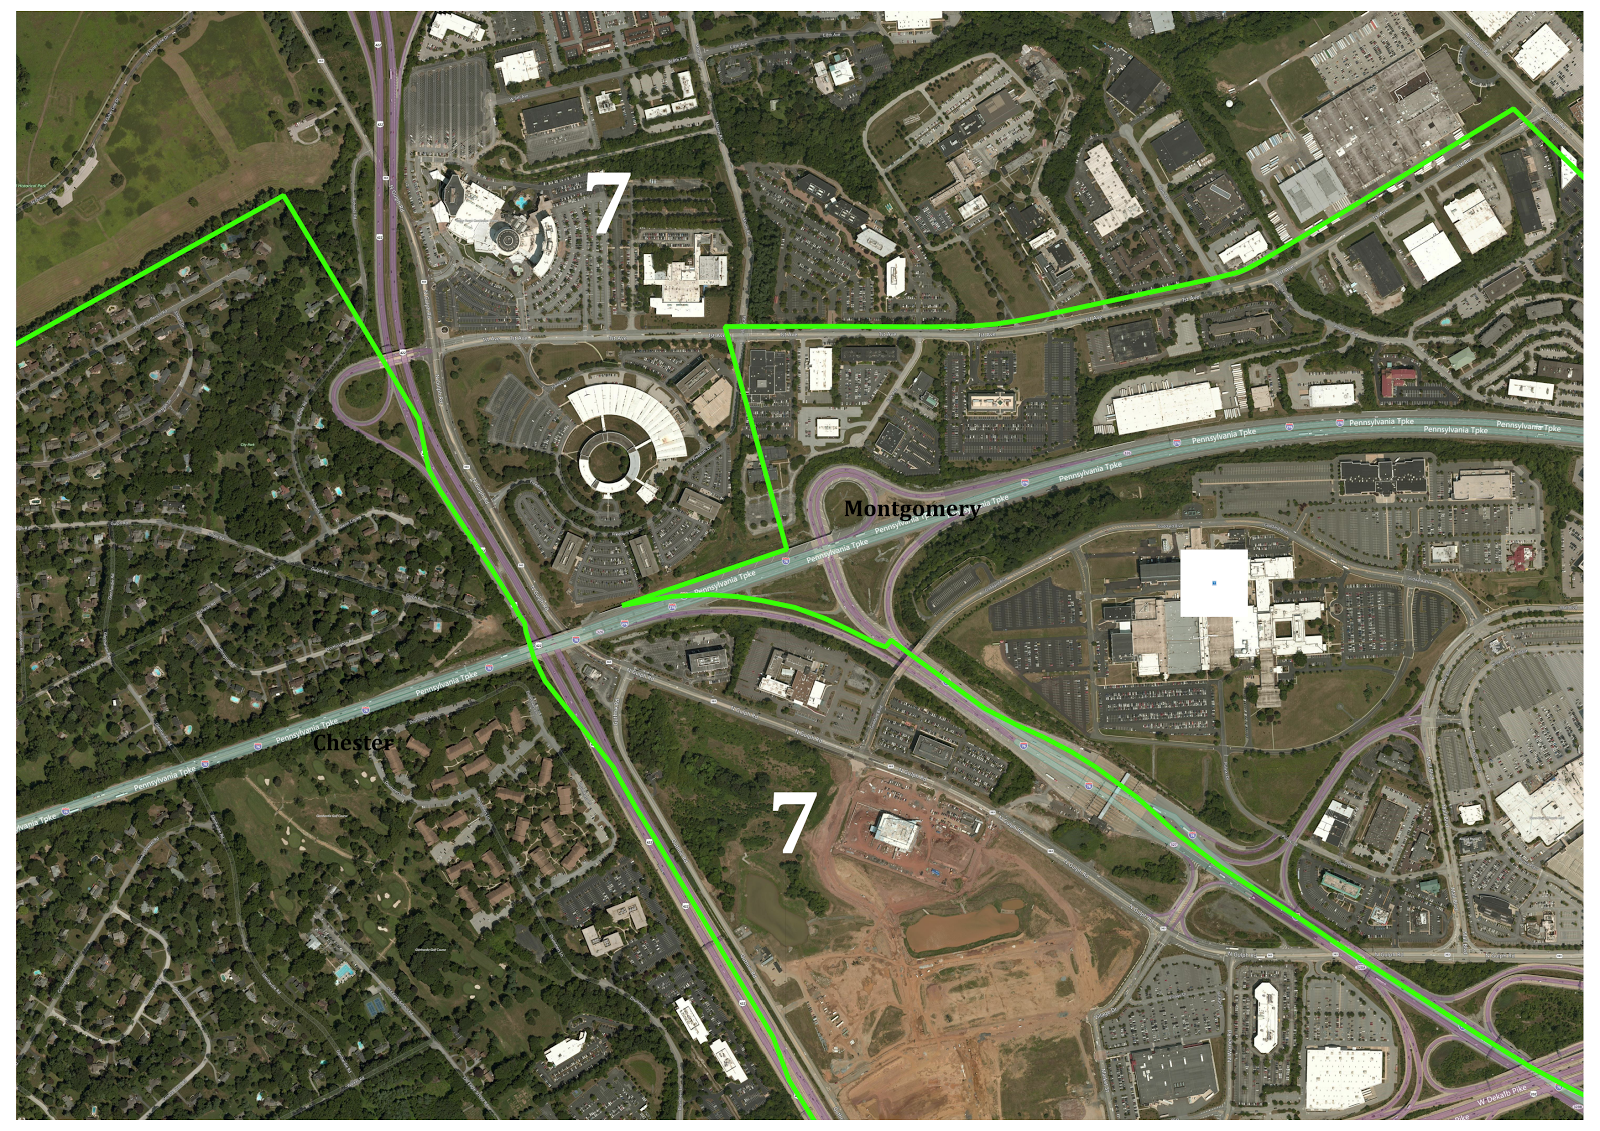
7th Congressional District at Pennsylvania Turnpike
Perhaps the most extreme example is the 7th District as it moves through King of Prussia and crosses the Pennsylvania Turnpike, where it is only 170 meters wide at one point. As noted in the discussion of the 1st district, the 7th district encompasses the Republican areas of Delaware County while packing the Democratic river boroughs and Swarthmore into the 1st district.
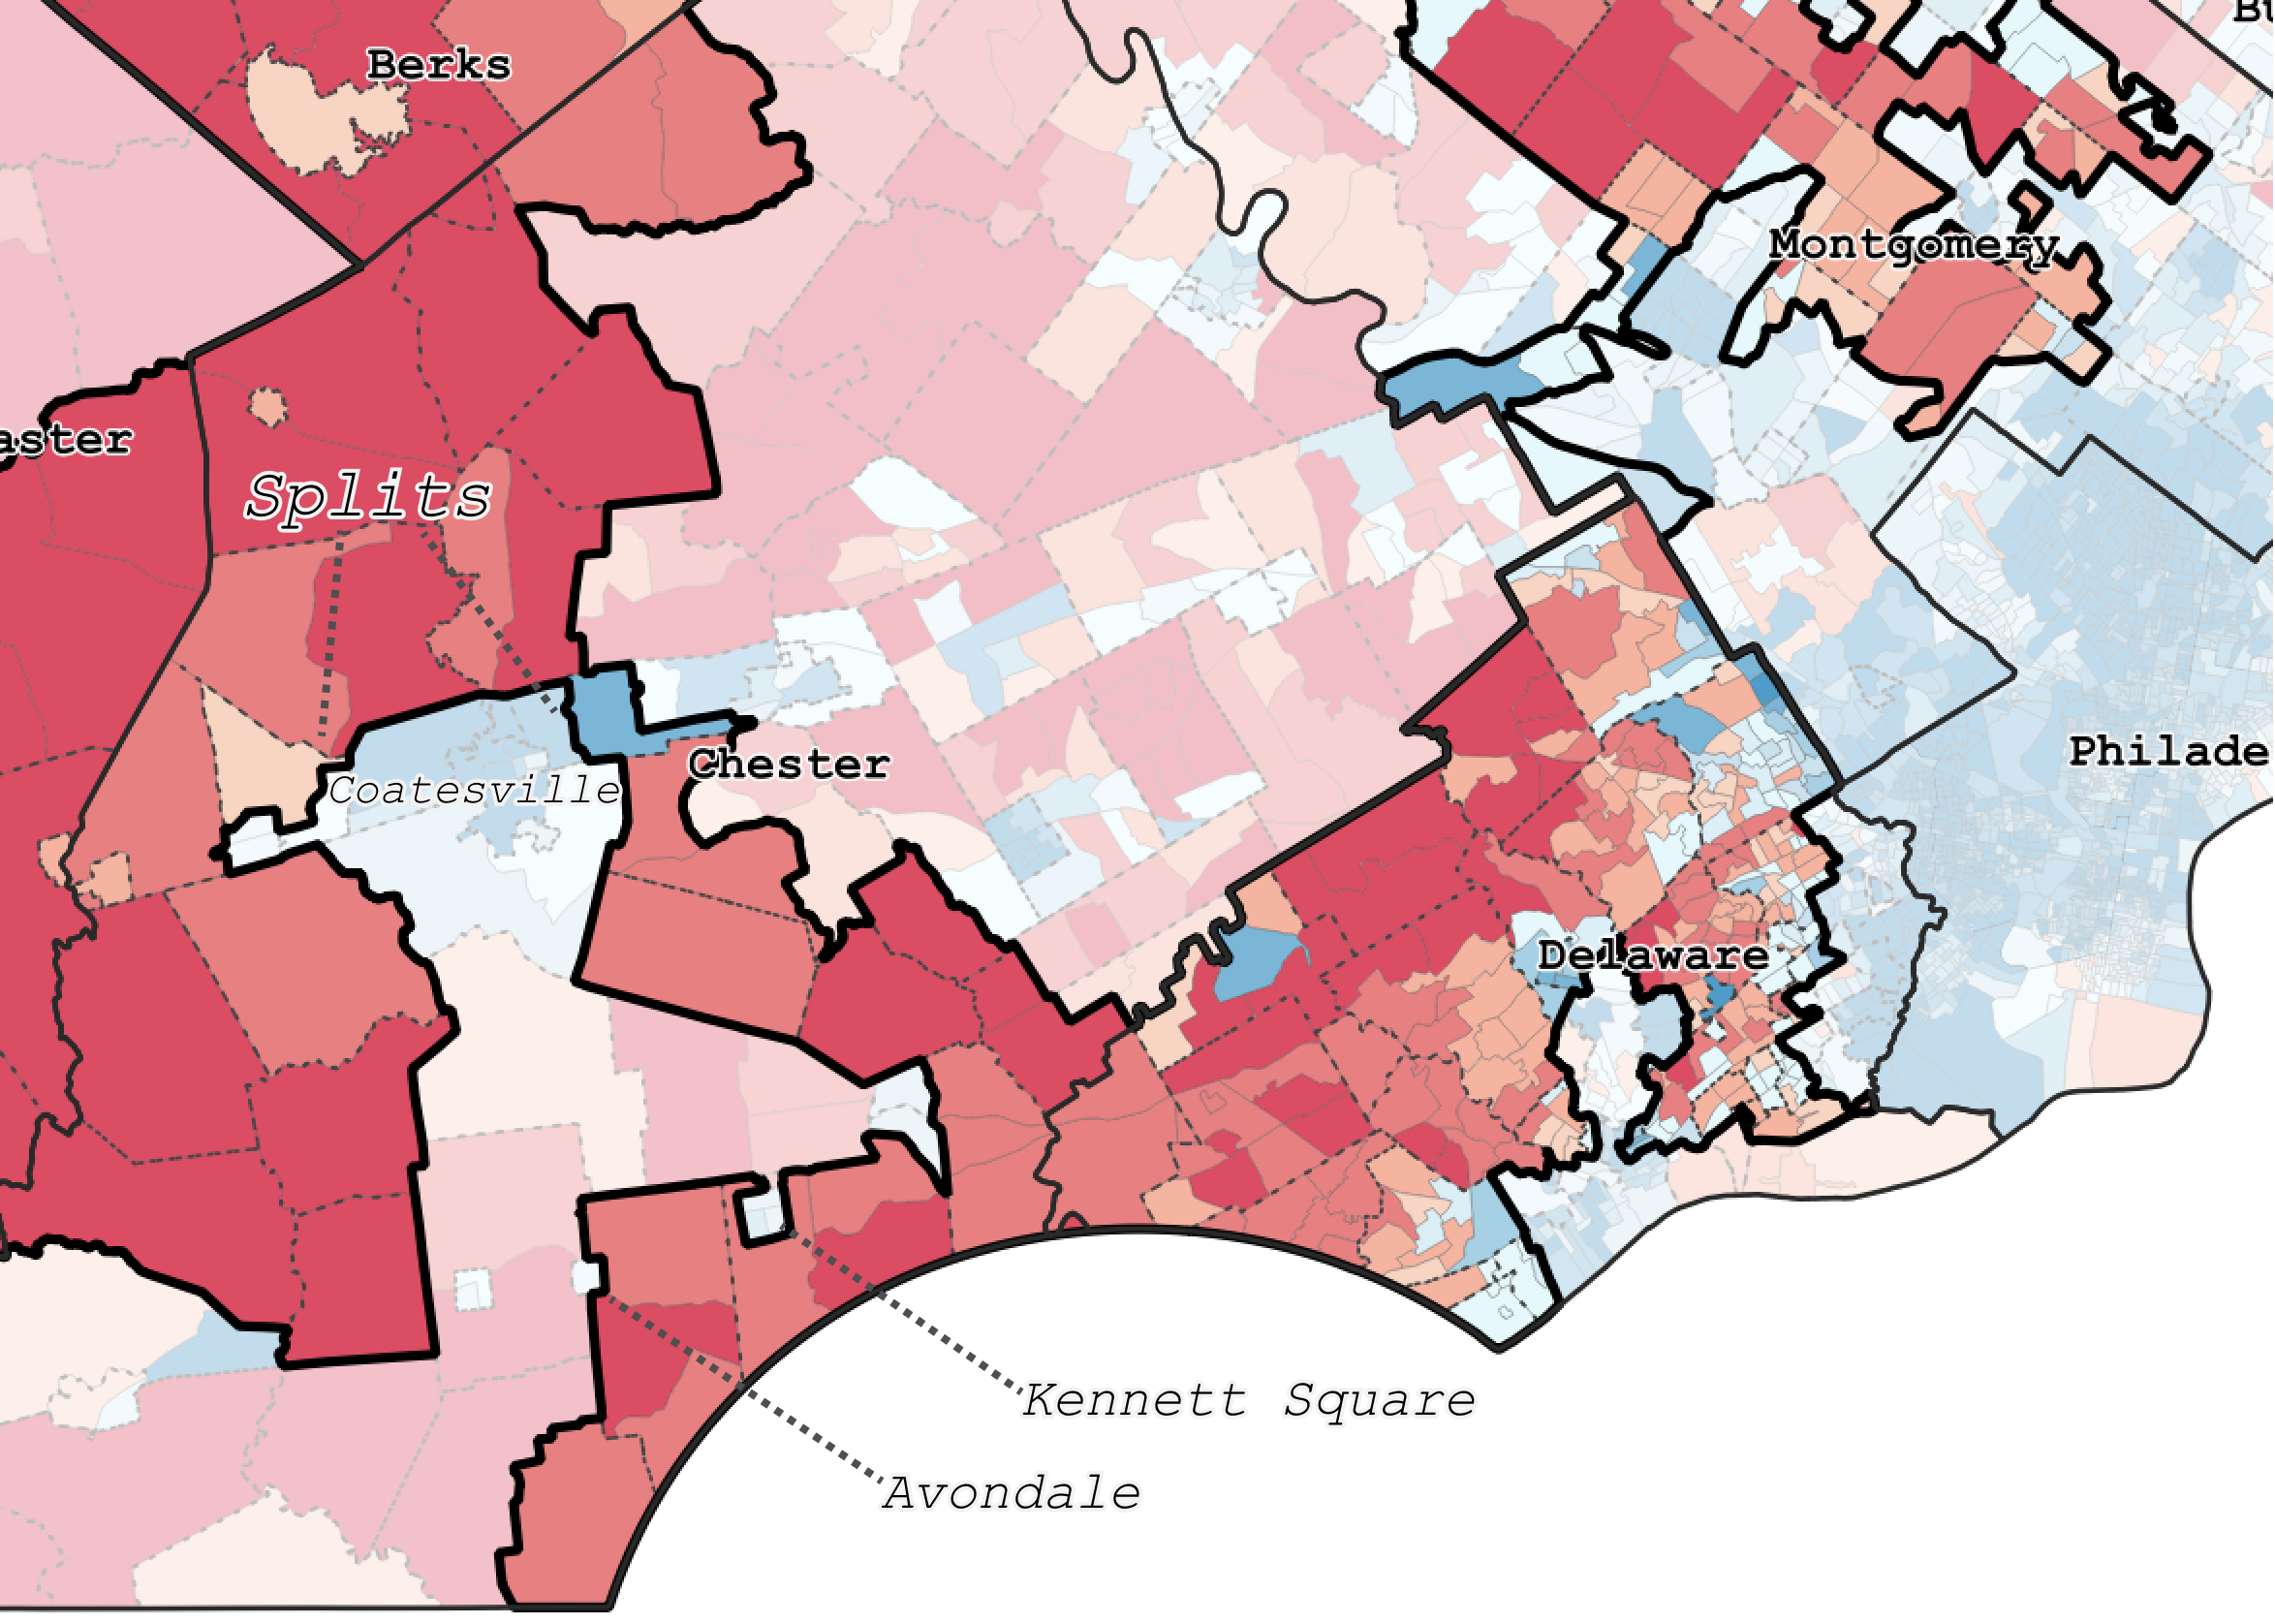
7th Congressional District in Chester County
In Chester county, the 7th district snakes from the southeastern corner in two directions – southwest and northwest. To the southwest, note how the district avoids the Democratic leaning Kennett Square borough, Avondale borough, Pennsbury township and Lower Oxford township, which are all placed into the 16th in an effort to crack the Democratic vote there. Therefore, the 7th district also completely avoids but nearly surrounds the heavily-Democratic city of Coatesville. Just east of Coatesville, the district is only one voting precinct wide. In an effort to pick up even more Republican voters, the district extends into heavily-Republican eastern Lancaster County. Farther north, the 7th expands into southern Berks County to pick up more Republican areas.
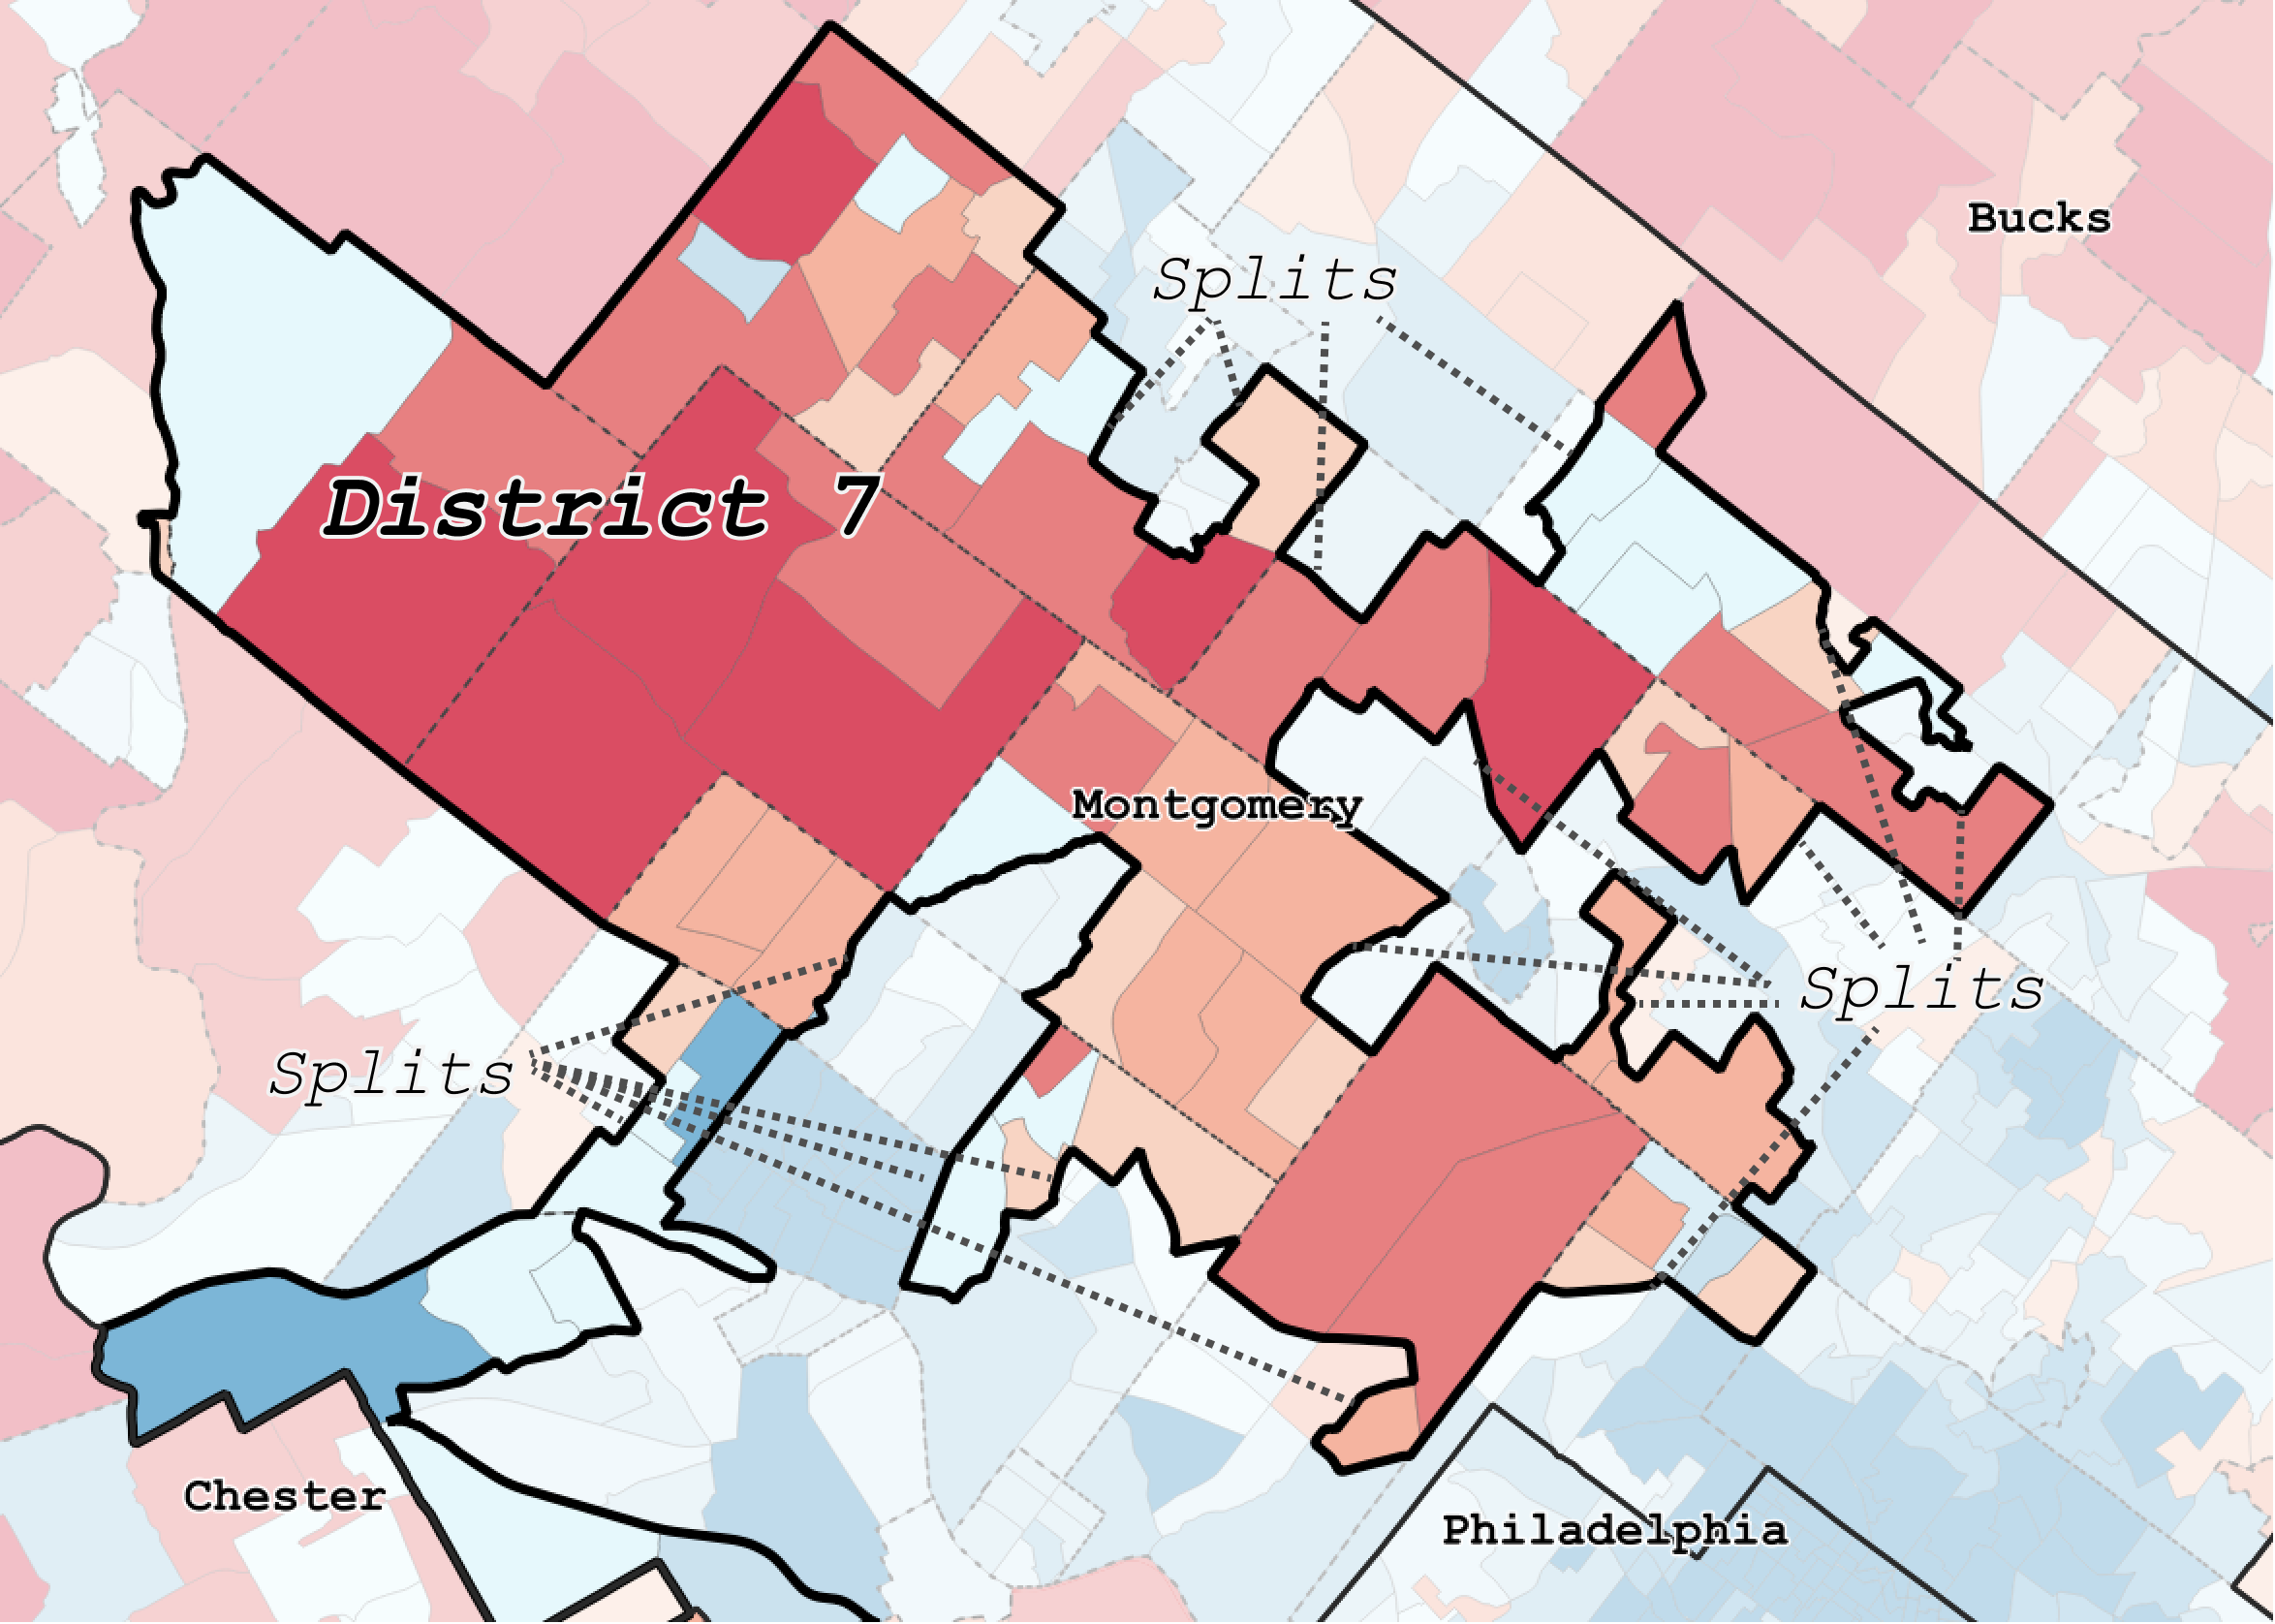
7th Congressional District in Montgomery County
Here, the 7th District’s northern branch weaves narrowly through lower Montgomery County to encompass more Republican performing areas in the northern part of the County. But notice it avoids Democratic centers, also noted in the 13th district description. Here the 7th splits over a several municipalities, some of them in multiple locations.
The defendants expert witnesses both assert that continuity should be an important factor between plans. If that is the case, then it is inconceivable that the 7th district would go from a district based mostly in Delaware, eastern Chester and southwestern Montgomery County to one that grows massively westward, with thin one-precinct-wide arms, into heavily-Republican western Chester, eastern Lancaster, southern Berks and upper Montgomery County. The previous version of the 7th district abuts several Democratic-performing voting precincts, such as in West Chester borough and Norristown city. If continuity was indeed the concern, why did the 7th district not grow to encompass those Democratic areas instead? Why did it avoid those precincts to instead grab massive amounts of Republican voters? It instead snakes around these Democratic centers. Clearly, this was done for partisan reasons in an effort to bring more Republican voters into the district.
11th Congressional District
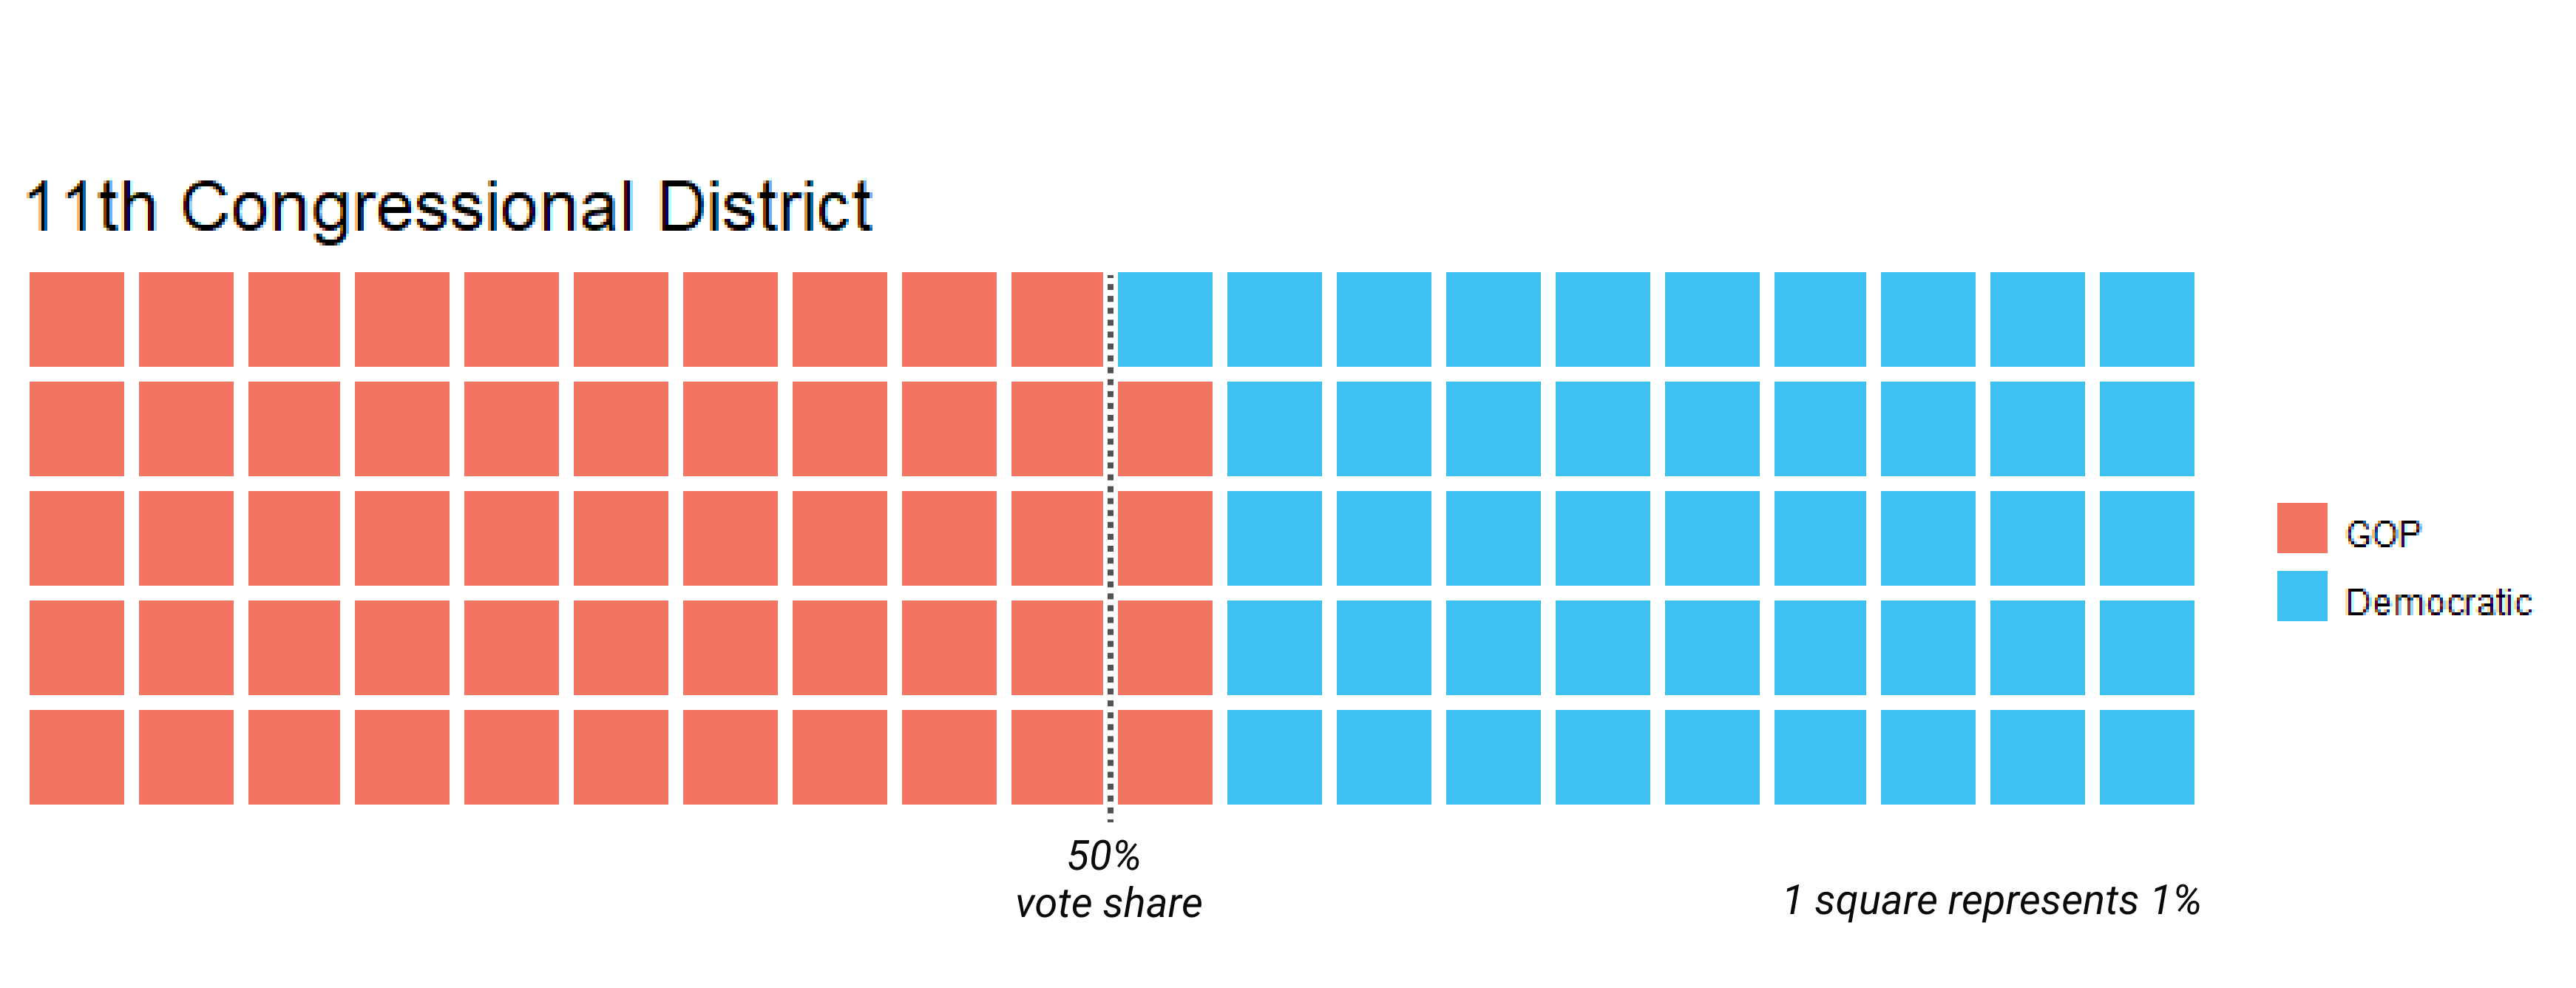
11th Congressional District Partisan Vote Share
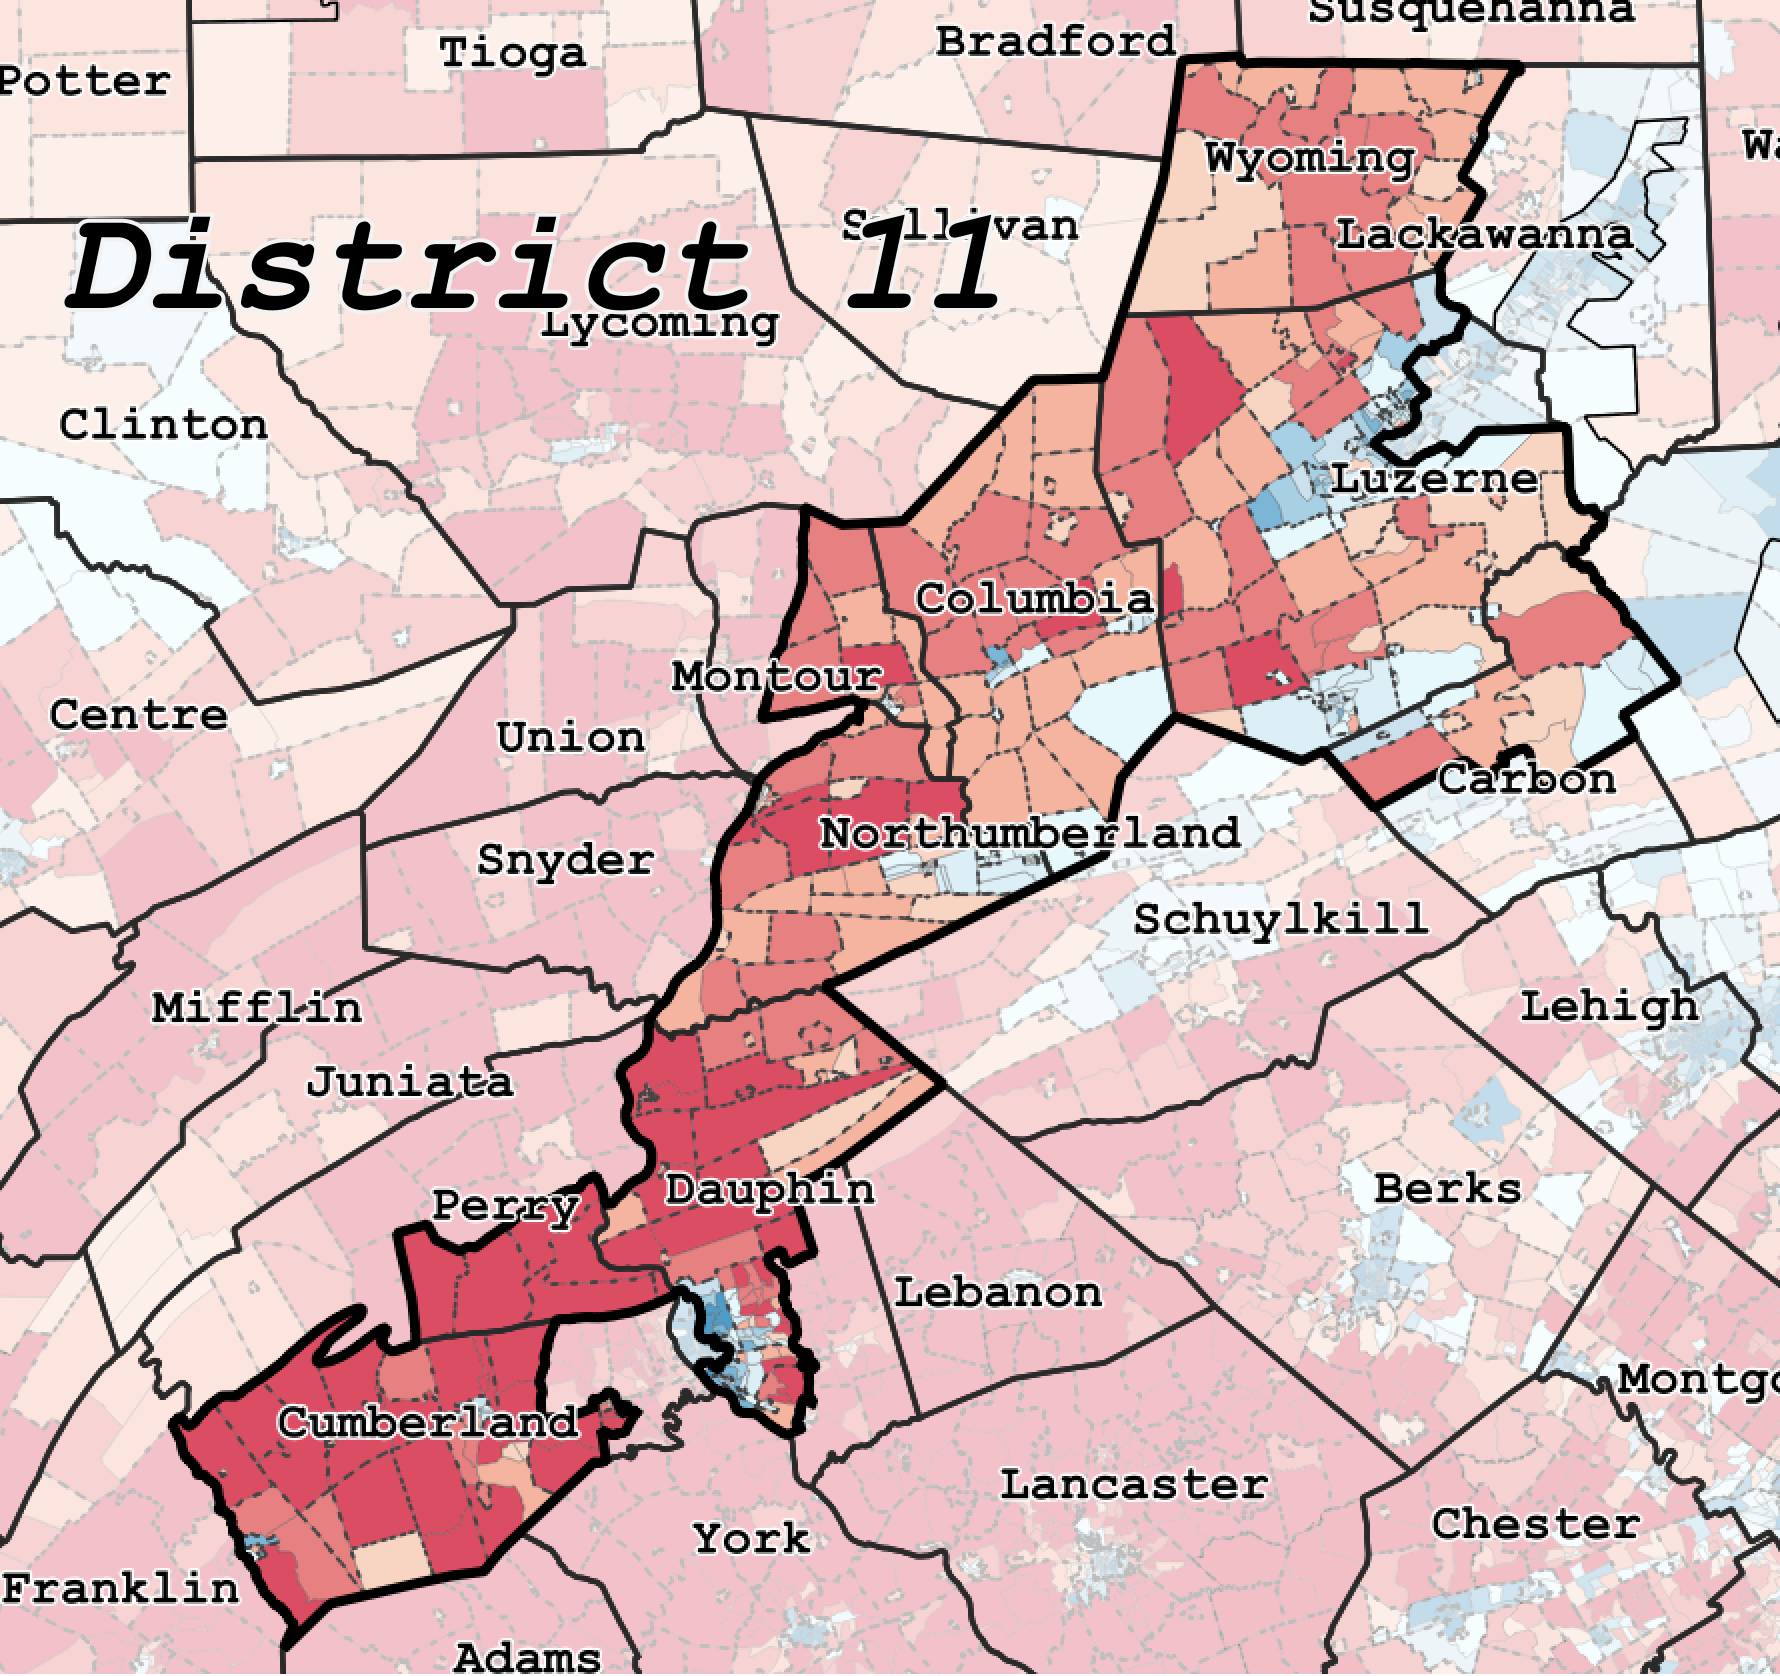
11th Congressional District
The 11th Congressional district extends from Wyoming County in Northeastern Pennsylvania to Cumberland County in South Central Pennsylvania. The district, while containing some Democratic areas in Luzerne county, is a result of packing Democratic voters into the nearby 17th district and cracking Democratic voters in the Harrisburg area. To maintain a Republican edge, the district was extended all the way to Perry and Cumberland County in the south central portion of the state in the last round of redistricting.
12th Congressional District

12th Congressional District Partisan Vote Share
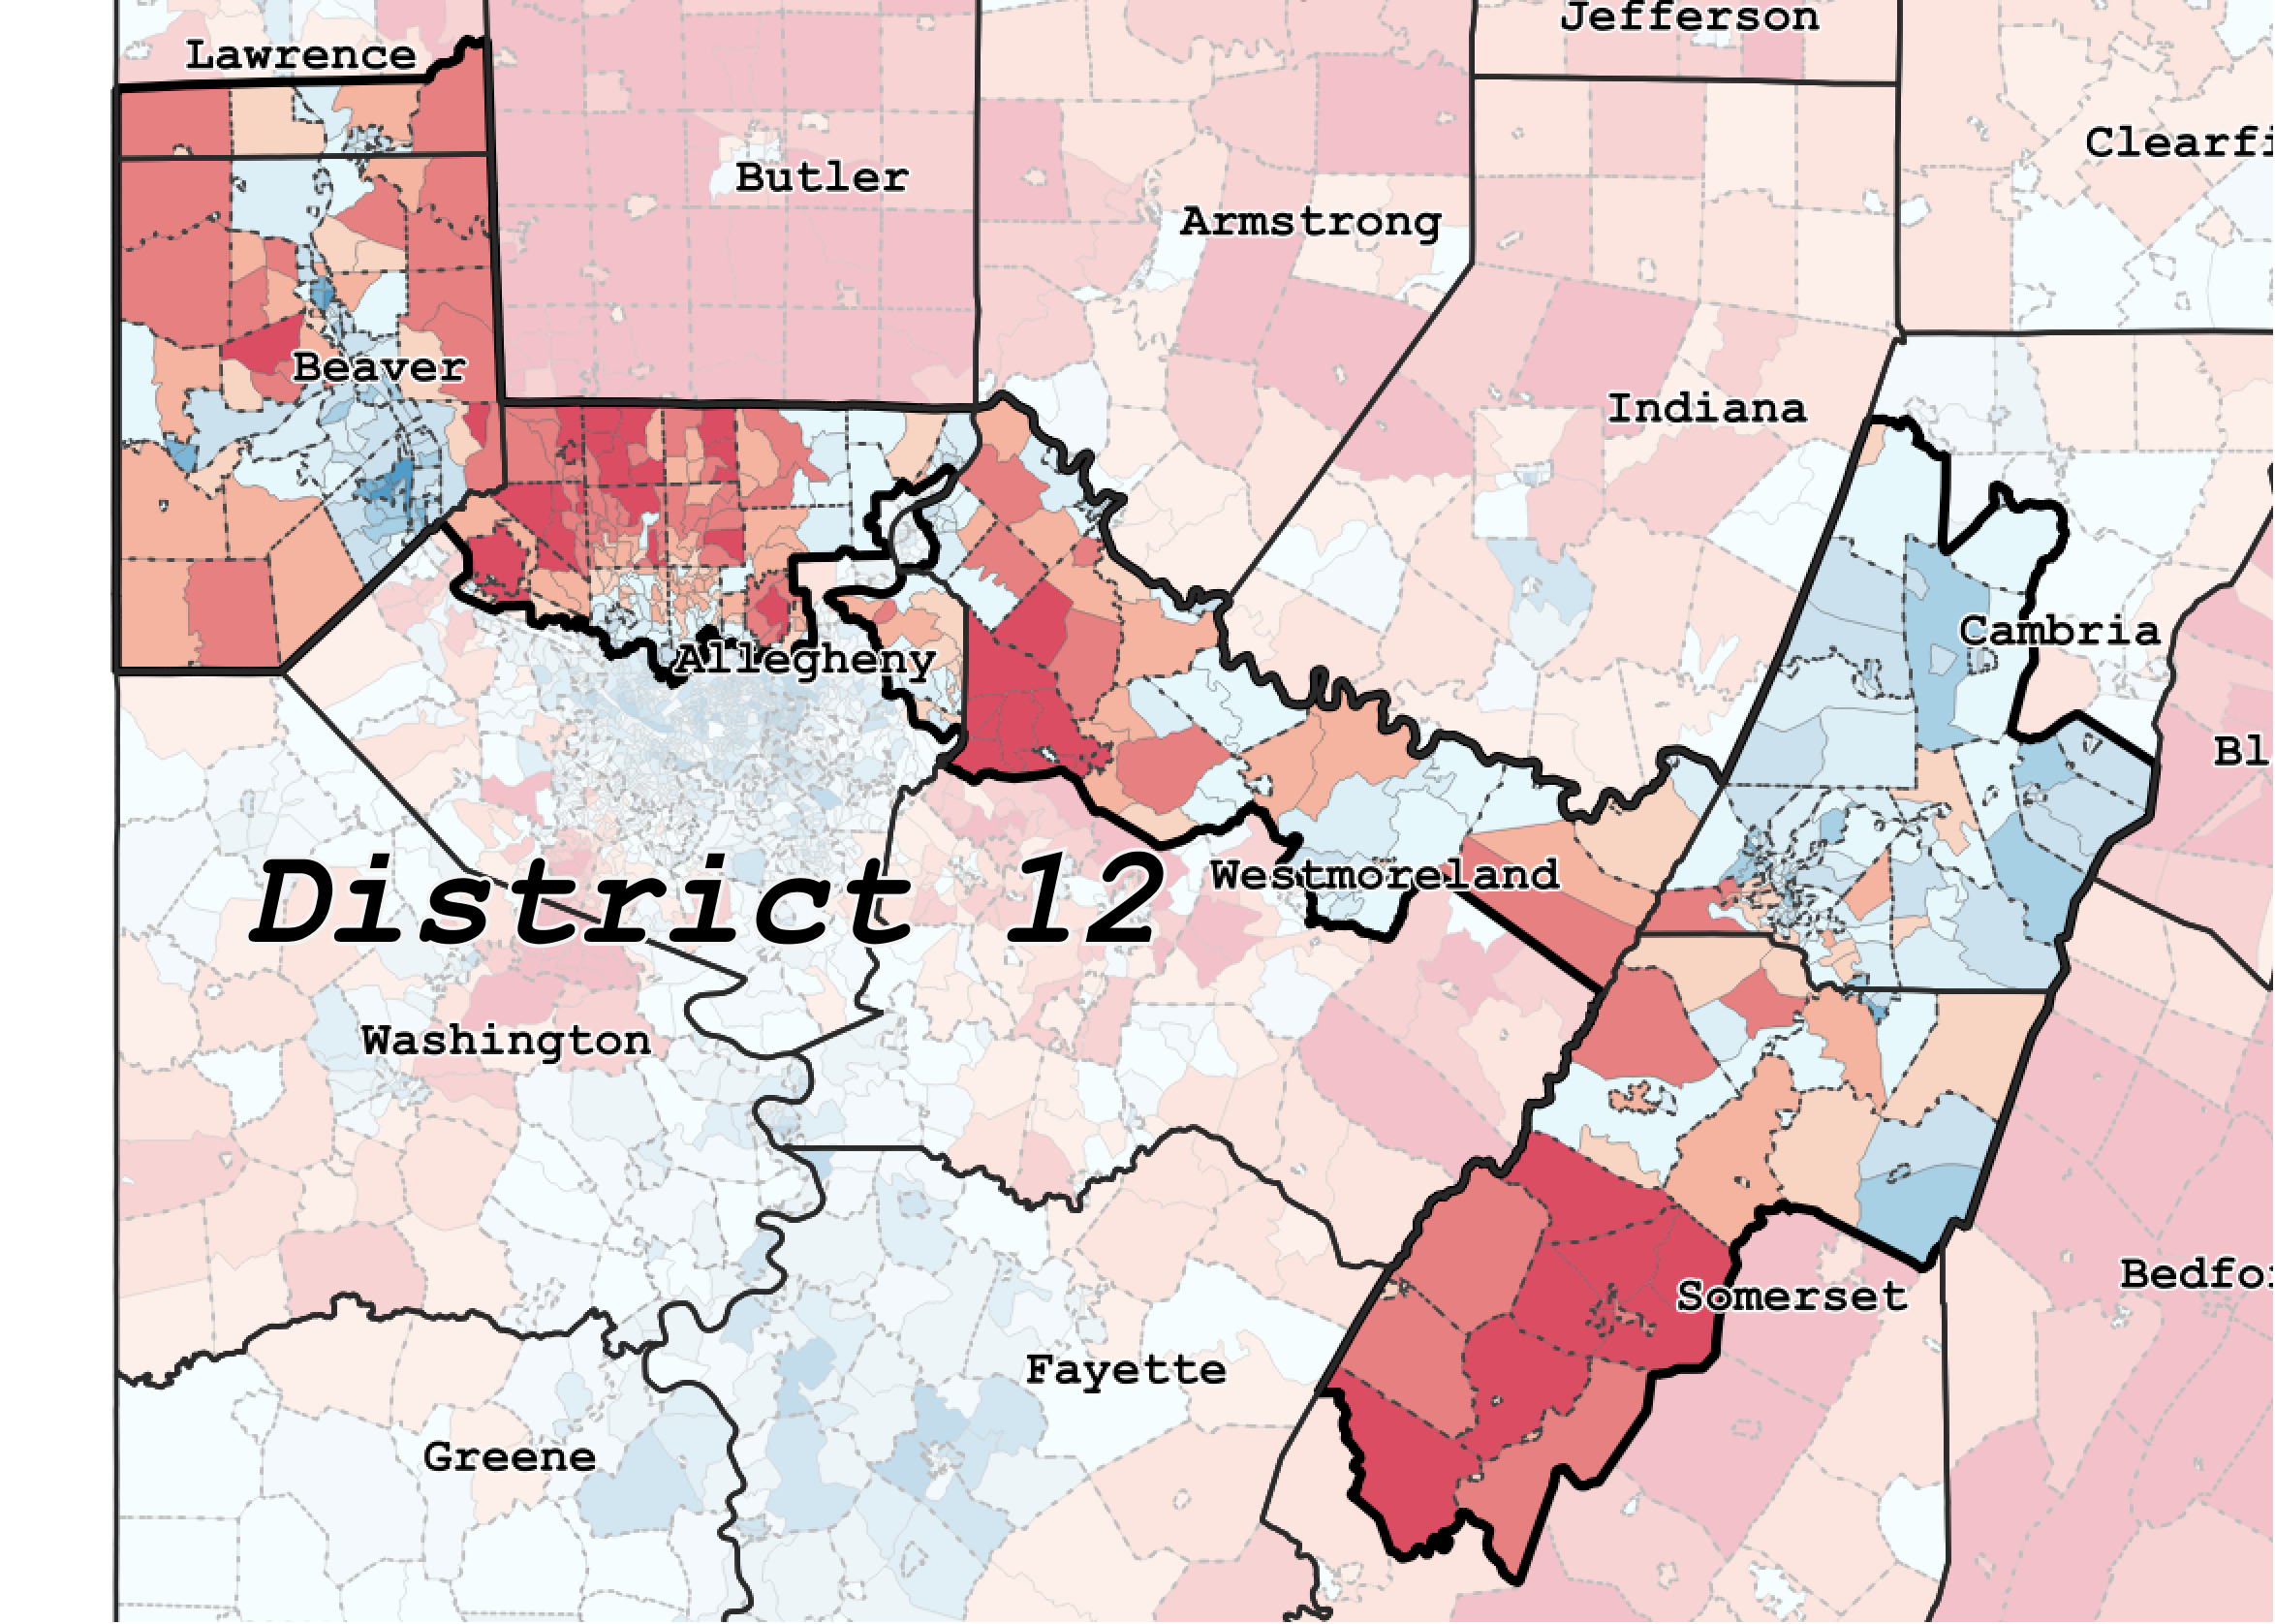
12th Congressional District
The 12th Congressional district extends from Beaver county, through Pittsburgh’s northern suburbs, across northern Westmoreland County, and into Cambria and Somerset County. The district is drawn to minimize the influence of Democratic voters in Cambria County, traditionally the base of this district, by adding large portions of Republican leaning Somerset County to the district. The previous version of the district combined Democratic areas in the Monongahela Valley and Cambria County together which was a district more favorable to Democrats. The district was redrawn to crack these Democratic constituencies into separate districts to minimize their influence.
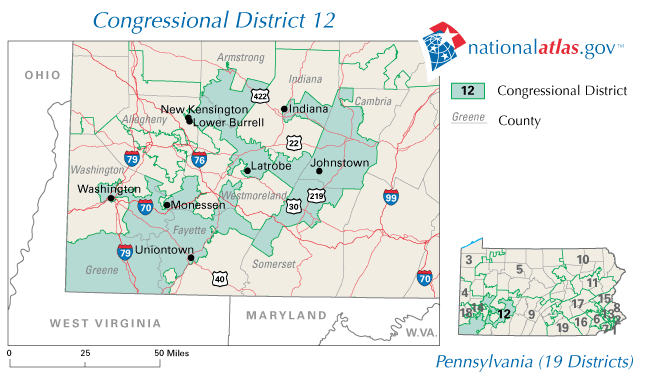
12th Congressional District (2004-2013)
Note that in the previous version of the district, it was gerrymandered to pack Democrats in the Monongahela Valley (now in the 9th district) as well as Cambria county in the same district. The Turzai production dataset contained a point shapefile with the location of incumbent homes. Because Pennsylvania had to lose one seat as a result of reapportionment, two incumbents would have to be combined into the same district. In practice this occurred when the 2001 4th and 12th Districts were combined into a 2011 12th District with Mark Critz and Jason Altmire. The 12th District’s odd shape – with two masses on either end, include both Altmire and Critz’s home, as well as heavily Republican territory in the middle, making the combined district a Republican performing seat.
13th Congressional District
13th Congressional District Partisan Vote Share
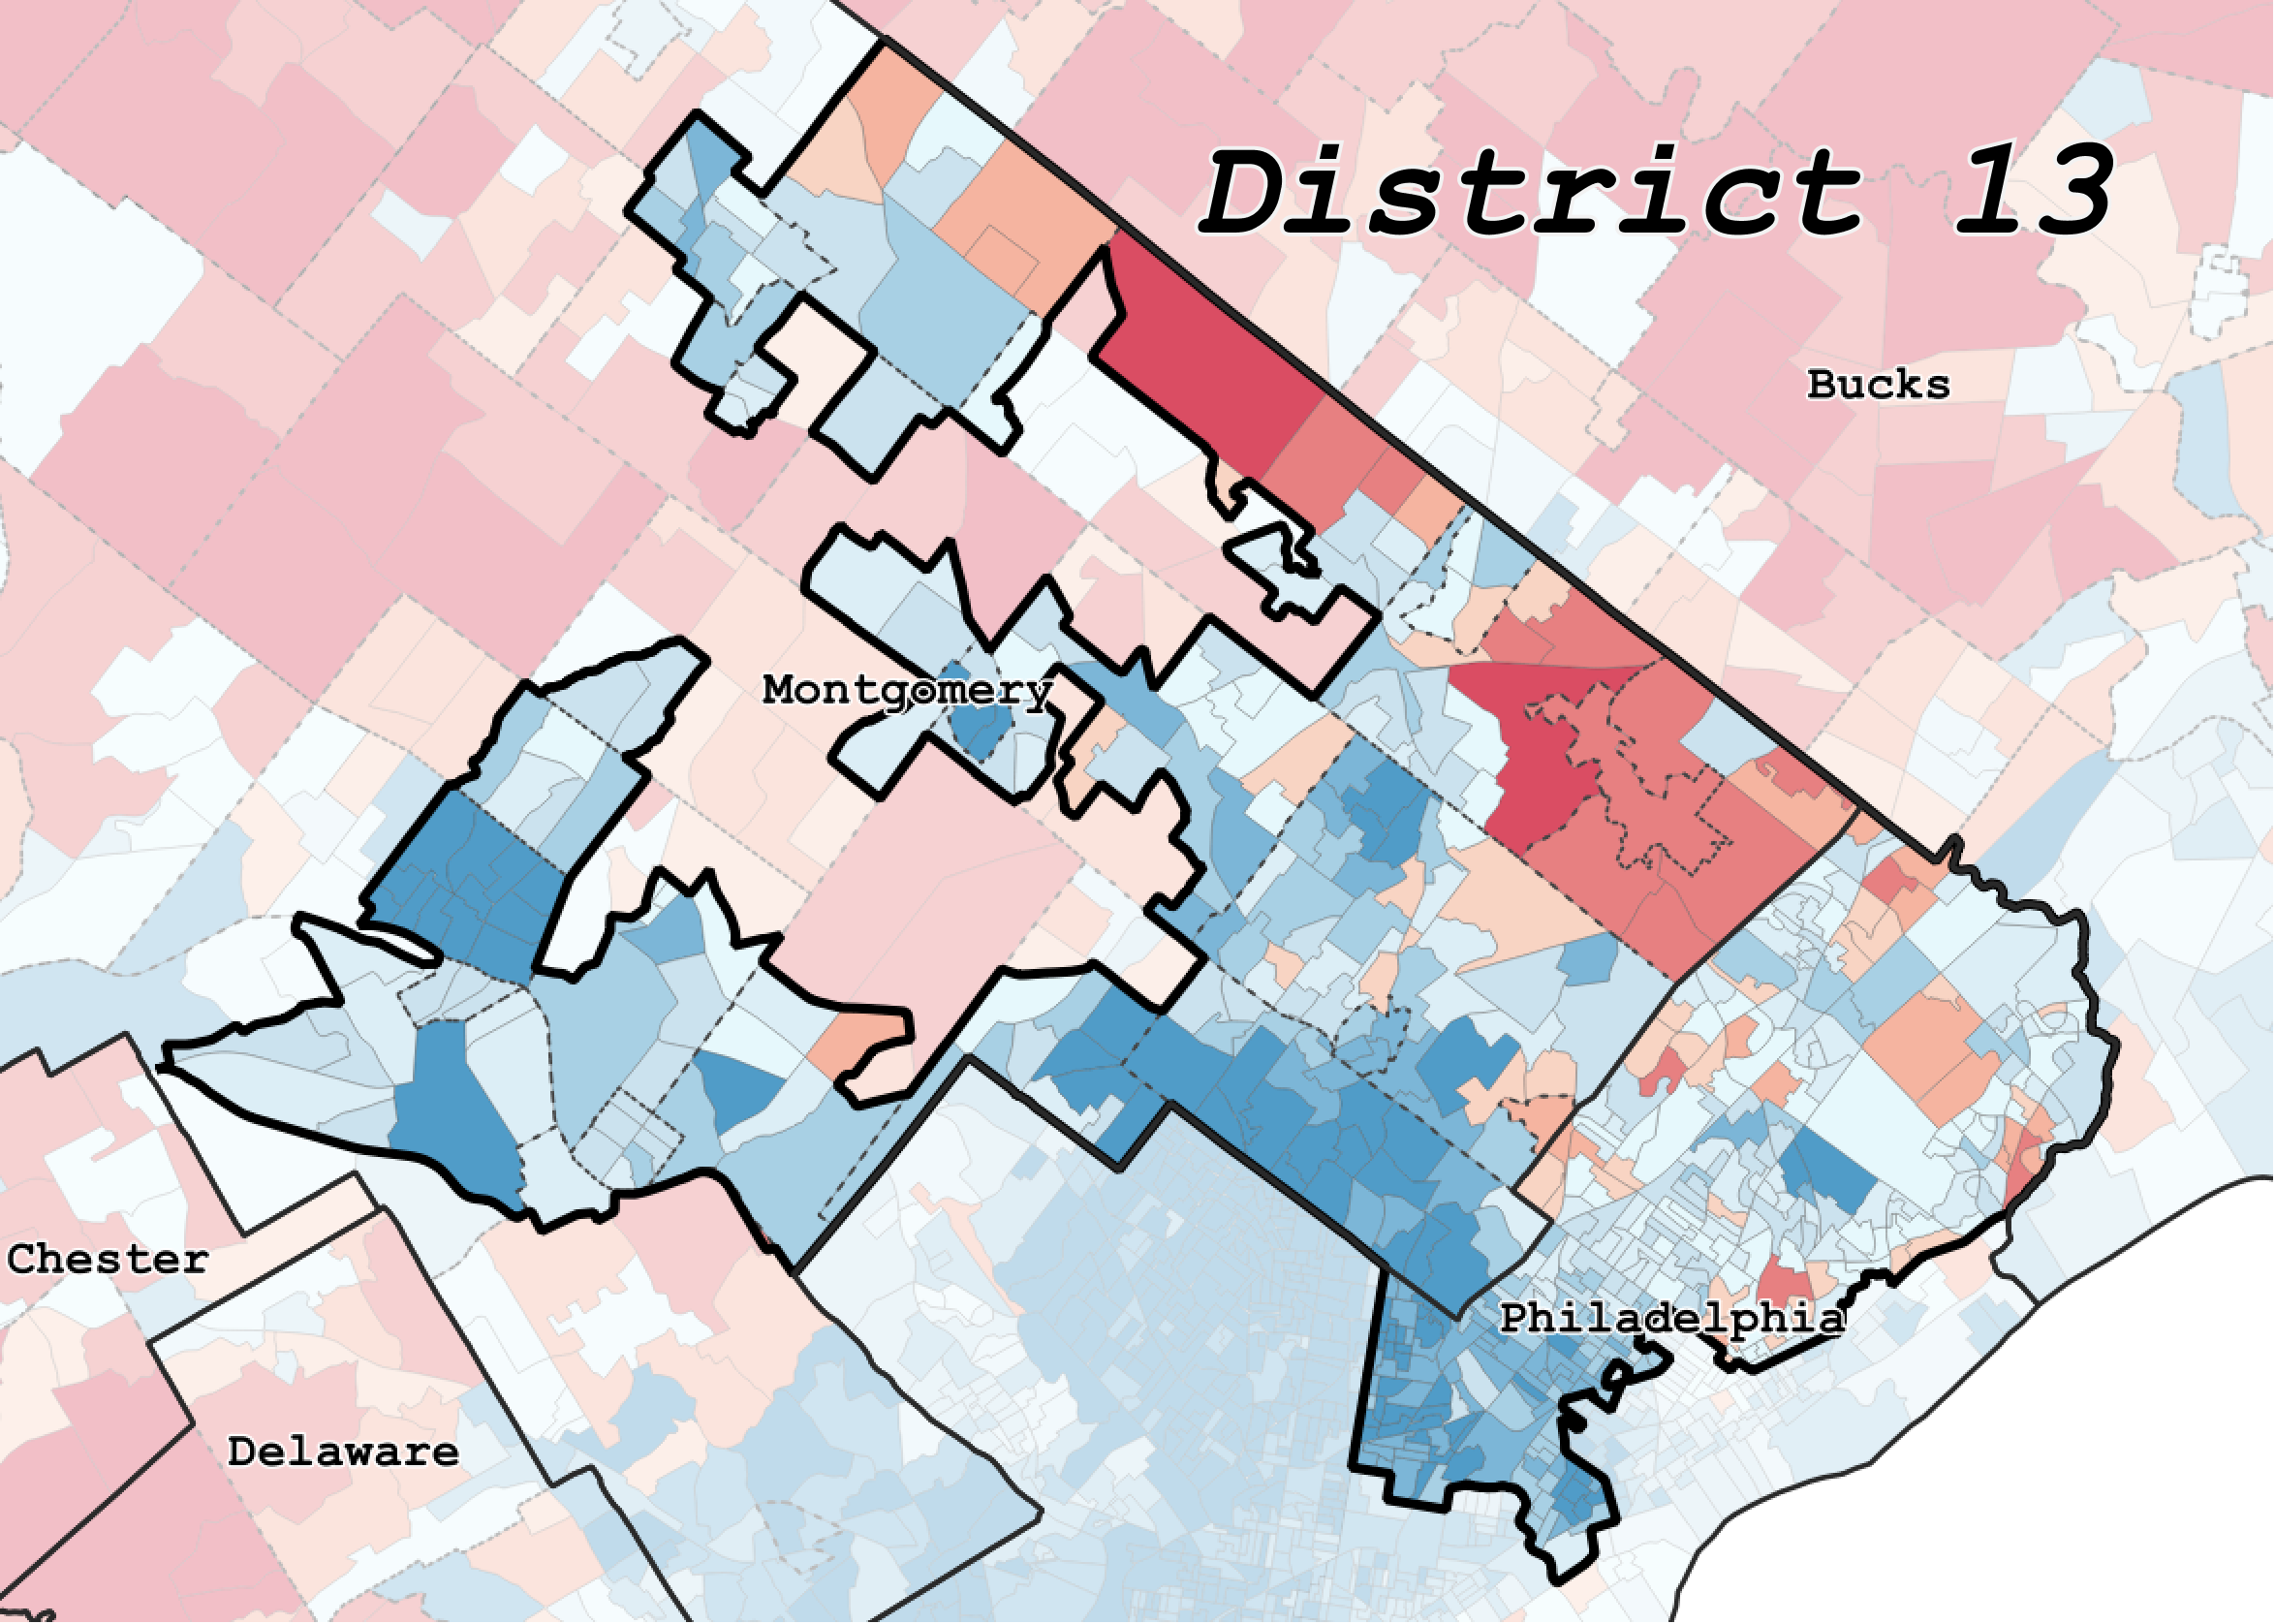
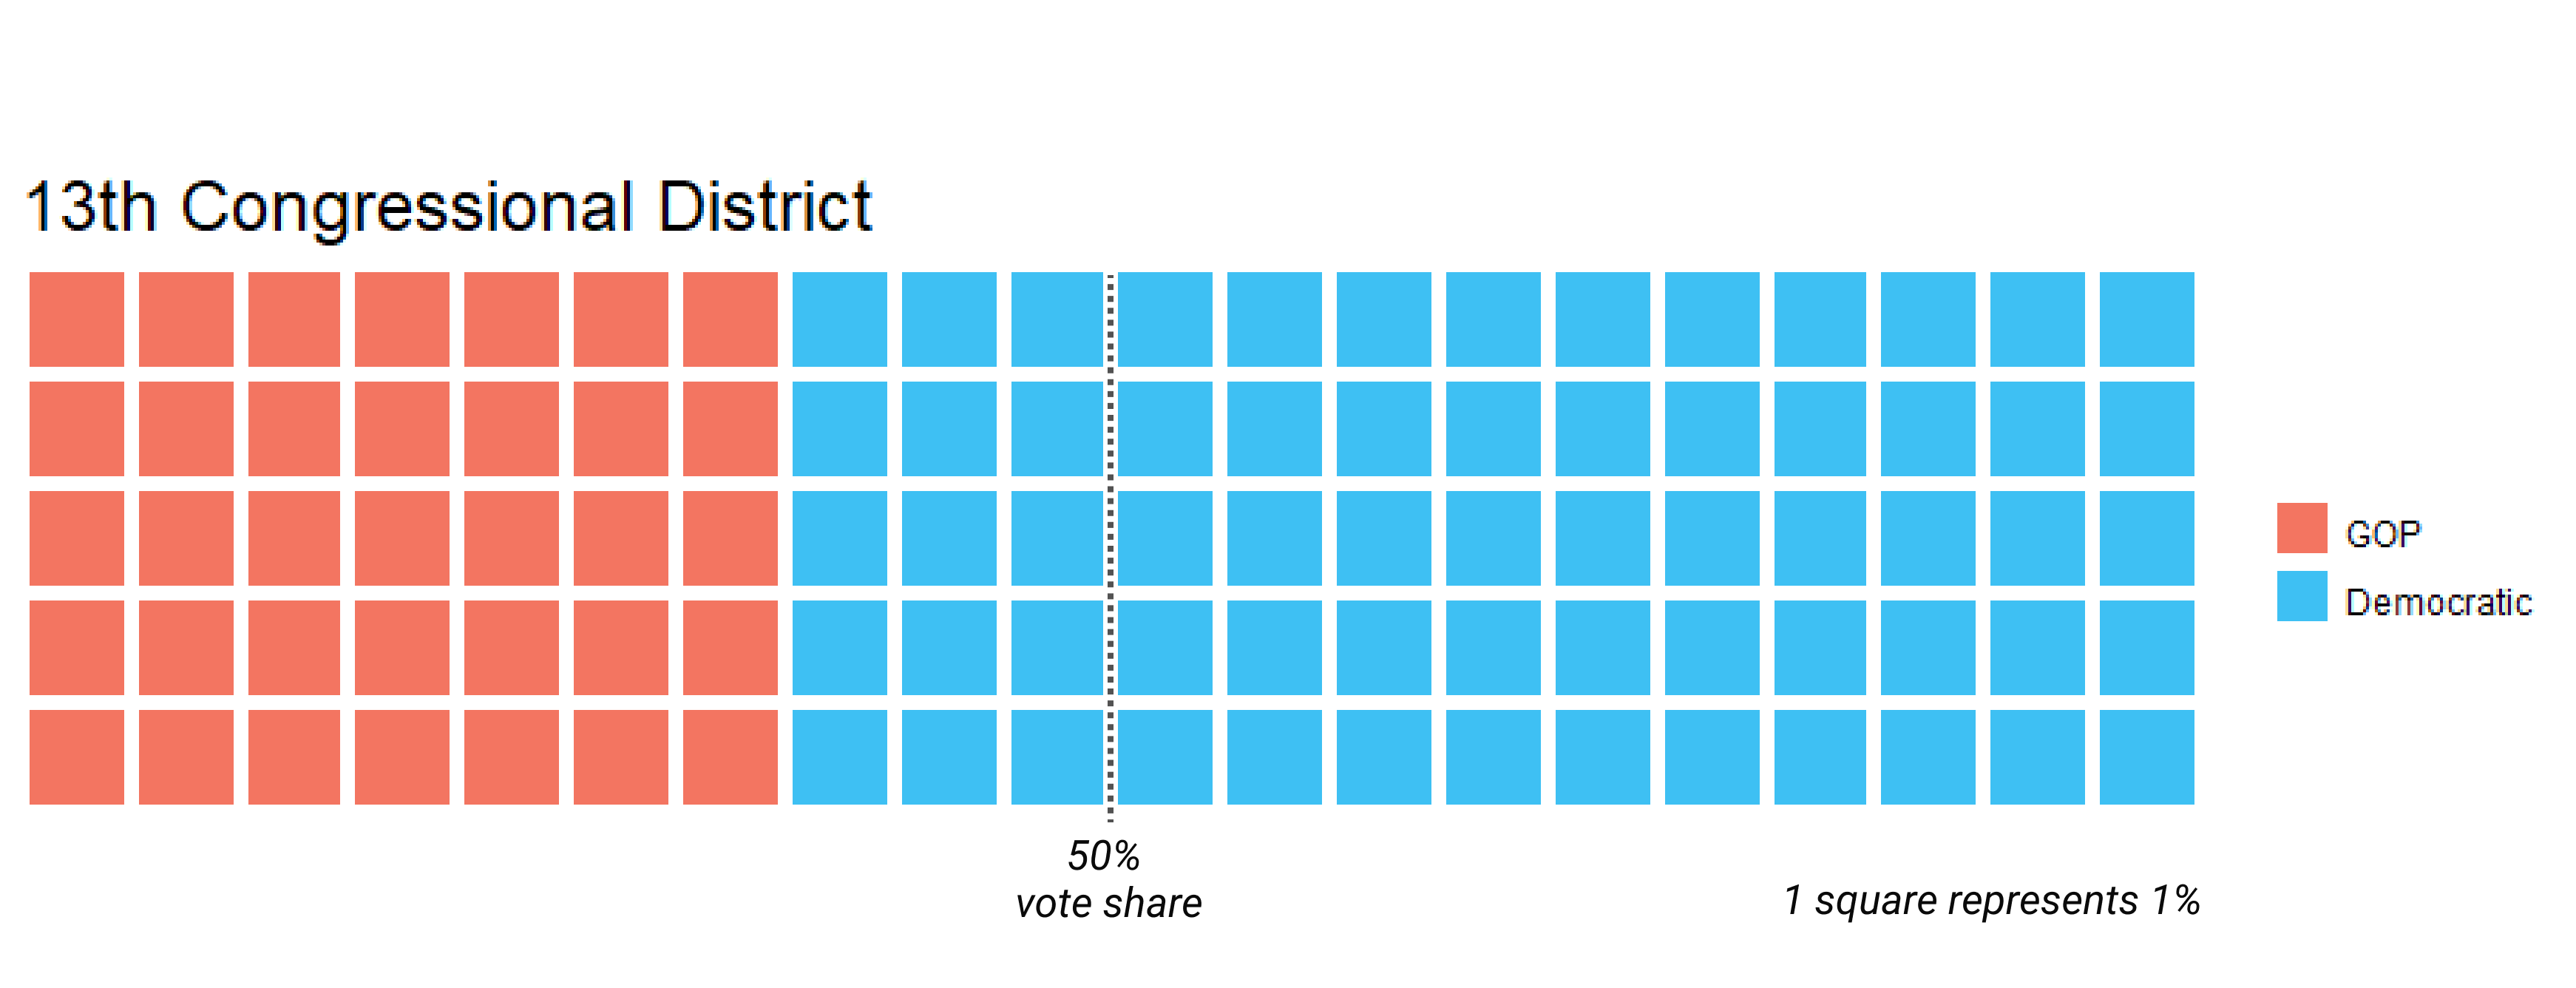
13th Congressional District
The 13th Congressional district is an example of packing to creating a super-Democratic district encompassing part of Philadelphia, as well as its immediate northern and northwestern suburbs. It is closely tied to the gerrymandering of the 7th district in that Democratic areas appear to be deliberately packed into the 13th so that they are not influencing the 7th district. The bulk of the 13th district is centered over northern Philadelphia and southeastern Montgomery County, then its three appendages that branch northwest from there. The northern branch extends along the border of Montgomery and Bucks County to pick up the Democratic pocket of Lansdale borough. The middle branch extends westward to pick up the Democratic areas of Upper Dublin township and Ambler borough. And the southern extension crawls up the Schuylkill valley to capture Democratic voters in Conshohocken, Norristown and Upper Merion township. East Norriton Township, Whitpain Township, Plymouth Township, Whitemarsh Township, Springfield Township, Upper Dublin Township, and Upper Gwynedd Township all split along partisan lines. There is no credible reason why these municipalities would be split except for partisan reasons.
15th Congressional District
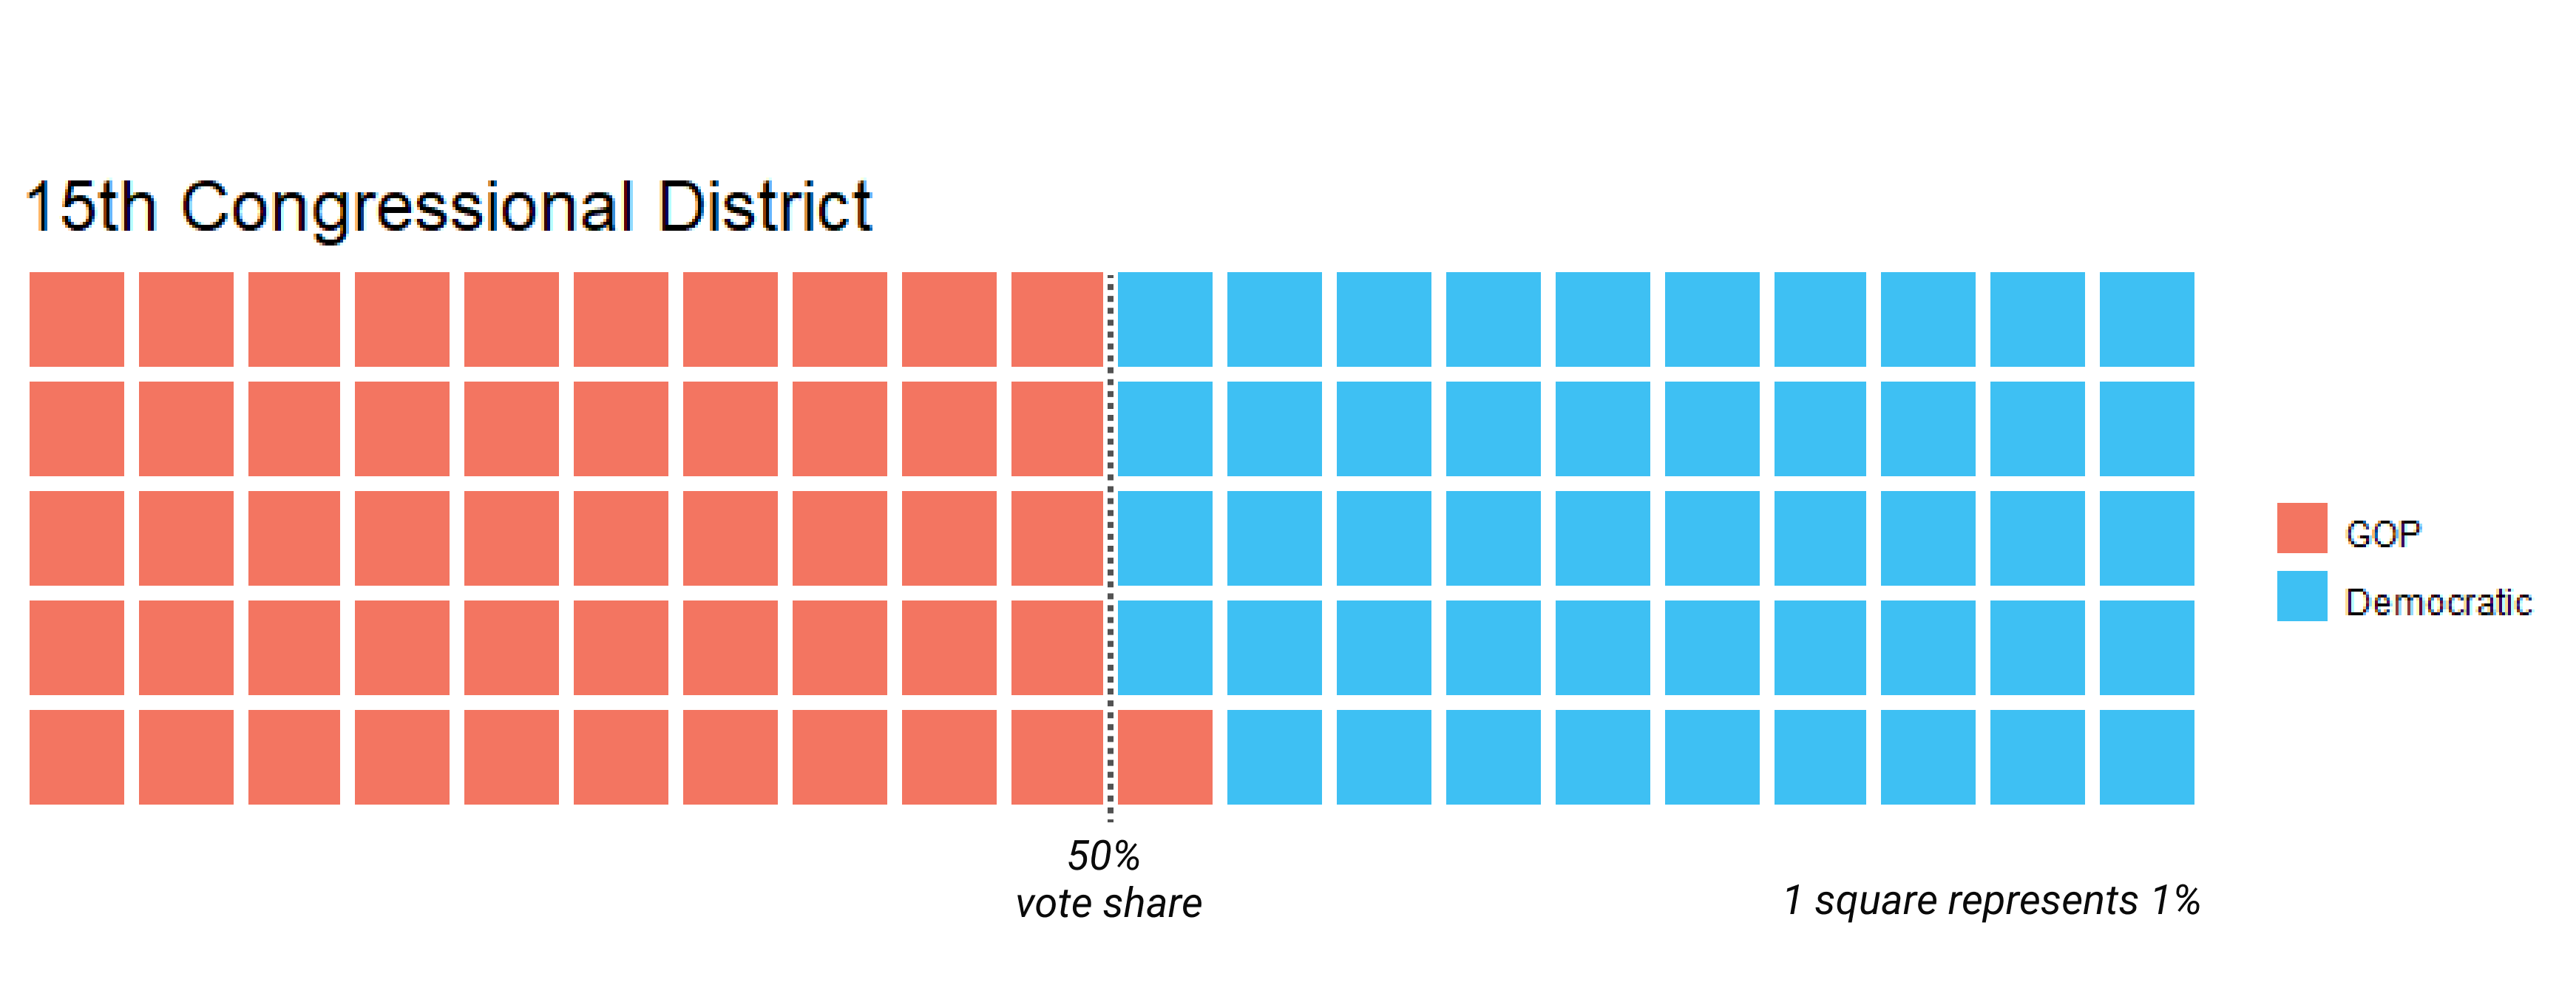
15th Congressional District Partisan Vote Share

15th Congressional District
The 15th Congressional district maintains a slight Republican edge by cracking the Democratic city of Bethlehem and reducing the growing Democratic influences of the Lehigh Valley by adding in heavily Republican territory in northwestern Berks, Lebanon and Dauphin County.
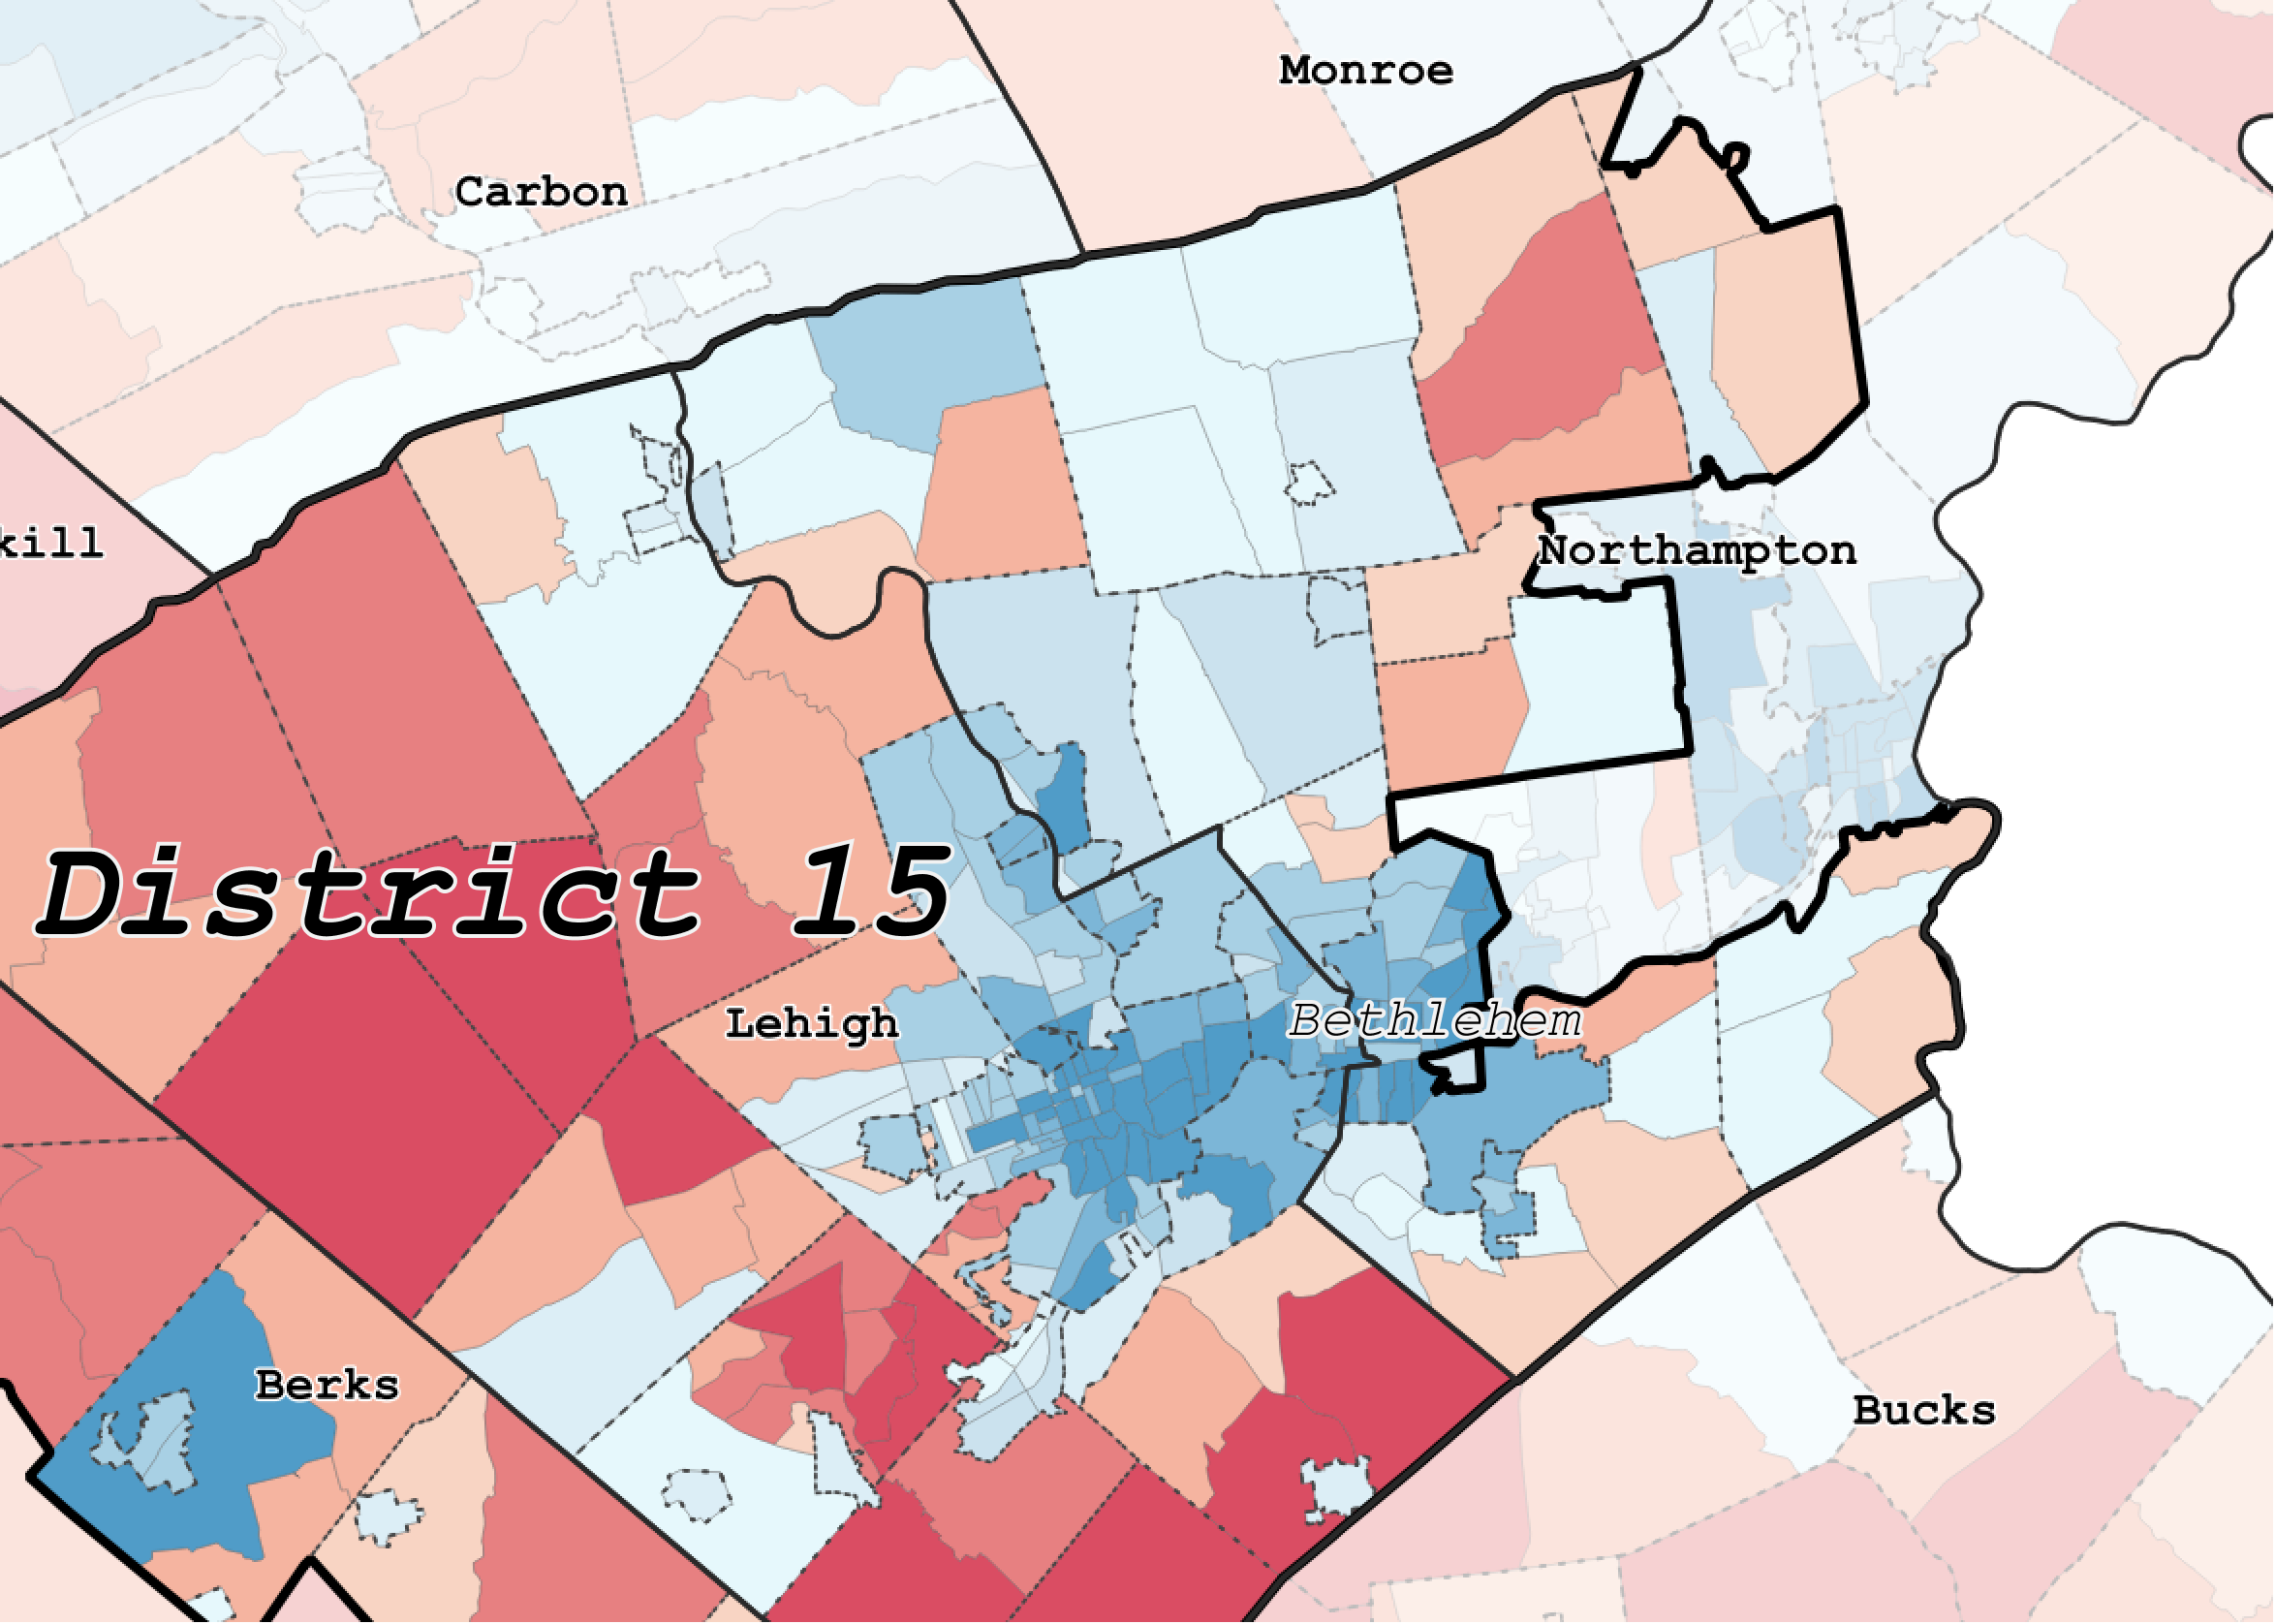
15th Congressional District splits Bethlehem
16th Congressional District
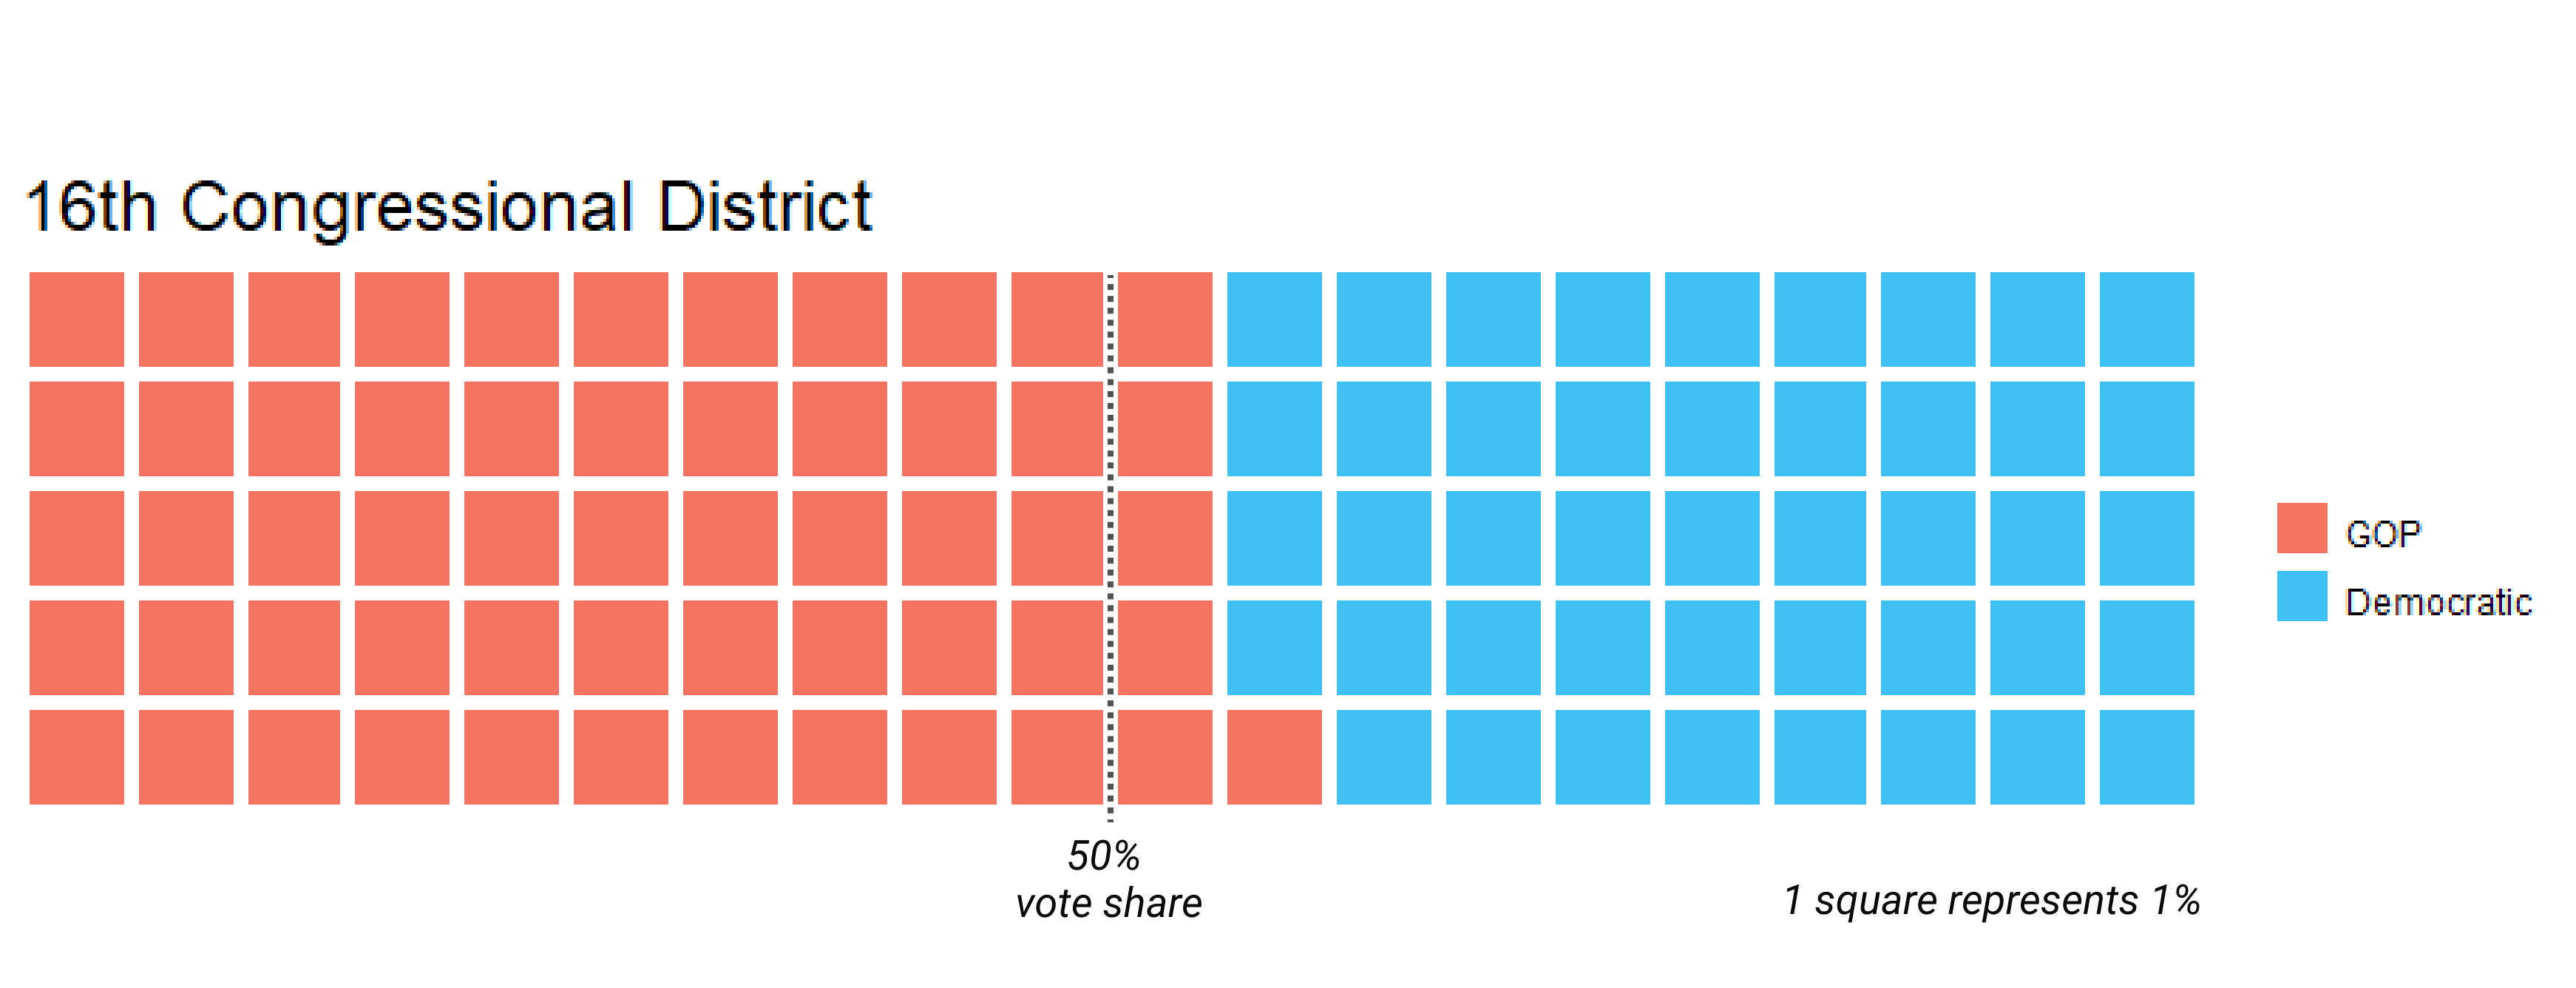
16th Congressional District Partisan Vote Share
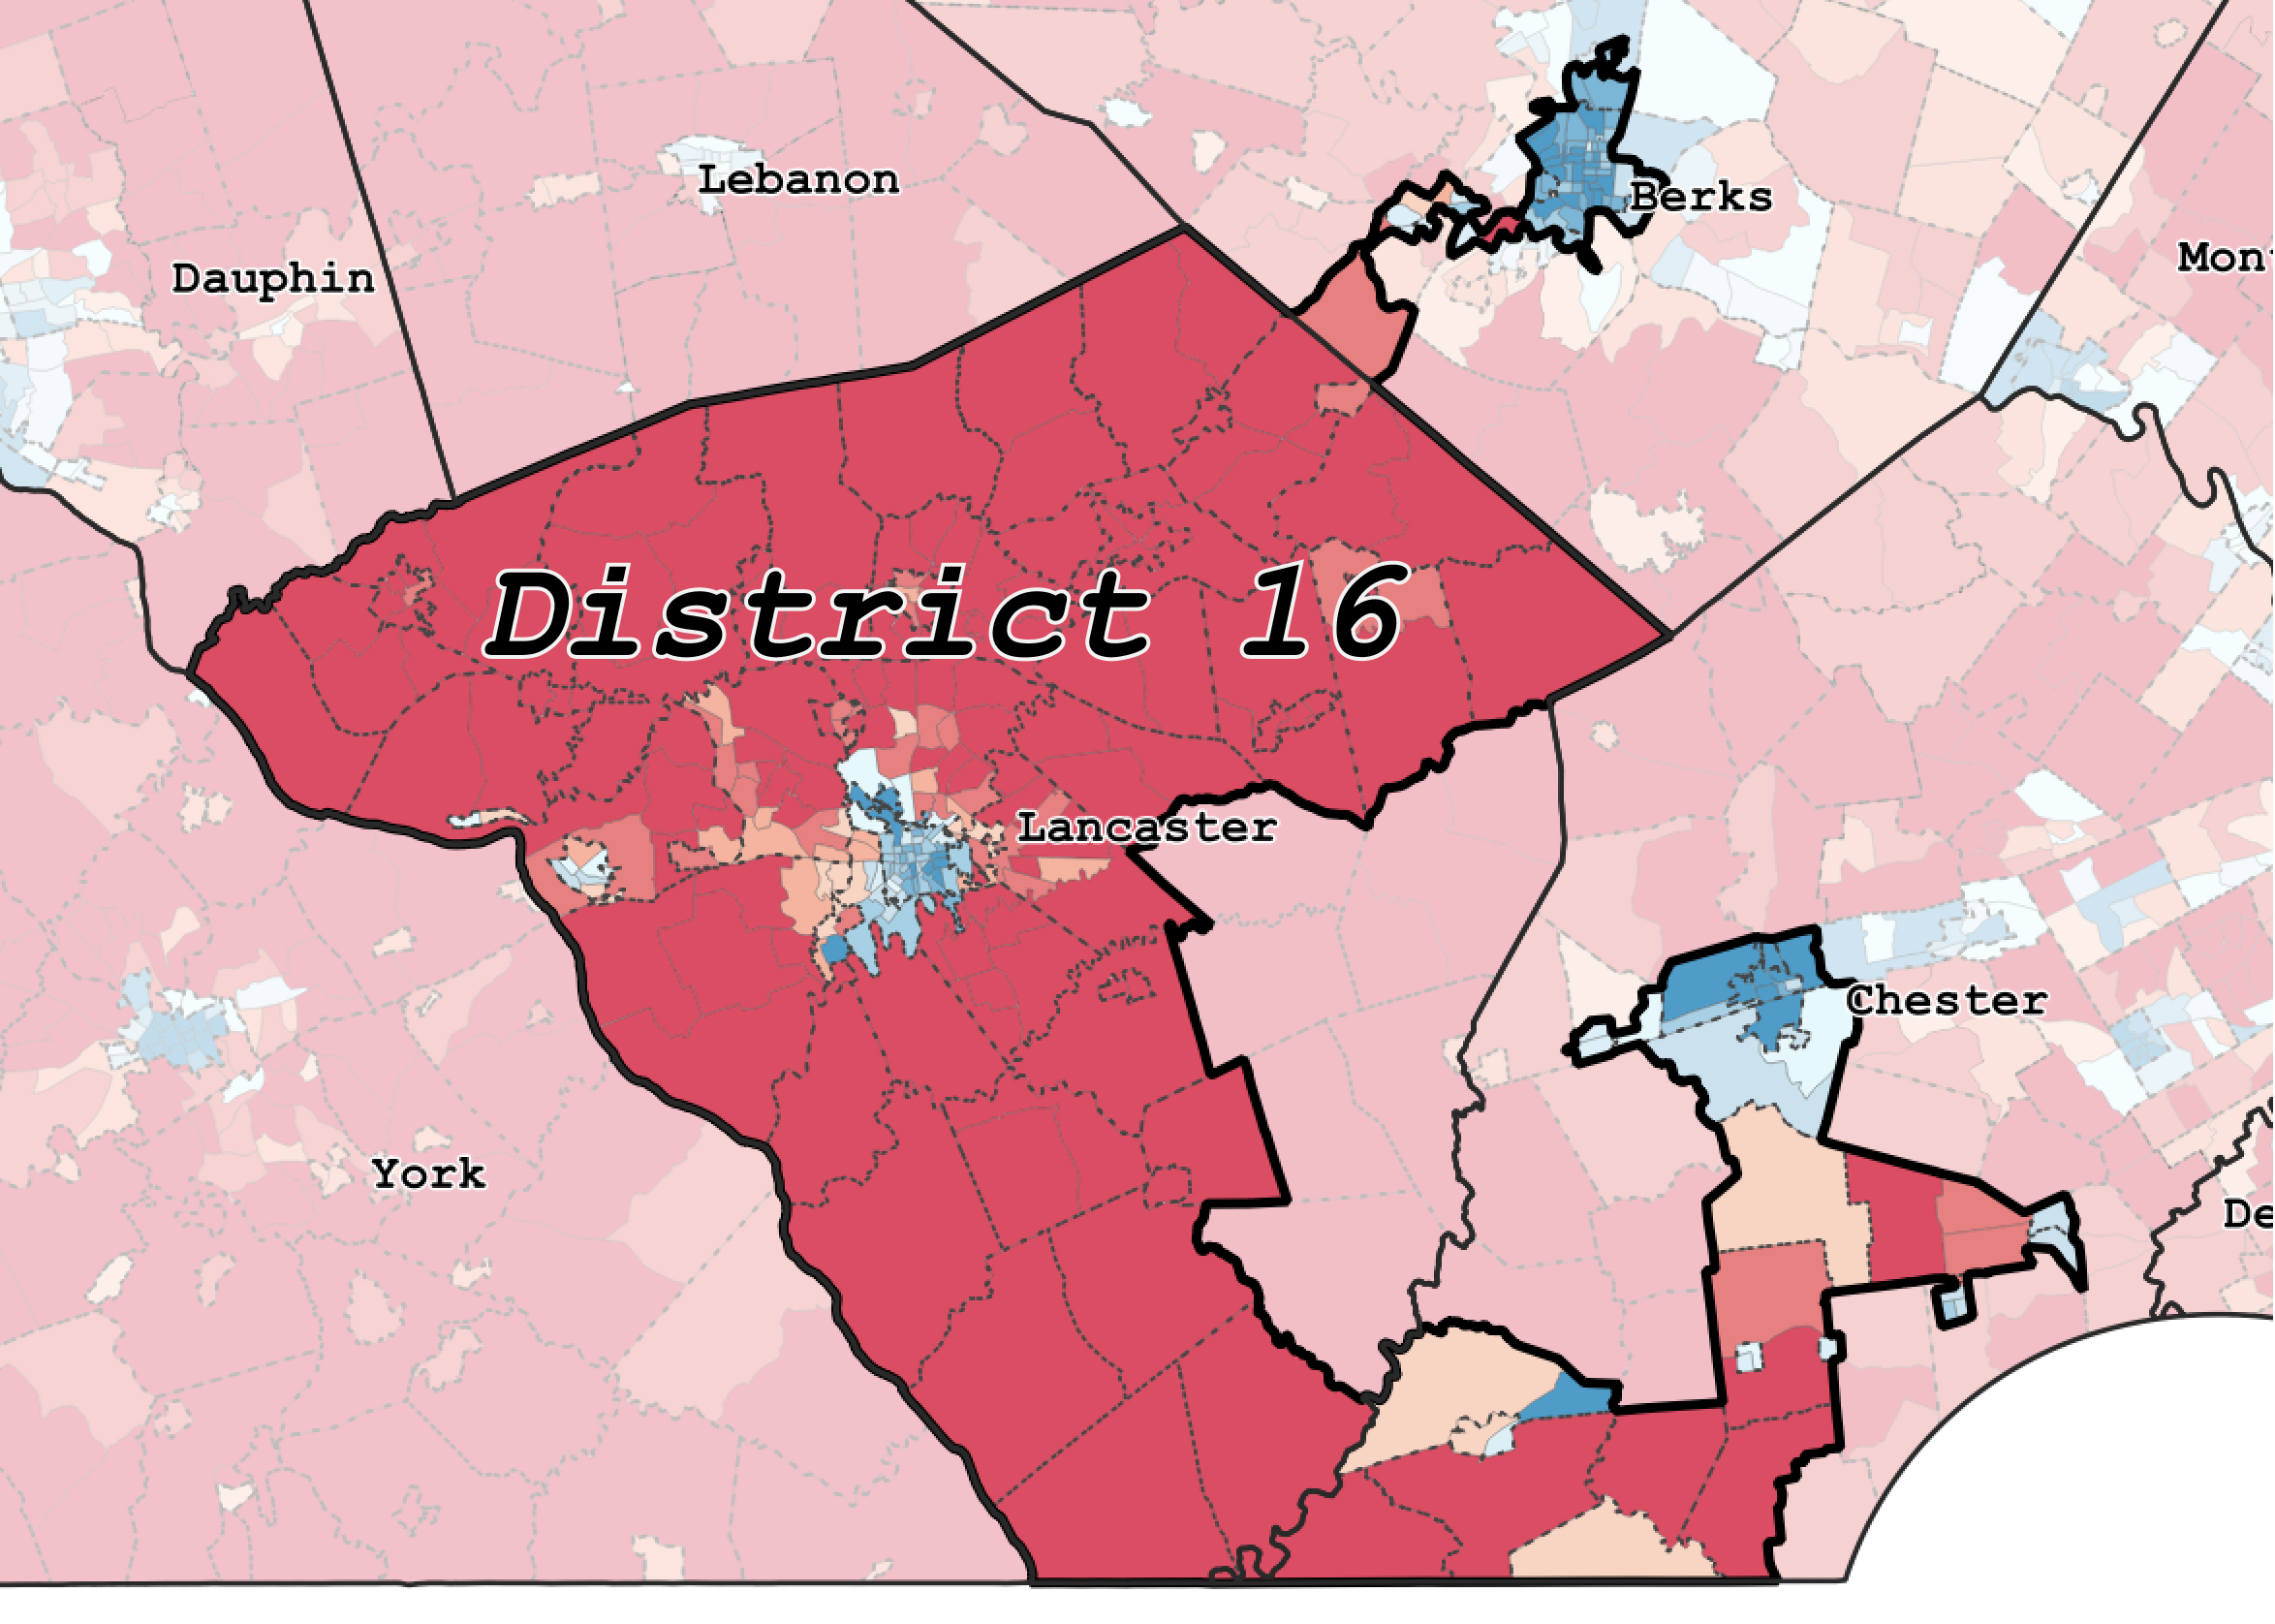
16th Congressional District
The 16th Congressional district boundaries encompasses some of the most heavily Republican voting areas of the state in Lancaster County. Because of that, the district is also drawn to include the heavily Democratic cities of Reading and Coatesville. This minimizes their influence but also keeps them out of the neighboring 6th and 7th. The district follows the boundaries of Lancaster County except to create an appendage only one precinct wide in places to grab Democratic voters in the city of Reading. Those Reading precincts are closer to District 7, but they get attached to Lancaster County. Instead of keeping Lancaster County in a single district, parts of the county were carved out to add Republican voters to District 7.
17th Congressional District

17th Congressional District Partisan Vote Share
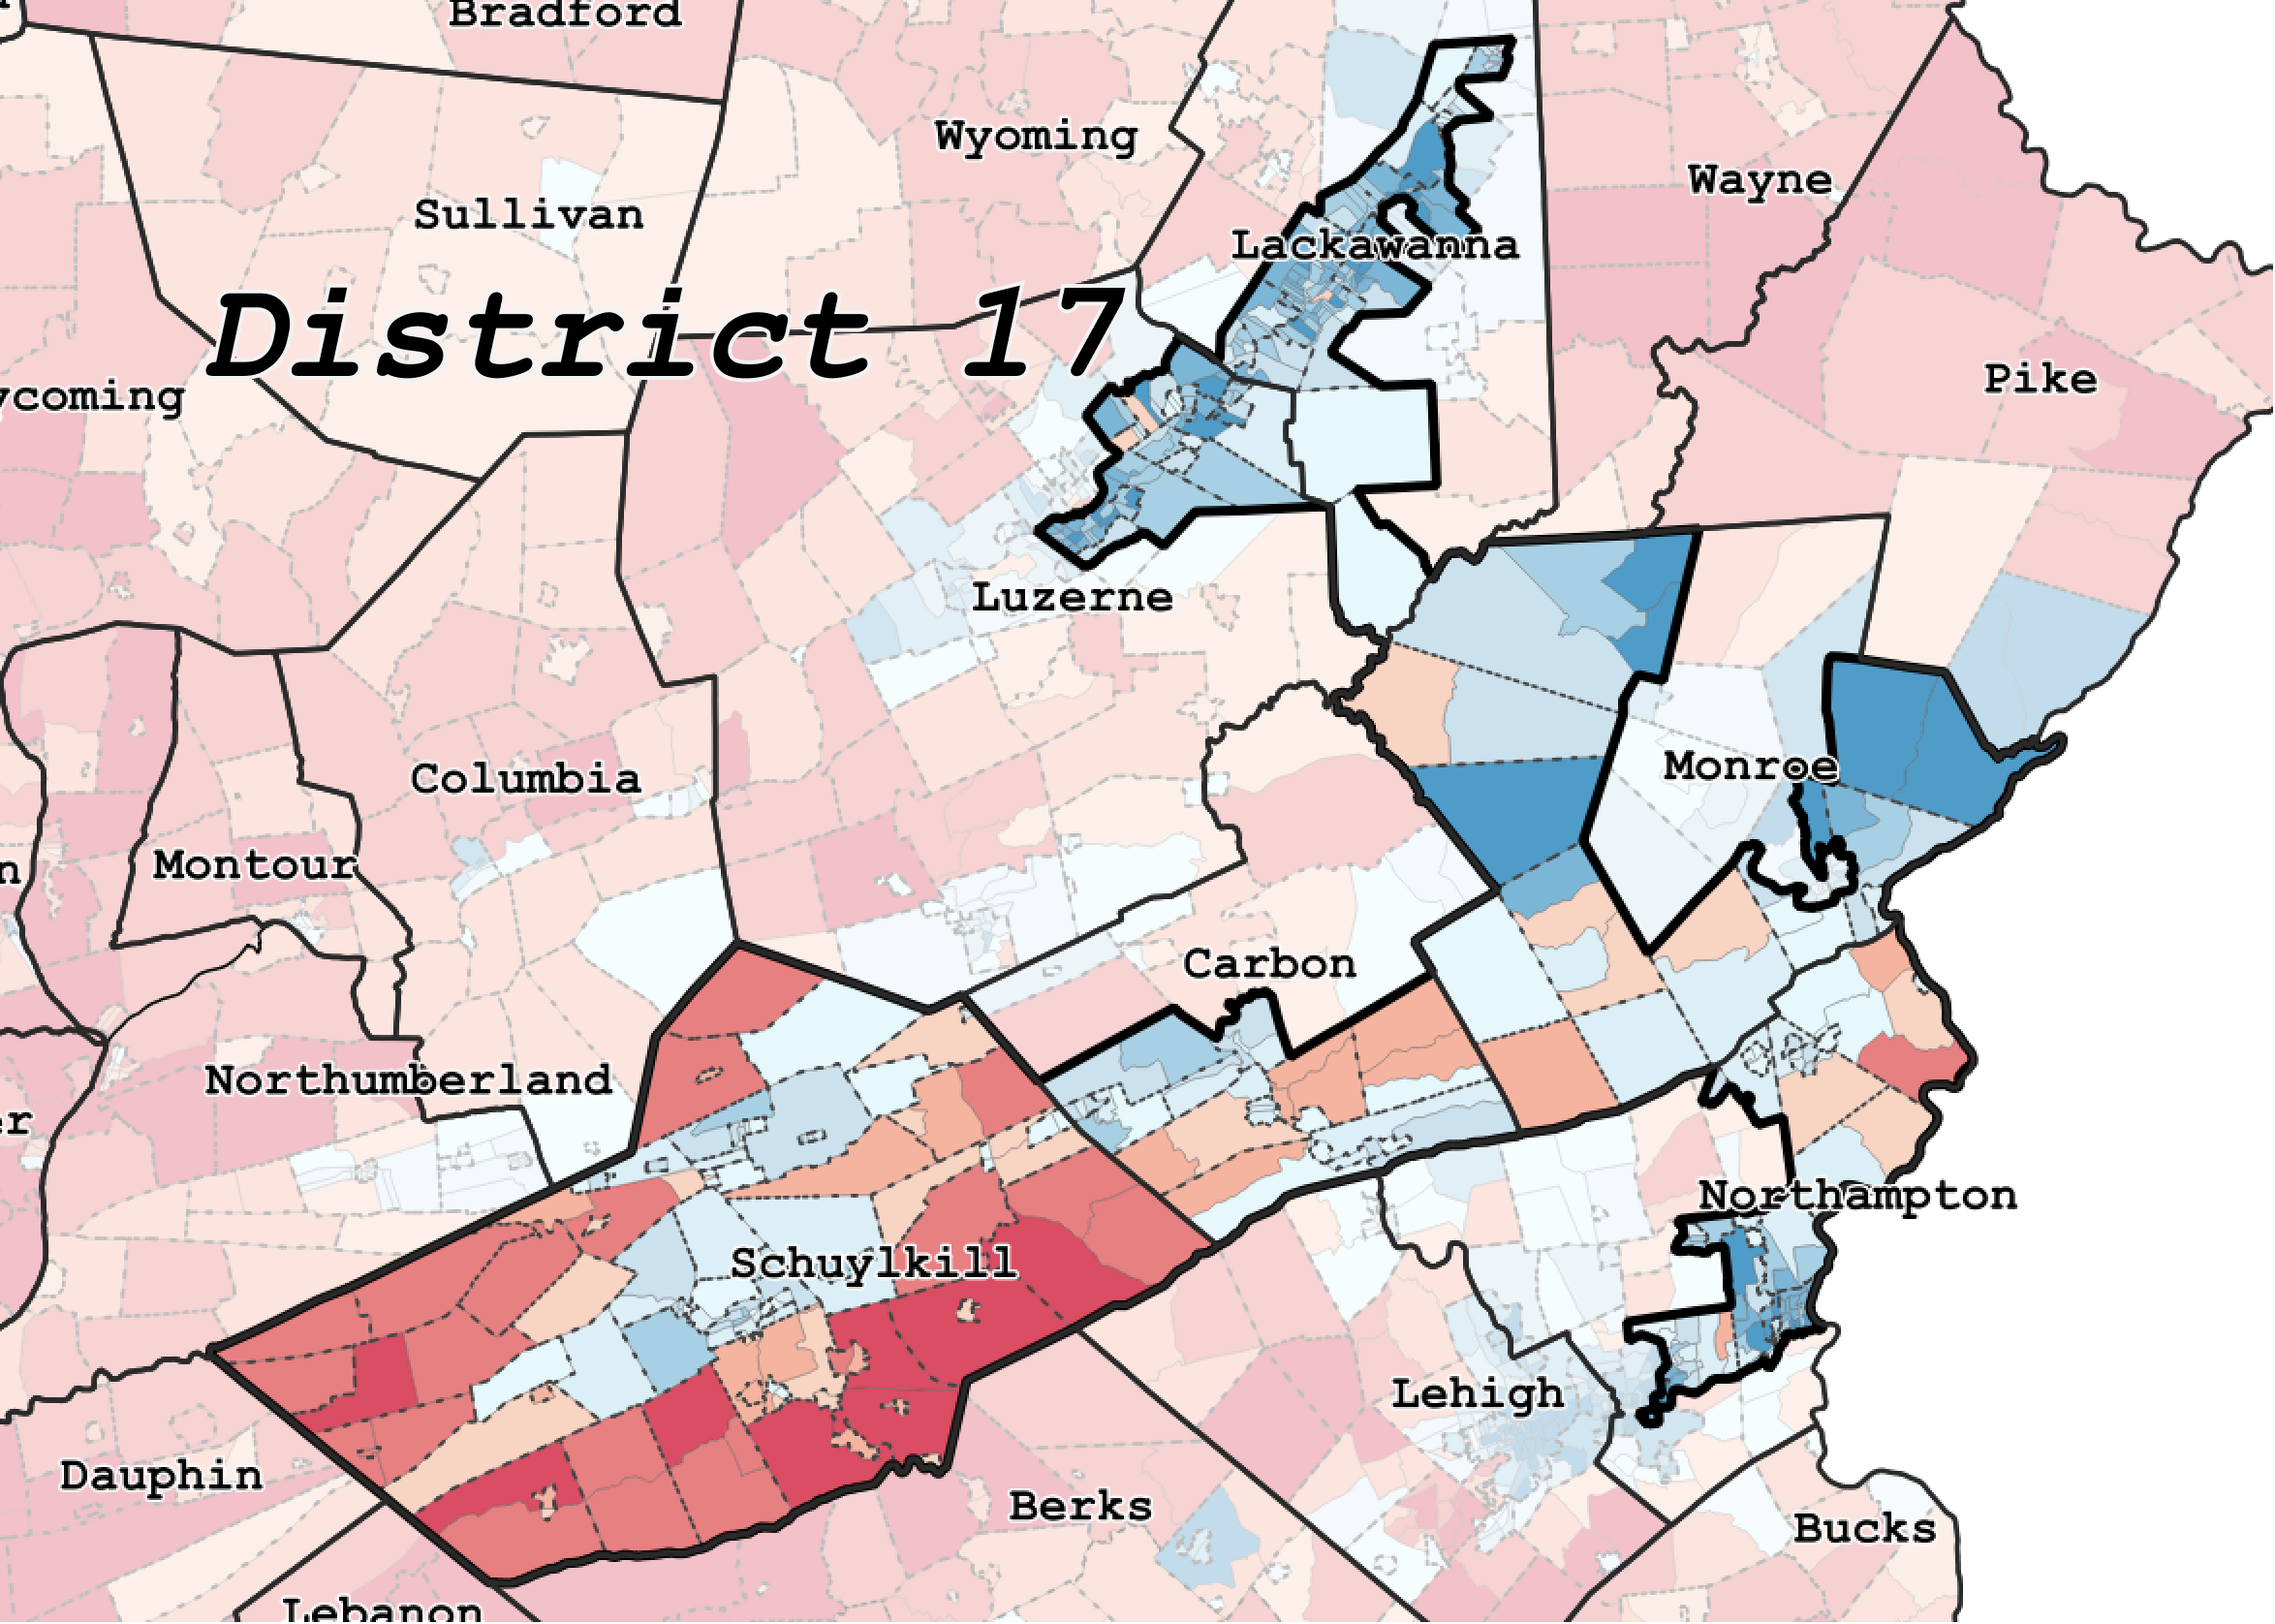
17th Congressional District
The 17th Congressional district is meant to pick up Democratic voters in the Scranton and Wilkes-Barre area and connect them with the original base of the district, Schuylkill County. It connects the Democratic voting urban areas of Scranton and Wilkes-Barre, captured in a northern reaching appendage, with generally Republican regions to the south. Connecting the Democratic areas in the north with a district that mostly encompasses areas farther south packs away those Democratic voters from influencing potential districts drawn in the state’s northeast.
Pennsylvania’s districts are a partisan gerrymander
Looking at each district’s distortions, with underlying partisan performance data, indicates it is clear there was partisan motive behind the way the lines were drawn and precincts and blocks allocated. Furthermore, if partisan data was not a consideration, then it would not have been necessary to disaggregate partisan data down to the Census Block level. Because of this partisan motive, the map split communities and jurisdictions unnecessarily to achieve a maximum number of Republicans elected in the Congressional delegation. This is most notable in the southeastern Pennsylvania districts where Democrats are packed into the 1st, 2nd and 13th district – while being deliberately kept out of the neighboring 6th, 7th and 15th. Moving west, the 16th is an example of packing two extremes on opposite ends of the partisan spectrum together, by combining heavily Republican areas with heavily Democratic areas, but keeping the advantage to the Republicans. This also has the side effect of keeping Democratic centers out of the neighboring 6th, 7th and 15th. The 2011 Pennsylvania Congressional Districts represent a partisan gerrymander through the clear partisan intent of the mapmaking.
Though the case Agre v Wolf was not decided in favor of plaintiffs, Senior U.S. District Court Judge Michael Baylson authored an impressive and detailed dissent, arguing that gerrymandering is a “major public policy issue”. In his dissent, Baylson points out that while the Supreme Court has not ruled on the justiciability of gerrymandering under the Elections Clause, they have enforced precedent for “traditional” and “neutral” redistricting practices. And he believes the plan violates those practices.
Regardless of the outcome of Agre, Pennsylvania’s Congressional districts will be redrawn for the 2018 election, due to the state Supreme Court decision. And it is clear that legislature-drawn maps, without a public process or standards, are prone to gerrymandering. It is important to note that not just Republicans are culpable, as Democrats in Maryland and Illinois have also been accused of gerrymandering when they are in charge.
What’s next
The future of partisan gerrymandering is expected to be determined this summer by the U.S. Supreme Court. I believe that, despite the Supreme Court’s inability to determine a standard to measure gerrymandering as of now, the best path forward is still independent, citizen-driven redistricting. Azavea is currently working on revamping our DistrictBuilder software to do just that. Later this year, we’ll be launching a collaboration with the Committee of Seventy for Draw the Lines PA to put the sophisticated tools legislatures have in the hands of the people.