
Parks and open space are essential to healthy communities. Recent studies have shown that living far from parks can be a serious public health issue, while at the same time areas with higher access to parks have higher levels of physical fitness. Likewise, the inequalities of park distribution can have a negative impact on the well-being of our communities. A 2004 study by the Health Research and Policy Centers found that neighborhoods with higher poverty rates and higher proportions of racial minorities have less access to parks and green spaces. With these findings in mind, the Delaware Department of Natural Resources and Environmental Control, Division of Parks and Recreation (DPR) sought to understand the communities served by parks and plan for future needs of recreational facilities throughout the state. While this review process is required by the federal government every five years, known as a Statewide Comprehensive Outdoor Recreation Plan (SCORP), the DPR pursued using more vigorous analytical methods for analyzing distribution and access to parks than in past approaches. Azavea partnered with the DPR to develop a set of ArcGIS Model Builder tools to offer input on methodology and automate workflow for this report and future analyses.
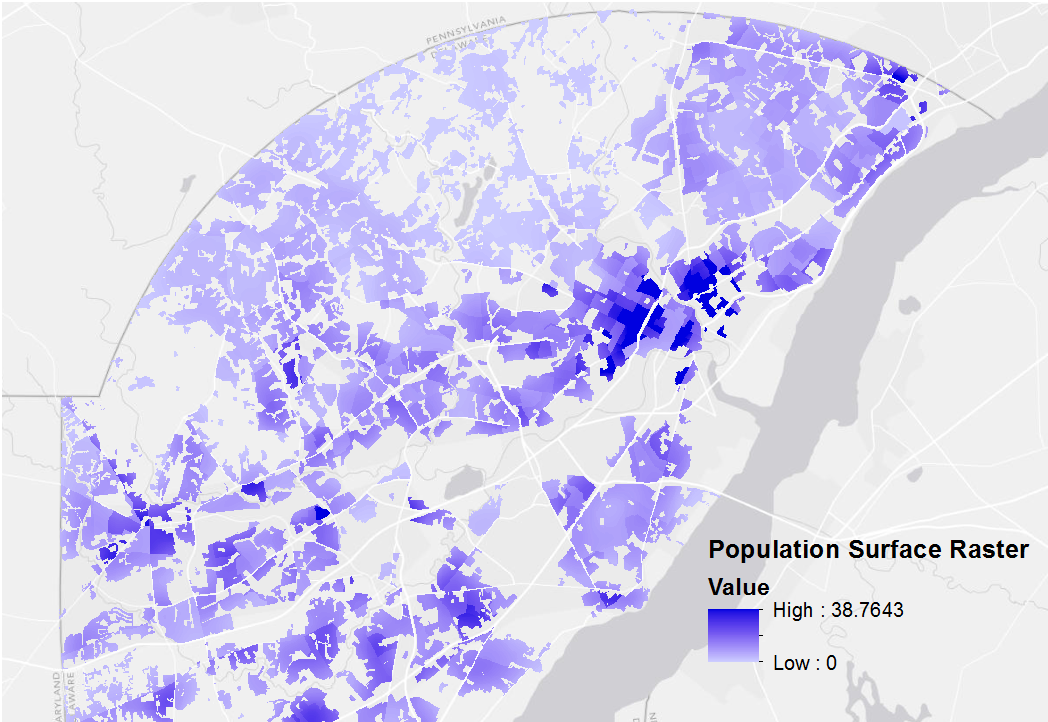
Population Allocation: The Division of Parks and Recreation wanted to use travel buffers to measure population served by their parks via walking, driving or public transit. Before we thought about how to construct accurate, real-world travel areas, first we had to develop a way to apportion population throughout the state. How does one fairly represent population distribution spatially? Our population source was the 2010 U.S. Census, which provides data at many geographic levels. In densely populated areas, these geographic levels, such as tracts and block groups, are rather small and compact. However, in rural areas they can be large and sprawling. This creates a problem with our travel buffers – they may only partially cover a census tract – so do we consider that population served? One option was to simply use the proportion of the census tract covered by the buffer to extract that same proportion of the total population in the tract. But, population is rarely distributed evenly in a census tract, particularly in rural ones. To solve this dilemma, we allocated population inside the census geographic areas by using a combination of land use and road density. Using ArcGIS Model Builder, we developed a set of processes to allocate population in each census tract based on where the people actually lived. First, by clipping out areas that had a non-residential land cover and allocating the census population total to those areas. Next, we used ArcGIS Raster Calculator to weight the remaining areas based on road density and allocate the population to raster cells based on that density – under the assumption that areas with a higher road density probably have more houses and thus more people. The final output is a raster surface of population with an estimated count for each 30 meter cell.
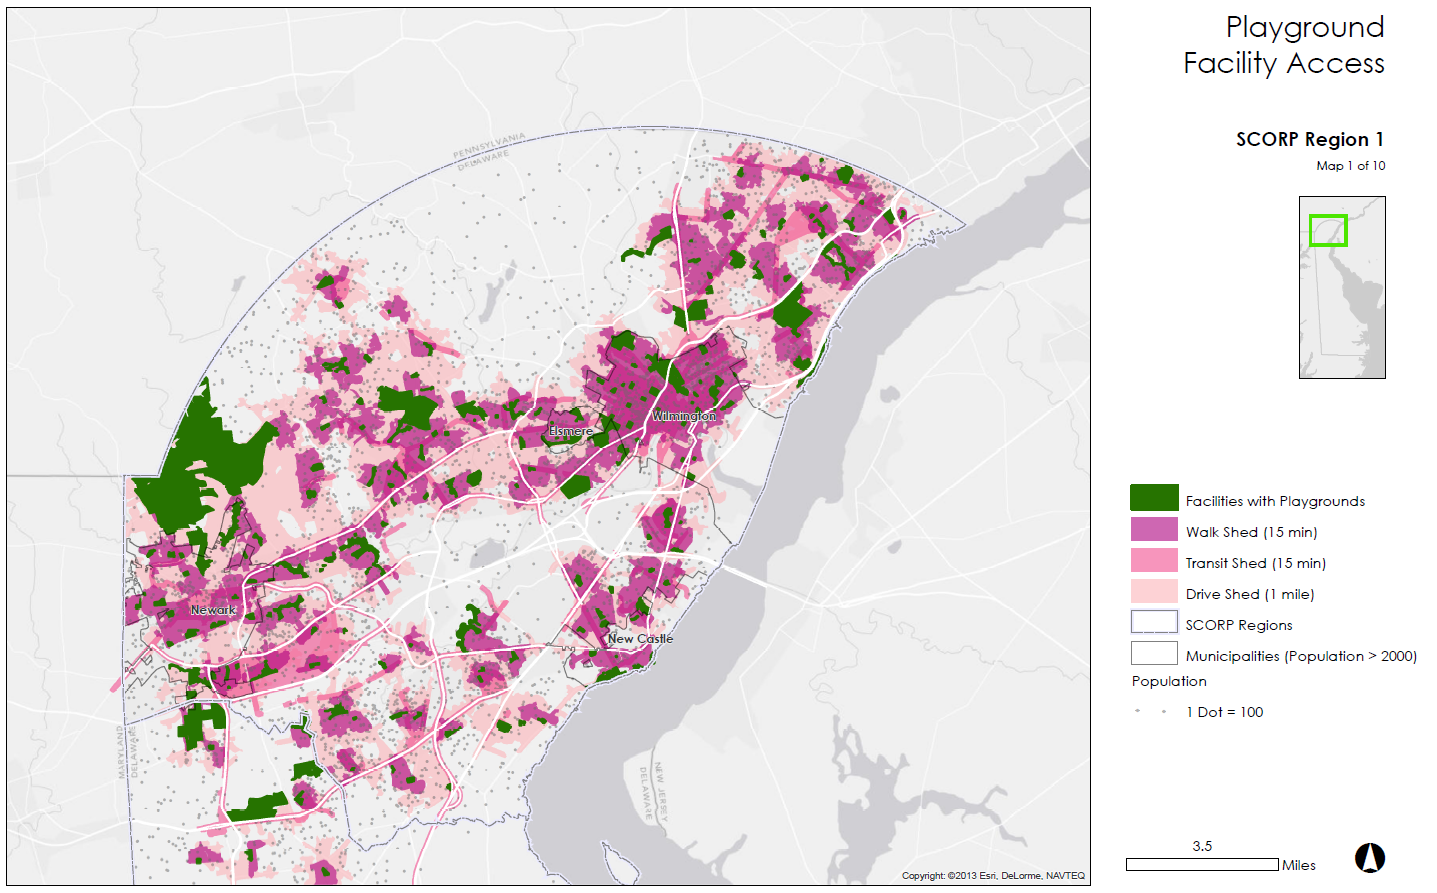
Calculating Travel-sheds: With our population problem solved, we had to move on to creating buffers around park facilities. The buffer is one of the basic GIS data processing routines. It’s an easy way to identify areas within a certain range of a point using linear (as-the-crow-flies) distance. In this project for the DPR, we sought to identify populations served using travel-time buffers, or travel sheds. If you’re familiar with our past work on walkshed.org, then imagine applying the concept to driving and public transit. The basic idea is to calculate distance based on a “cost” for traversing a road segment. In this case “cost” is the time required to travel the distance of the segment. Using the ArcGIS Network Analyst tools, we create service areas for each park based on the time it would take to reach the park using three modes of travel: car, walking and public transit. The result is a more accurate buffer around each parks based on the ability to reach it. In the final step we used the population map to count the estimated population within the service area of each park.
Stay tuned to the Azavea Atlas blog this summer, where we will go into more depth describing our methodology for using the General Transit Feed Specification (GTFS) data and creating a bus route network data set to create travel-sheds for public transit. This was an exciting project that really flexed our GIS muscles. If you would like to view the 2013 Statewide Comprehensive Outdoor Recreational Plan for Delaware, it’s available online now.