
The Data Analytics team crafted a series of in-office Lunch-and-Learn workshops this past summer. Geared towards non-profits, the series included three separate lunch-time events and highlighted how non-profits can begin to think about and process their data spatially. These sessions were so incredibly popular, we decided to repeat the series as webinars to reach a broader audience. This adapted webinar series was held in the fall and reached over 150 people. We are pleased to announce that the recordings of these webinars are available on YouTube. If you have any questions about the content, please do not hesitate to contact the Data Analytics team for more information!
The three-part series was comprised of the following sessions:
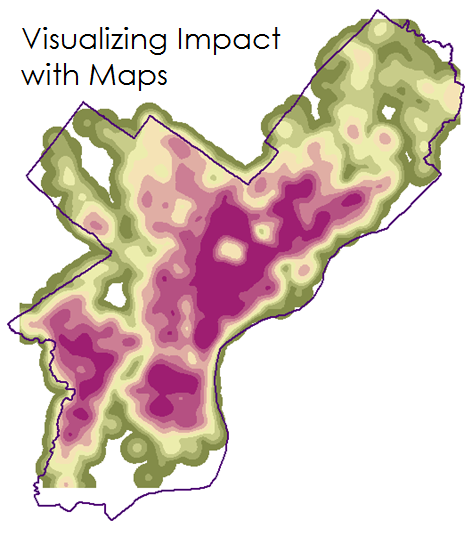
Visualizing Impact with Maps
Level of Difficulty: Beginner
Check out the video!
Supporting Materials:
Handout
Learn how to easily use the spatial data your organization already possesses to tell stories that will help you serve your constituents more efficiently.
Your organization has a wealth of constituent data, including addresses. While you don’t work with the data directly, you have a hunch it could be useful in your marketing and fundraising efforts, and to more clearly understand areas of need and the impacts your programs have had in the communities you serve.
Azavea’s Data Analytics Team explains what spatial data is and walk you through some of the common ways organizations can use their spatial data to better understand their constituents’ profiles and needs, and promote their work.
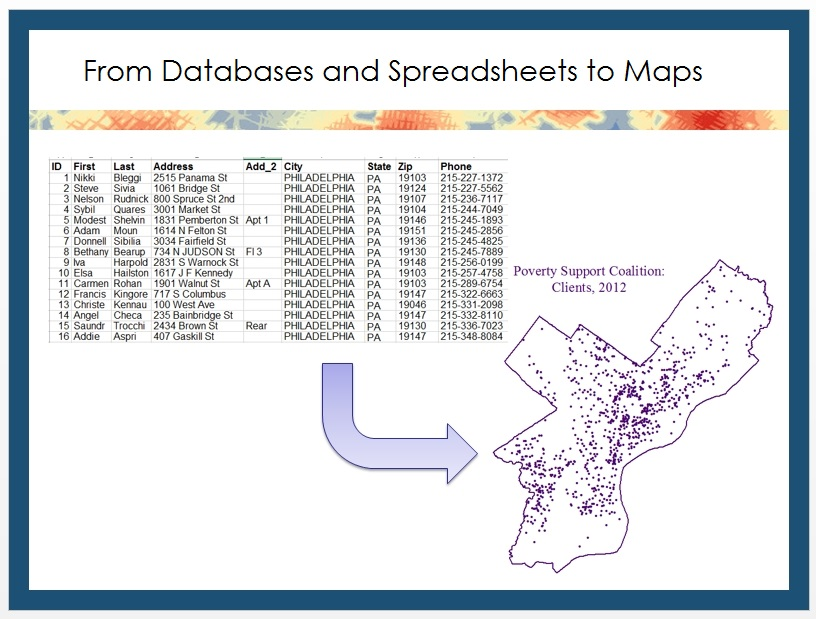
From Databases and Spreadsheets to Maps
Level of Difficulty: Intermediate
Check out the video!
Supporting Materials:
Handout
Tutorial
Learn how to quickly and simply create useful and understandable maps with your data and other relevant datasets freely available.
Azavea’s Data Analytics Team walks you step-by-step from raw tabular data to creating an understandable map, and explain the basics of Geographic Information Systems (GIS) processes.
Maps show funders and constituents areas of need while demonstrating where their support has already made a difference. They can also reveal where you should target your marketing efforts and areas where your organization’s services could be more effectively utilized. While you are comfortable working with your organization’s datasets, and you understand the usefulness of geographic visualization, you aren’t a mapping wizard but you’d like to know how to make meaningful maps.
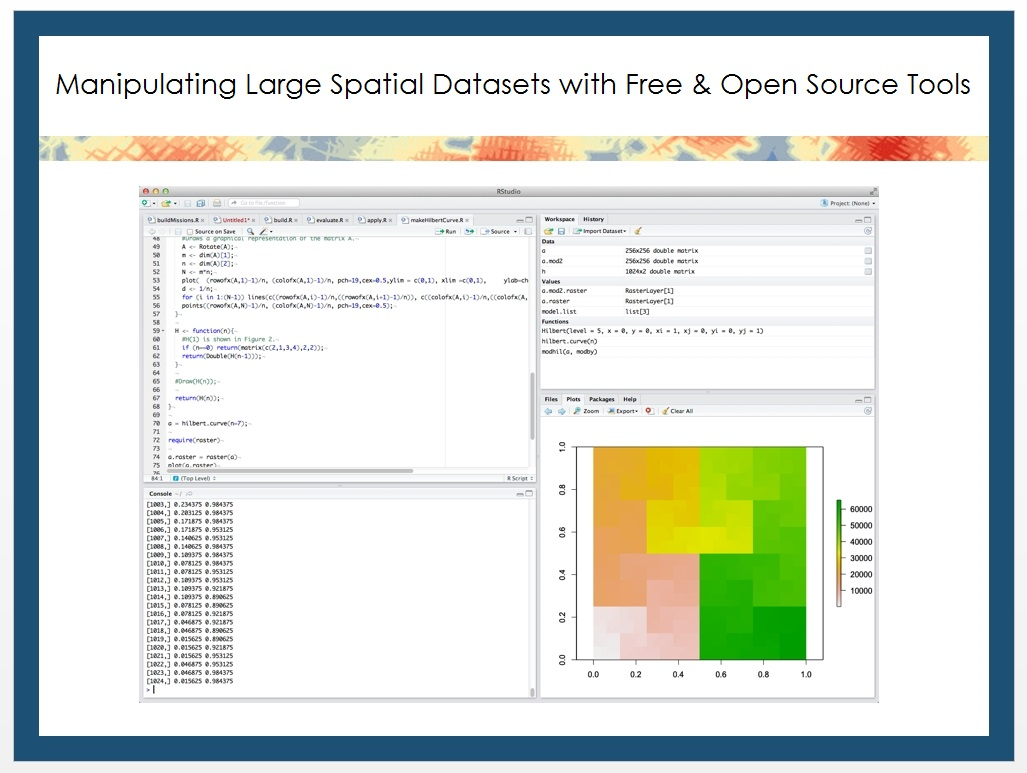
Large Spatial Datasets Manipulation with Free & Open Source Tools
Level of Difficulty: Experienced
Check out the video!
Supporting Materials:
Github Script
Large data sets often present unique challenges. Processes may fail or take long to complete. This session will cover how to use the free R package to manipulate large geographic data sets as a set of repeatable processes — helping you to automate your workflow and overcome these unique challenges. Ready to improve your scripting kung fu?