
![]() Azavea has made a bit of a name for itself in legislative redistricting. After the 2010 U.S. Census, we developed a set of white papers on the impact of redistricting at the local, state, and national level. We also worked with our partners at the Public Mapping Project, Michael McDonald and Micah Altman, to create DistrictBuilder, an open source software tool that enables the public to get involved in the redistricting process.
Azavea has made a bit of a name for itself in legislative redistricting. After the 2010 U.S. Census, we developed a set of white papers on the impact of redistricting at the local, state, and national level. We also worked with our partners at the Public Mapping Project, Michael McDonald and Micah Altman, to create DistrictBuilder, an open source software tool that enables the public to get involved in the redistricting process.
While each decennial census kicks off a redistricting process in the United States, it turns out that redistricting isn’t just a once-in-a-decade process. In order to maintain our Cicero product with the most up-to-date legislative districts, we are constantly monitoring redistricting as it occurs across the U.S., and it’s been a busy decade. This redistricting cycle has been especially contentious and litigious, with redrawn districts going into effect in three states for the election later this year. Here’s a rundown of what we’re tracking:
Florida
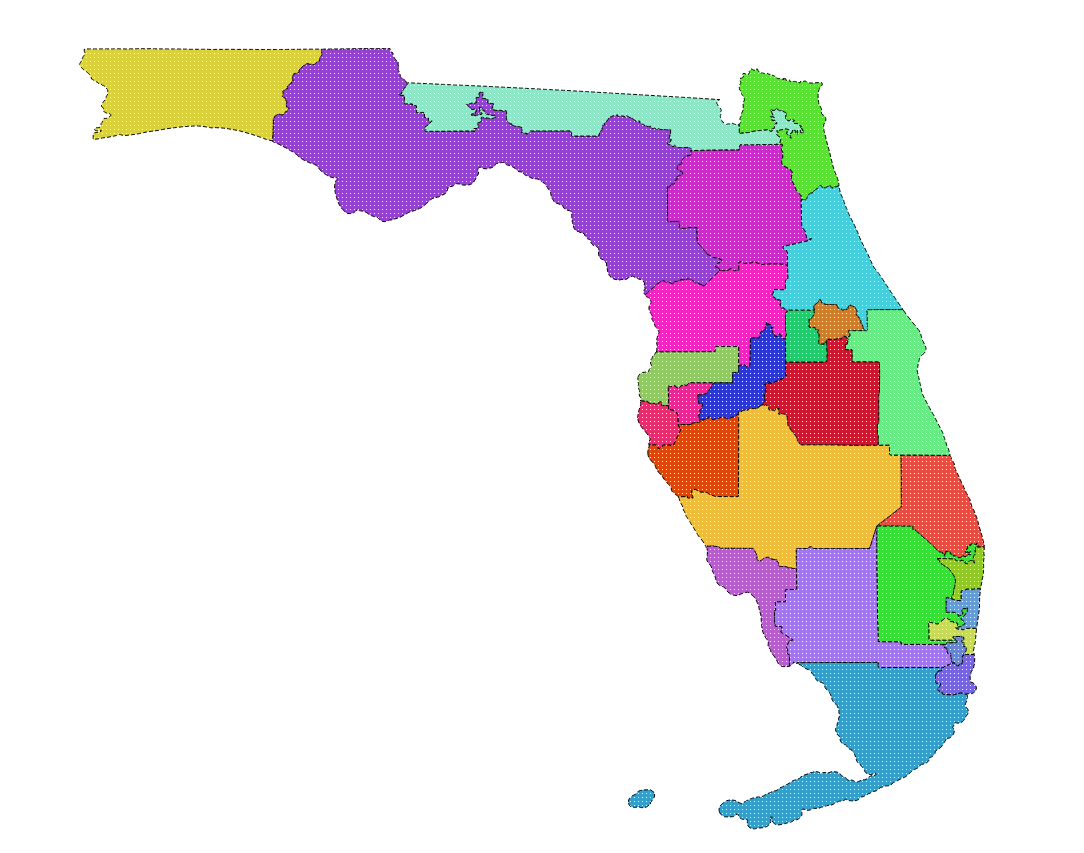 Florida was ahead of the curve when voters approved two constitutional amendments in 2010 in an effort to stop gerrymandering. The amendments mandated that Congressional and state legislative districts must not be drawn to favor any political party or deny minorities the right to elect representatives of their choice, and must be contiguous.
As it turns out, the legislature didn’t listen to the voters. The legislature’s Congressional and state legislative maps were immediately challenged in court in violation of the constitution. After a circuit court found that the Republican legislature indeed gerrymandered two Congressional districts, they were ordered to produce a new map. Then, the new map was challenged by the League of Women Voters and Common Cause, arguing the changes were superficial. The Florida Supreme Court agreed and overturned the circuit court’s decision to approve a remedial map and ruled that the legislature must come up with a new map in time for the 2016 election. Florida Governor Rick Scott decided not to act. So, the Supreme Court, in a 5-2 decision, approved a map created by the League of Women Voters and Common Cause. That Congressional map will go into effect for the 2016 election.
In addition to the Congressional map, the state legislative districts map was also challenged by the League of Women Voters. A circuit court judge approved their challenge and ordered new State Senate districts drawn. They were approved in late 2015 and then renumbered using an Excel randomizing function. The new State Senate districts will go into effect for the 2016 election.
North Carolina
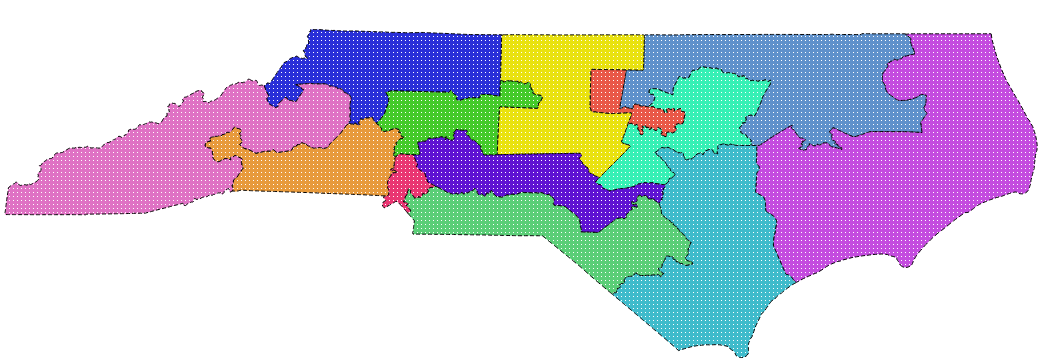
Like most states, the North Carolina legislature is tasked with redrawing Congressional districts. Unlike Florida, however, there is no constitutional provision to prevent gerrymandering. The legislature-drawn districts were instead challenged in court for violating the Voting Rights Act, on the grounds that “lawmakers created oddly-shaped districts to create clusters of Democratic-leaning black voters.” Basically, the plaintiffs argued that the districts were drawn using the classic gerrymandering technique known as “packing.” I recommend reading ProPublica’s excellent guide to common redistricting techniques, such as packing and cracking, for more information.
The plaintiff’s challenge against the districts was rejected by a trial court and the North Carolina State Supreme Court. The challenge was appealed all the way to the United States Supreme Court, asking the NC State Supreme Court to reconsider its ruling. Earlier this year, the United States District Court for the Middle District of North Carolina ordered that two of the state’s 13 districts were an illegal racial gerrymander. After an unsuccessful appeal of the ruling, the legislature passed a new Congressional map. However, in a bit of a surprise, the U.S. Supreme Court announced in June it would hear the legislature’s appeal. It’s unlikely to rule before the election, so the updated Congressional map will go into effect for the 2016 election.
Virginia
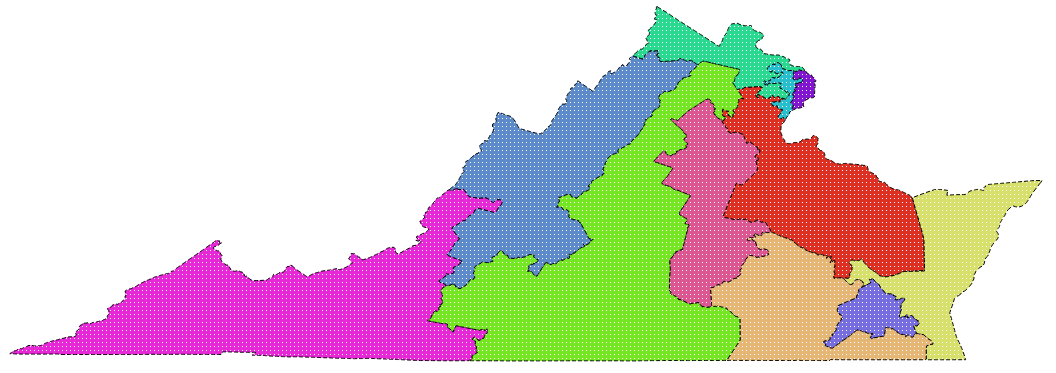
This is another state with legislature-drawn districts. Virginia’s Congressional map was struck down as a violation of the Voting Rights Act in 2014 after a successful challenge by opponents. Similar to the case in North Carolina, the reasoning was that several districts were an illegal racial gerrymander. The case was appealed to the U.S. Supreme Court but sent back to a district court which reaffirmed the earlier ruling. The state legislature was given a deadline to draw new districts but failed to do so, so the task went to a panel of federal judges.
Earlier this year, the newly-drawn Congressional districts were challenged by a group of Republican lawmakers, arguing the new map would result in “mass voter confusion.” Their challenge was ultimately denied by the U.S. Supreme Court, so the new districts will go into effect for the 2016 election.
Texas
Texas might be home to one of the most complicated redistricting legal battles of this decade. Due to the Voting Rights Act, many states (mostly in the South) are subject to preclearance by the U.S. Department of Justice for any change in election laws, including redistricting plans. Following Texas’s redistricting in 2011, the U.S. DOJ rejected the legislature-drawn plans. Texas Attorney General Greg Abbott immediately petitioned this ruling but was denied by a Federal Court. The Court also halted the map’s implementation and introduced its own interim plan to use in the 2012 election. During an appeal to the U.S. Supreme Court, they struck down the lower court’s interim districts, ruling they had exceeded their authority. The lower court then denied preclearance to the legislature-drawn Texas districts.
Finally, in the landmark Shelby County v. Holder, the U.S. Supreme Court vacated the refusal of preclearance by the lower court and effectively removed the preclearance requirement of the Voting Rights Act. This ruling has wide-reaching implications, removing the preclearance requirement for not just redistricting — but elections laws in general across many states. This means that it will be easier for states, some of which have a history of discriminatory laws against voters, to pass election laws and redistricting plans without approval from the federal government.
A federal court in Texas ruled last year that the existing districts can be used for the 2016 election. However, even in their ruling, they stopped short of a final decision, arguing that a change this close to the election would be disruptive — but leaving the door open for another decision after the 2016 election.
Want to learn more about where redistricting stands?
 Ballotpedia is a great resource for comprehensive information for each state. And there was much more litigation around redistricting than I covered here, Loyola University’s All About Redistricting explores it in detail with links to relevant court documents. You can also check out Azavea’s white papers on redistricting or download the 115th Congressional districts shapefile.