
Census Data Doesn’t Have to Be Difficult
One of the largest and best free sources of data in the US is the Census Bureau’s American Fact Finder. It’s a searchable database of all of the nation’s Census counts and American Community Survey (ACS). ACS data is collected on a rolling basis, with 1, 3, and 5-year release cycles with diminishing margins of error. This data spans sea to sea from every locality in the US, and includes tens of thousands of combinations of social and demographic information. The data is also collected by many different geographic summary levels, which you can learn about here.
Finding and using Census data is also difficult. This is why we often turn to CensusReporter.org to rapidly explore and acquire Census Data. A small team of Knight Foundation-funded developers created CensusReporter to facilitate data exploration and download. CensusReporter always uses the most recent year of complete Census or ACS data, depending on the geography collected. You can see an overview of the tables that CensusReporter provides here.
An Intro To CensusReporter
Head to censusreporter.org You’ll be confronted by two large options: Profile, and Explore.
Let’s start with Profile. Type Minneapolis, MN into the Profile search box. You’ll see multiple results come up. CensusReporter will return each geography that contains a place. So we see one result for Minneapolis the place and one for Hennepin County. Choose Minneapolis, MN the place. Check out the map near the top after you’ve made your selection:

Now scroll down the page and see data grouped by:
- Demographics
- Economics
- Families
- Housing
- Social
Digestible charts and graphs break down each subject. These graphics may be embedded on a webpage, like so:
Click “show data” under the pie chart for Age. A table will expand below that breaks down the age information. From here you could also click “View Table” to see the source data. Go ahead and click through to the table.
Tables, Maps, and Distributions
After clicking through to the source data table, you should see a table that displays the age breakdown for Minneapolis. You should notice a graphic above that says “Table Map Distribution”:

If you click distribution, you’ll be able to see some basic statistics about each of the different variables. You may also click on the Map button, and see Minneapolis, MN on a map. It’s not very informative to see just a big blob of a city with no population breakdown, so click on Table again.
Dividing Up Geographies
What we want to see is population by Census Tract. On the Table page, look at the lefthand tab. Near the bottom, there is a heading entitled “Divide Minneapolis, MN into…”
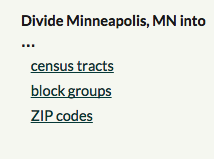
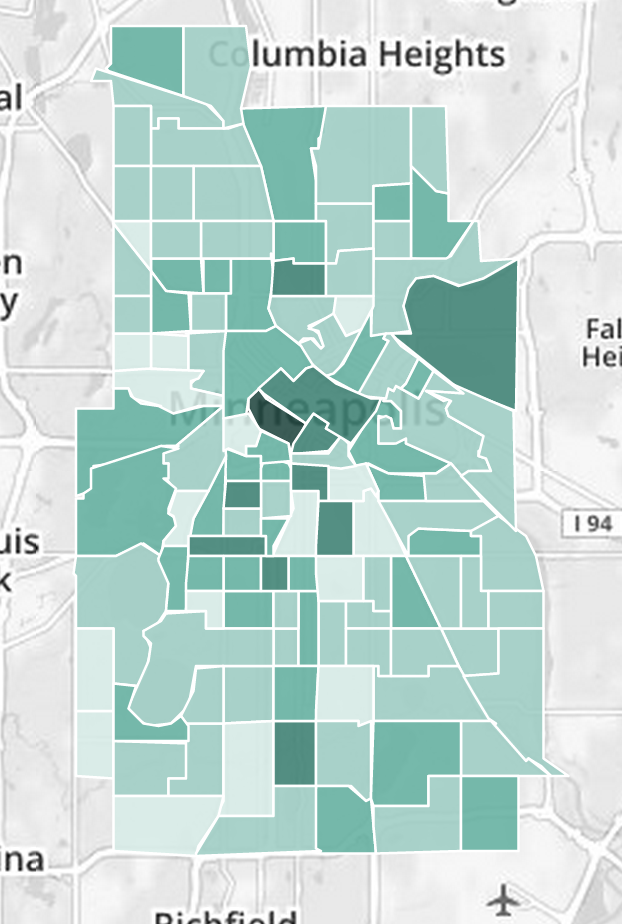
and shows the geographies that the city can be broken into below, including census tracts, block groups, and zip codes. Click census tracts. The main table will have changed a bit. Go back to the top of the page and click Map. Now we can actually see the differences in the age of the population across the city.
Downloading the Geographic Data
Now that we’ve divided the data up by census tract, we can download the data for our own use. On the Map screen, just to the right of the Table/Map/Distribution buttons, you’ll see “Download Data”. Hover over that and you’ll see the various text data formats and geographic formats you can download. CSV and Excel are great for joining to pre-existing geographic data. Geojson is great for web maps. And KML and Shapefile are both standard geographic data formats that can be used in Google Earth or ArcGIS, respectively.
The 5 Steps to Download Geographic Census Data
- Go to CensusReporter.org
- Search for a place
- Search for Data
- Click “Divide Into” a given geography
- Click Download Data
Our Data Analytics team uses census data for a lot of our spatial analysis projects. Read about a recent project that used census data to analyze spatial patterns in life expectancy.