
Now in its third year, Azavea’s Summer of Maps Program has become an important resource for non-profits and student GIS analysts alike. Non-profits receive pro bono spatial analysis work that can enhance their business decision-making processes and programmatic activities, while students benefit from Azavea mentors’ experience and expertise. This year, three fellows worked on projects for six organizations that spanned a variety of topics and geographic regions. This blog series documents some of their accomplishments and challenges during their fellowship. Our 2014 sponsors, Google, Esri and PennDesign helped make this program possible. For more information about the program, please fill out the form on the Summer of Maps website.
An ‘Atypical’ Approach to Analyzing Tree Canopy Cover
As part of Azavea’s Summer of Maps program, I elected to work with TreePeople, a Los Angeles based environmental non-profit with a goal of ensuring the sustainable future of L.A. by expanding and maintaining the city’s tree canopy. I have always had an interest in sustainability, so I jumped at the chance to work with such an environmentally-focused organization. TreePeople was seeking GIS analysis to further understand the relationship between public health and socioeconomic characteristics in the city of Los Angeles with the city’s tree canopy cover (TCC). Their aspirations for the project were to understand in which neighborhoods of L.A. they should focus their resources, according to the correlation. Before I even began looking for pertinent data sources, I performed some rudimentary research on the health and societal benefits of trees, especially on the West Coast and in a city infamous for its air pollution problems. I was pleasantly surprised to learn that many scientists have found evidence stating that trees can help people to live healthier, happy lives. A recent article published in The Atlantic found that the U.S. TCC averts $6.8 billion in health care costs each year, simply by existing.
Besides their environmental effects, in which trees remove carbon from the atmosphere – they are often used as offsets for carbon emissions – many scientists understand trees to have positive psychological effects on the human population, including decreased depression due to the presence of greenery, and decreased crime rates. In their publication in Landscape and Urban Planning, Troy, Grove, and O’Neil-Dunne (2012) found that in Baltimore, a 10% increase in TCC was associated with a 12% decrease in crime. While some scholars are not fully on board with some of these findings, more and more evidence is pointing towards the positive aspects of having trees in our residential and urban centers. Due to the fact that Los Angeles is stricken with severe air pollution problems, one can expect that certain respiratory conditions, like asthma, are very prevalent in the region. In a world where 7 million people die from air pollution every year, according to the World Health Organization’s March 2014 publication, it is crucial that all measures to reduce pollutants are taken, which includes planting trees. Taken from the above listed The Atlantic article, scientists found that in 2010, the presence of trees in the United States prevented 850 human deaths and nearly 670,000 cases of acute respiratory symptoms, like asthma. If more trees were to be planted, a situation similar to the crime correlation in Baltimore could potentially result. Using this information on what variables are thought to be directly influenced by the presence of trees, we began searching for data specific to the Los Angeles region. Using the data that was provided by TreePeople and finding our own on various websites, such as the site of the California Office of Environmental Health Hazard Assessment (OEHHA), we were able to obtain numerical figures for 10 variables, broken down into smaller geographic areas of the city of Los Angeles, including census tract and health district levels. With the help of TreePeople, we ranked our variables according to their importance and proposed correlation to TCC:
|
Variable Name |
Weighting |
|
Asthma |
15% |
|
Diabetes |
15% |
|
Obesity |
15% |
|
Minority races |
10% |
|
Traffic density |
10% |
|
Linguistic isolation |
10% |
|
Poverty |
10% |
|
Unemployment |
5% |
|
Low birth weight |
5% |
|
Educational attainment |
5% |
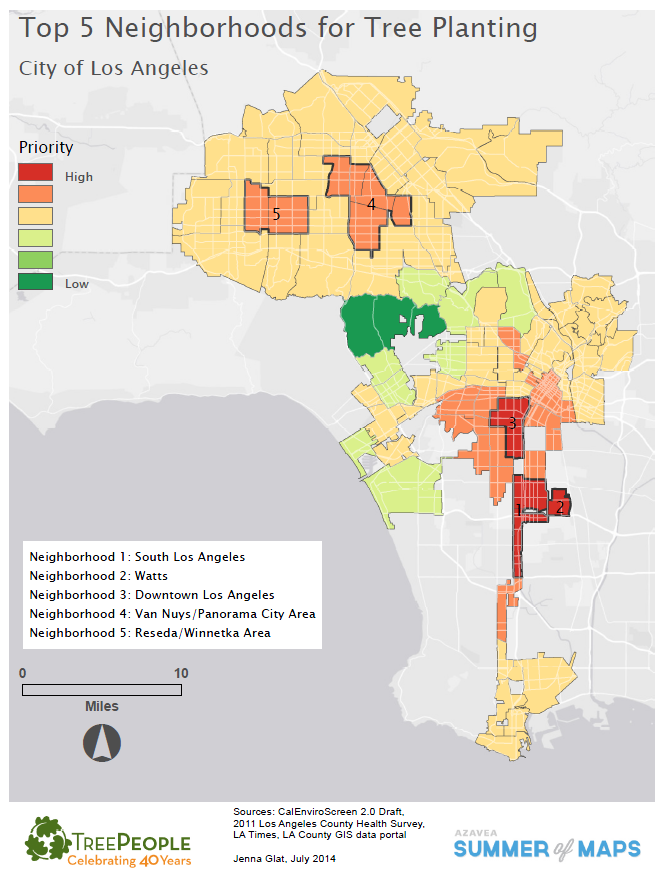
Using the assigned weights, we used the Weighted Sum tool in ArcMap 10.2 to mathematically combine all of the rasterized factors into one layer and determine which parts of the city had the highest need – where the highest values (out of 100) were found. What resulted was the following, where the dark reddish-brown color indicates the priority areas with the highest need.
From this map, we were able to determine the neighborhoods in the city that contained the highest values, broken up by neighborhood council delineation, as established by the Los Angeles government. TreePeople will use these designations to determine where they want to focus their efforts to increase tree canopy by planting trees and increasing awareness. We found that the top 5 ranked neighborhoods were all located in South Los Angeles and Downtown Los Angeles, but that there were two neighborhoods in the Panorama City and Winnetka areas that also demonstrated a high need for tree plantings, which we chose to study as well.
Finally, once we had reached this point, it was time to add in the original tree canopy cover data that we had been given by TreePeople. One might believe that starting with this data set would have been the most logical way to tackle this GIS project, but I find that understanding the situation in more depth and then using the tree canopy cover to confirm the findings produces a more comprehensive result.
While analyzing solely TCC does not pick out the same 5 neighborhoods as an analysis of correlated variables does, the 5 neighborhoods that we had originally selected are on the lower spectrum of TCC, and provide TreePeople with different neighborhoods to investigate that they otherwise may have missed out on by simply analyzing the map of TCC. Using this ‘different’ method to complete the project shows that one’s first instinct is not the only way to take on a project, and that more communities may benefit in the long run from an atypical analysis. It is important to look at a project from multiple dimensions in order to fully understand and complete it.